Last Updated or created 2024-08-12
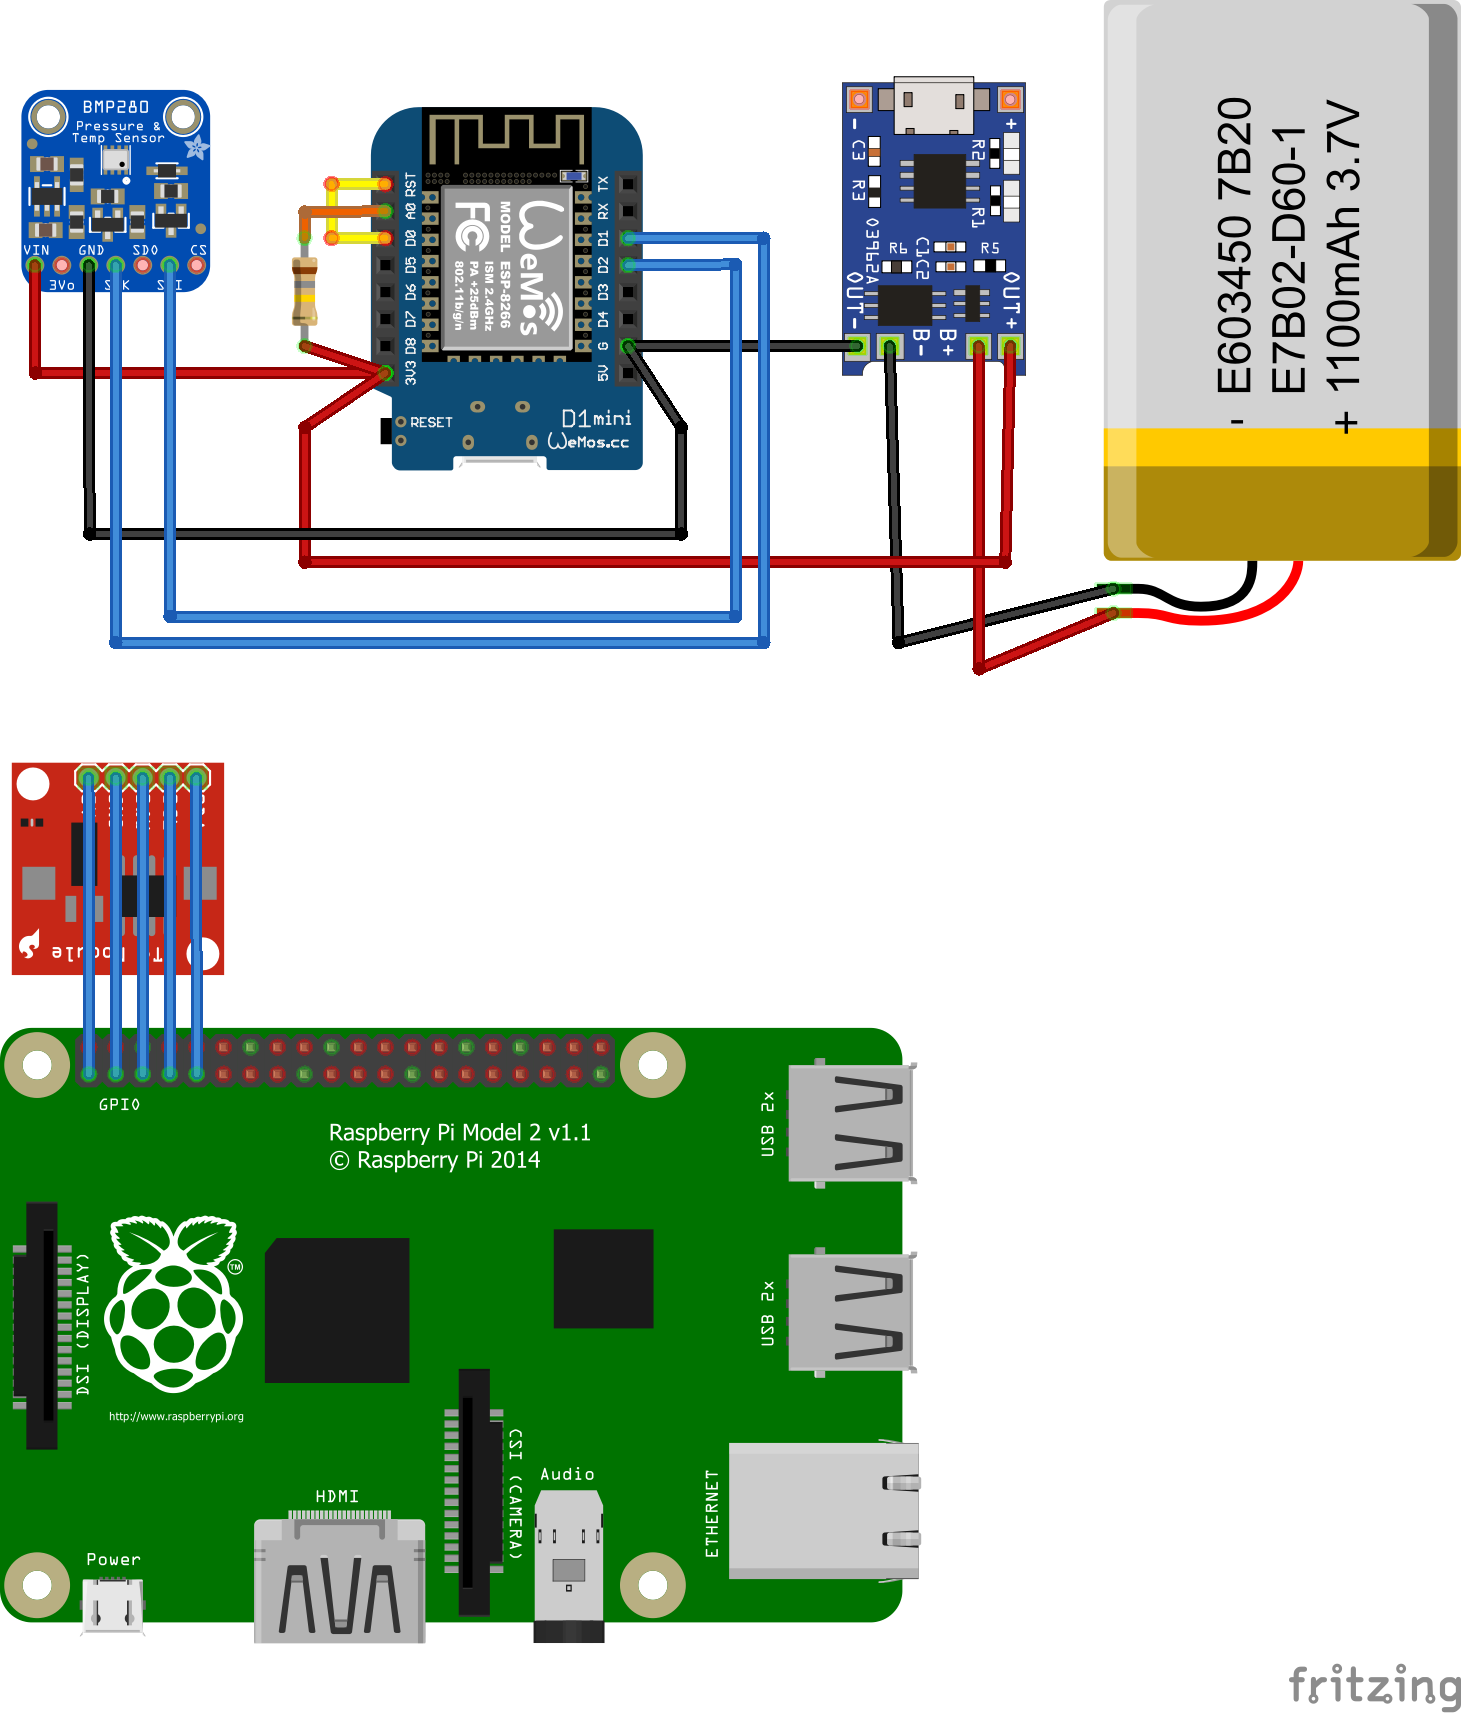
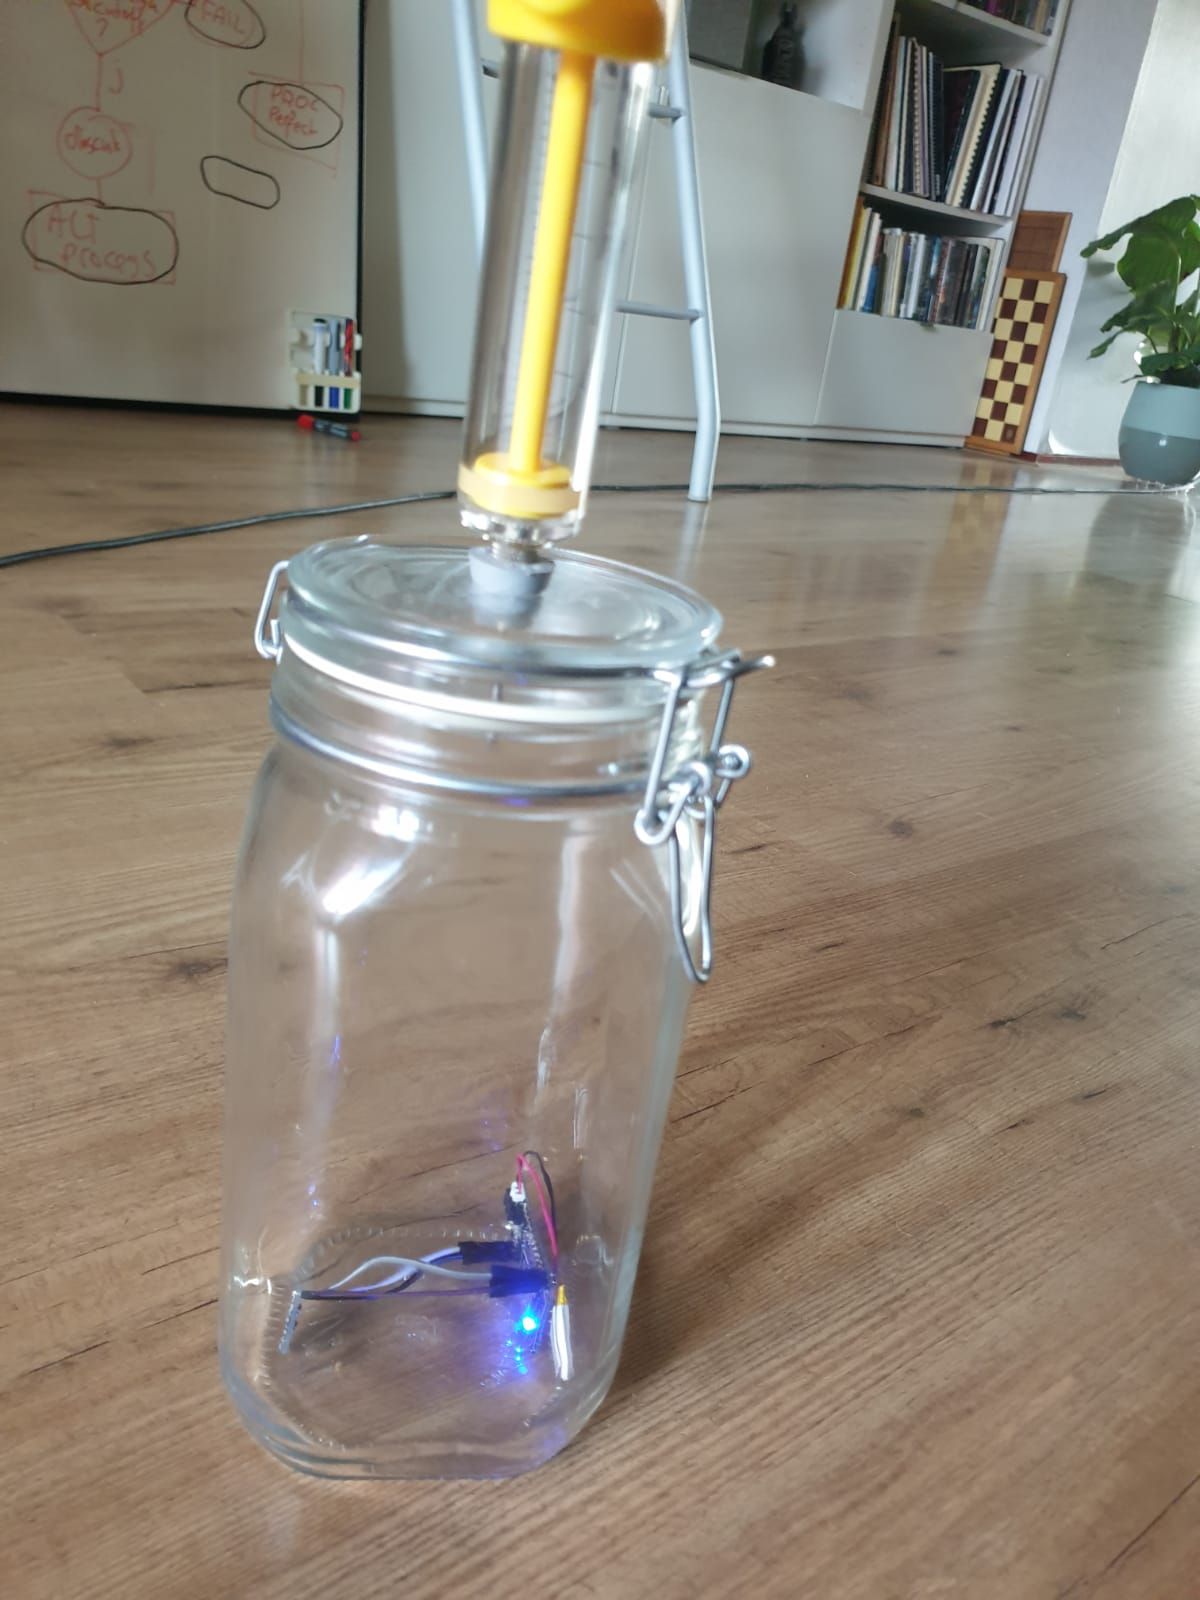
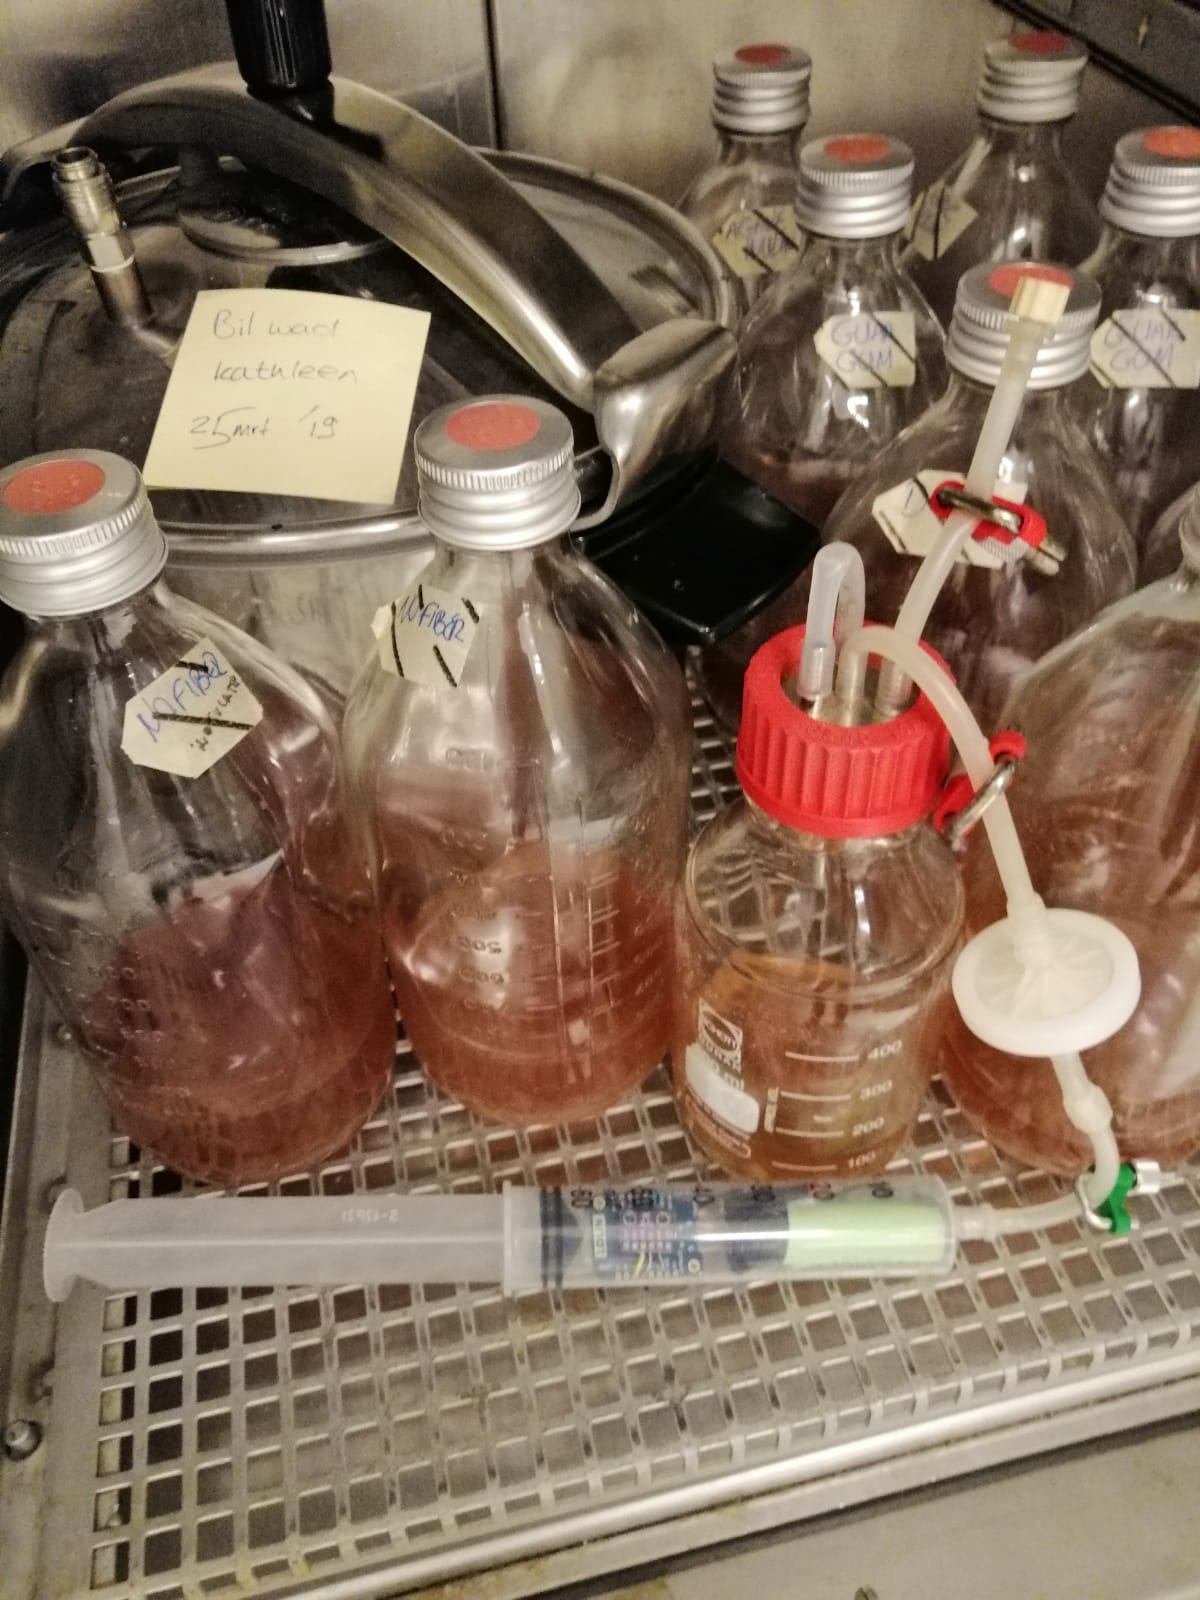
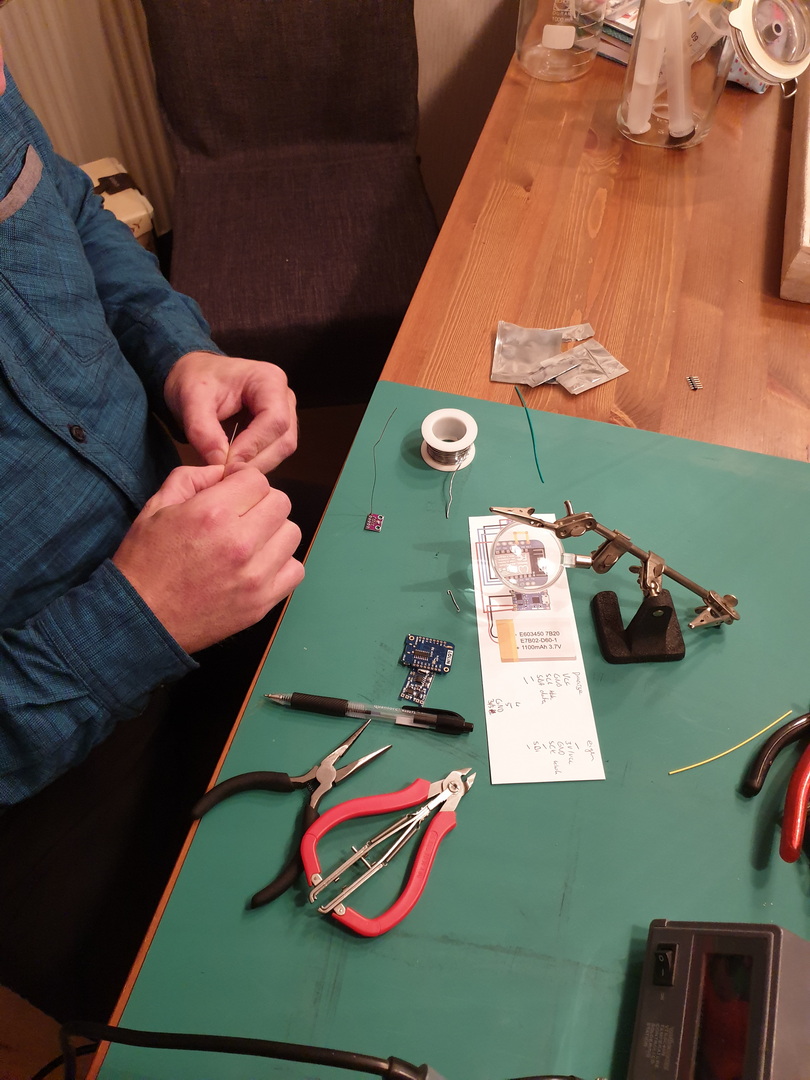
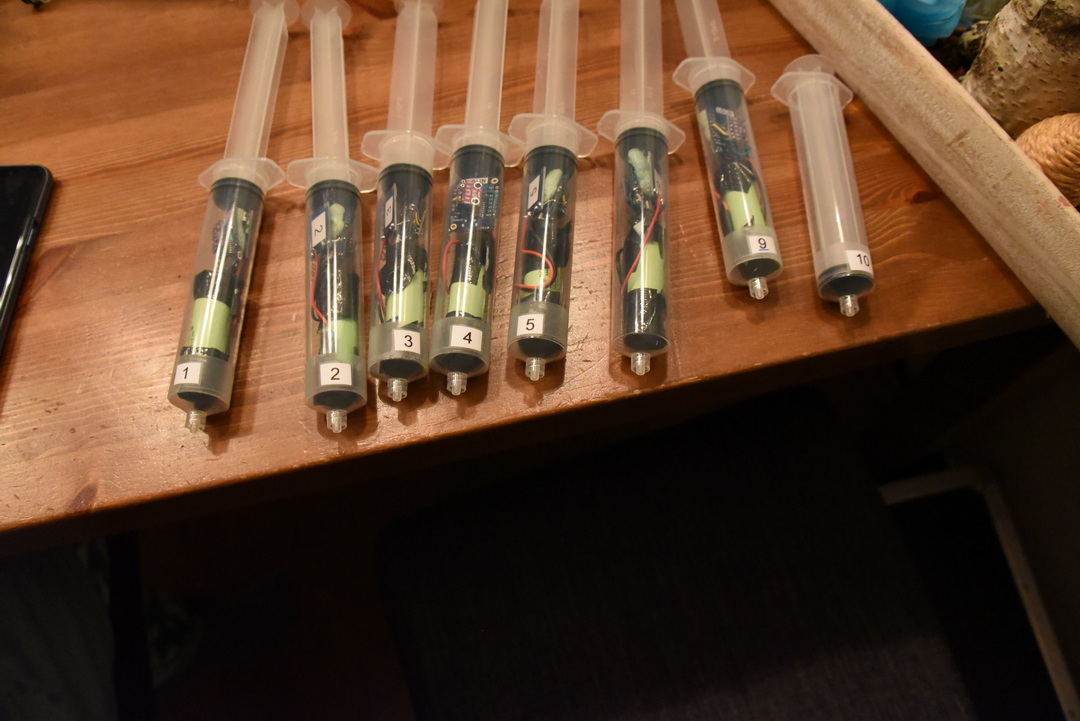
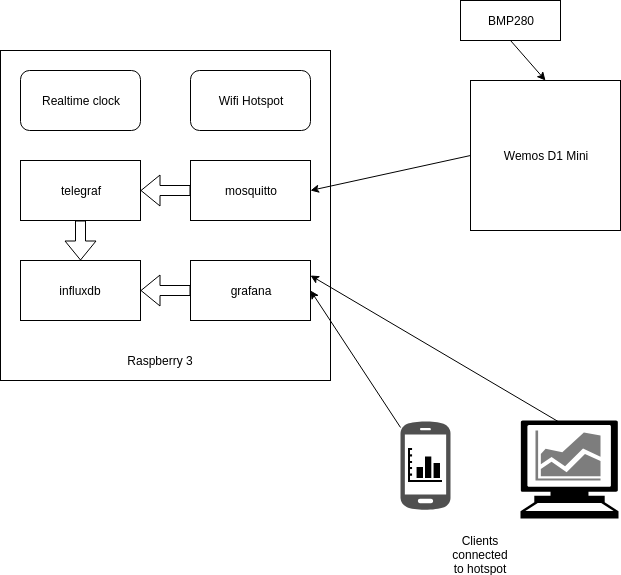
For measuring pressure in fermentation containers, I designed a pressure sensor which could be wireless connected to a fermentation container.
The sensor would transmit the values to a Raspberry which was configured as a Access Point and would store the measurements and generated graphs using Grafana.

Nodes config:
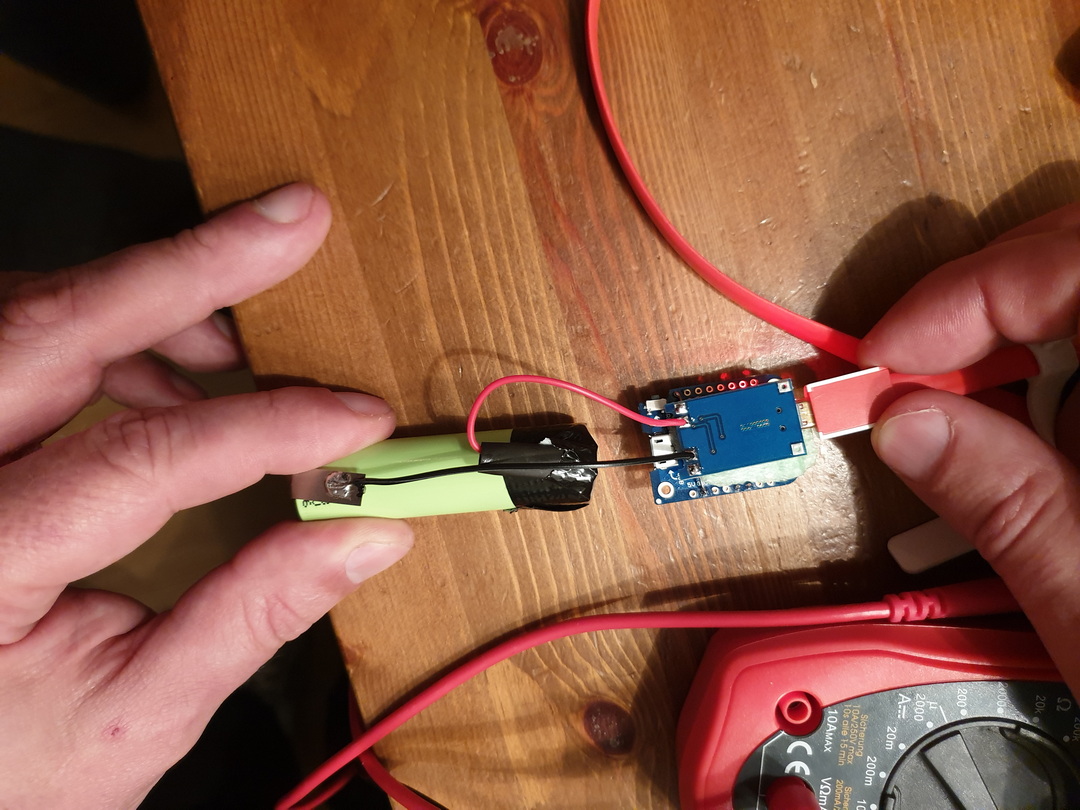
Esp configuration, connect with micro-usb
Flashing with linux
esptool.py -p /dev/ttyUSB0 write_flash 0x00000 ESP_Easy_mega-20190311_normal_ESP8266_4M.binMake a connection with the ESP Access point
Connect esp with a power source.
Look for a AP with ESP_Easy_0
Use password “configesp” to connect
Start you browser and enter http://192.168.4.1
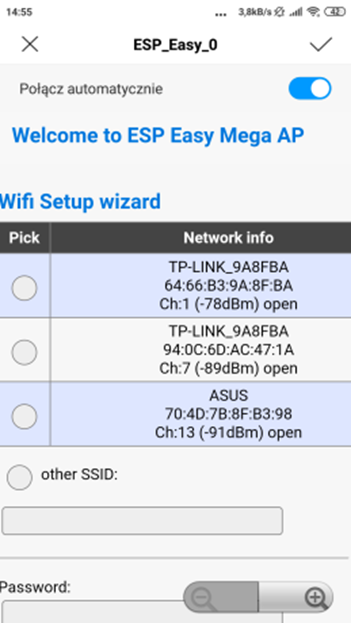
In wifi wizard setup select “pressurespot”
Enter password “pressurespot”
Press connect
Wait 20s and look in the raspberry logs which IP the ESP got.
Connect laptop/mobile to wifi “pressurespot”and connect
Enter found IP from ESP in your browser.
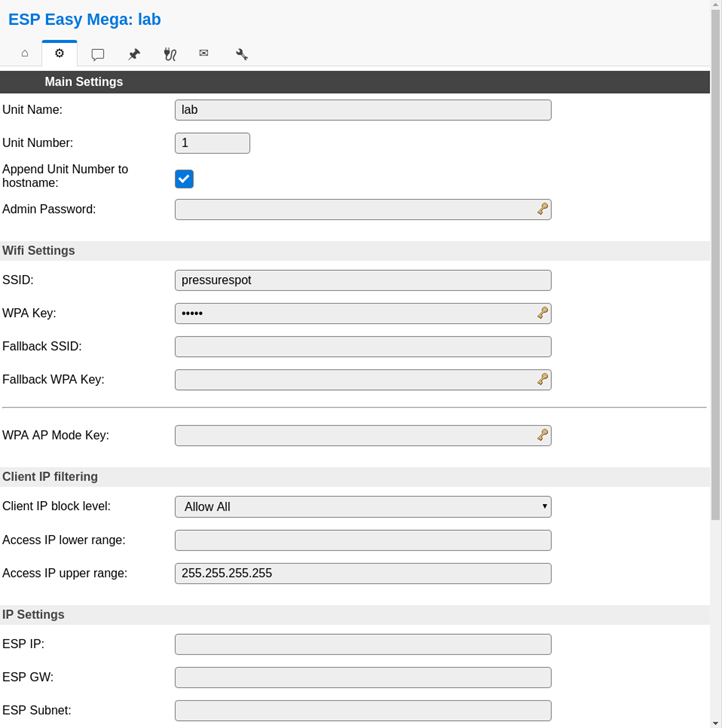
Proceed to main config
Main setting table, set the following
- Unit name & number + append
- SSID and WPA key pressurespot
- Client IP block level allow all
- Press submit
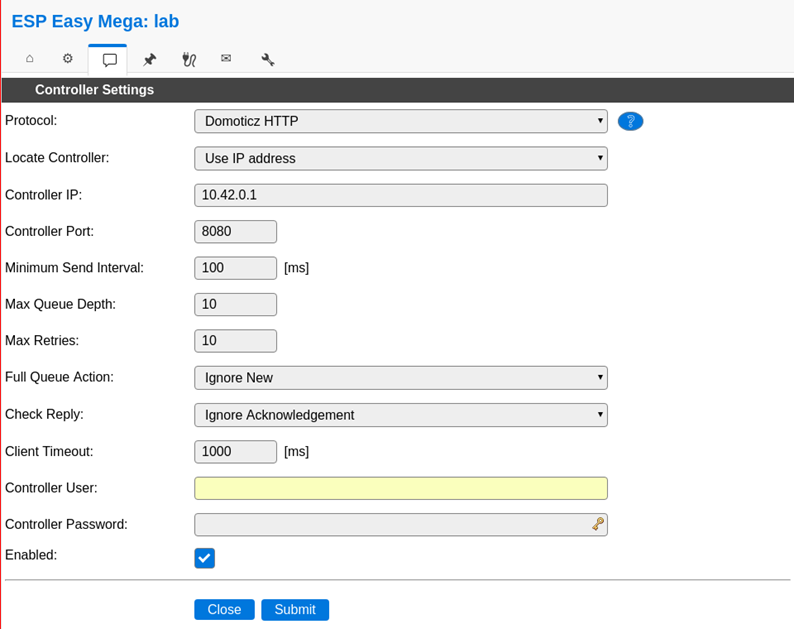
Press controller tab
Press first edit button and set following
– Protocol: domoticz http
Next set
– Controller IP : 10.42.0.1
– Toggle enabled and press submit
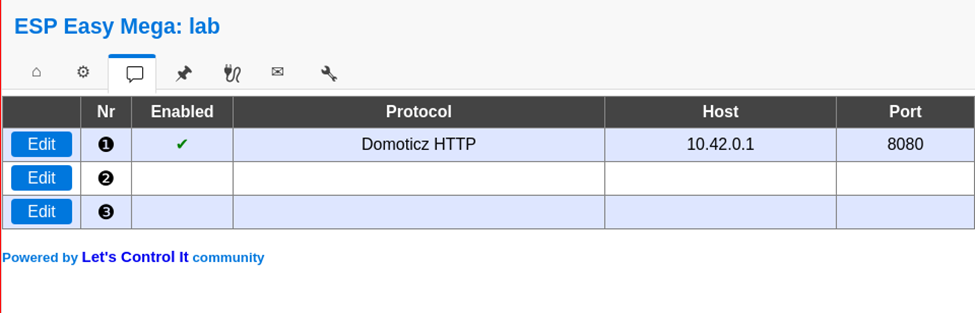
Resulting in:
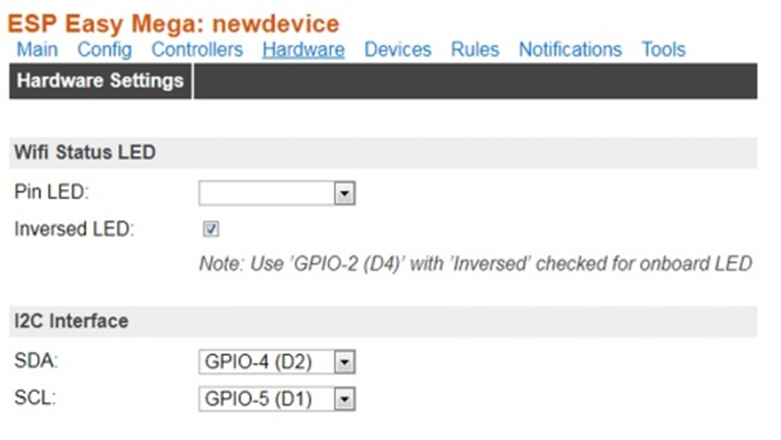
Next we got to Hardware
I2C interface switch GPIO-4 and GPIO-5
- GPIO – SDA: GPIO-4 (D2) change to GPIO-5 (D1)
- GPIO – SCL: GPIO-5 (D1) change to GPIO-4 (D2)
- Press “Submit”
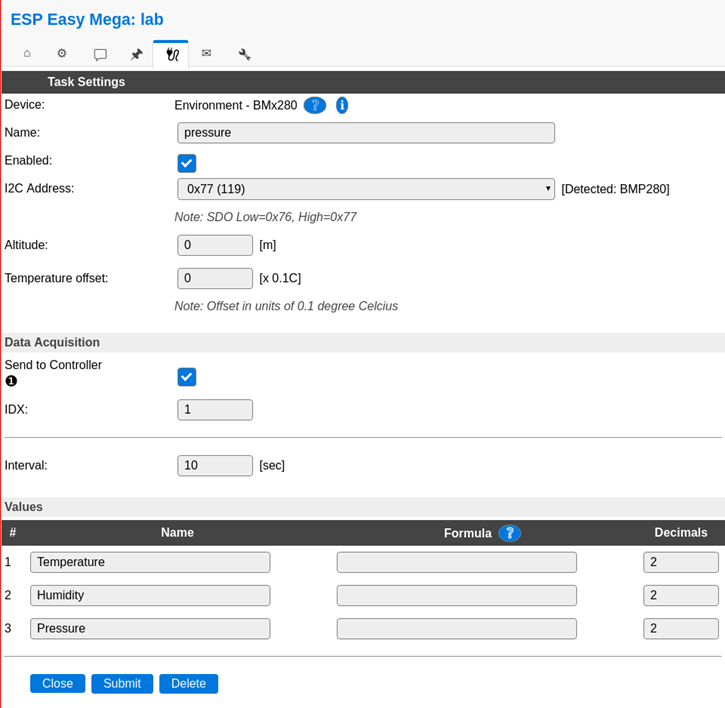
Devices TAB
Press edit, and select device “Environment – BMx280” from the pulldown menu.
Next, set the following
- Name: pressure
- Enable on
- I2C address : 0x76 ( Is there is no 0x76 of 0x77 .. do a i2c scan on the next tab )
- Send to controller , mark this
- IDX: give this the number you had given this node (this is the one you have to use in domoticz )
- interval 10Seconds
- and press submit
In the Devices tab, you should be able to see the sensor with the values (Temperature and pressure)
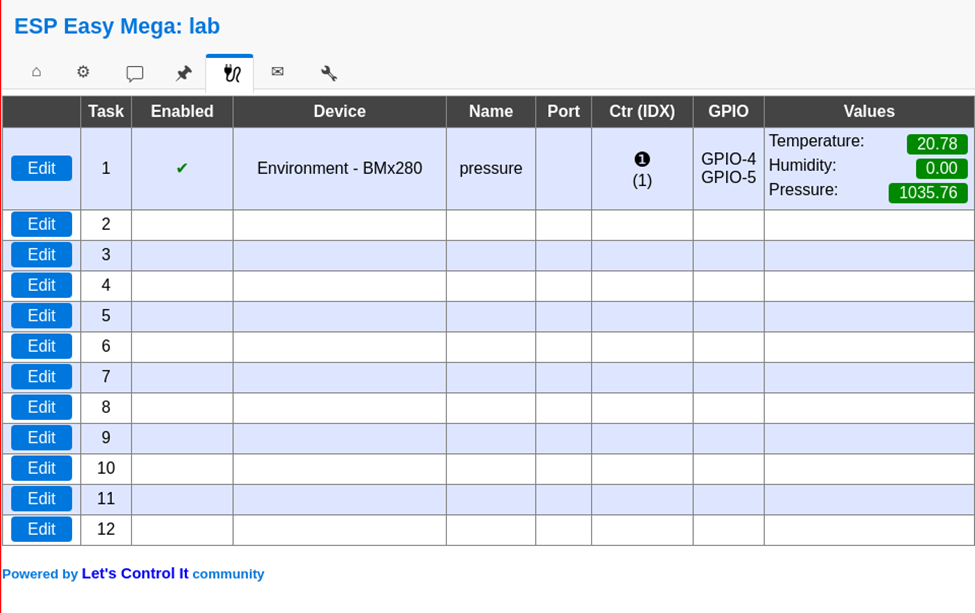
No values? Do a i2c scan and/or reboot ESP ( You can find these in the tools tab)
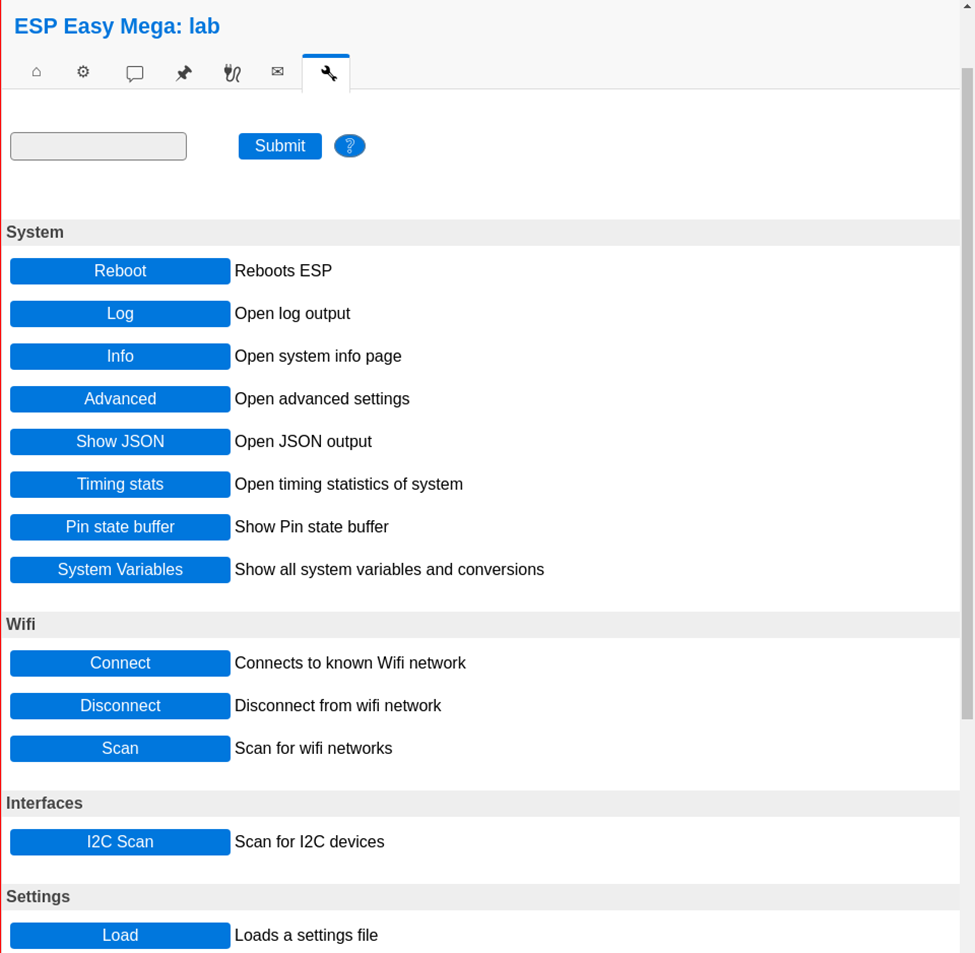
Tools TAB
Press I2C scan, when seeing a address like 0x76 or 0x77 use this in previous tabs.
Still nothing, even after reboot? Maybe faulty hardware?
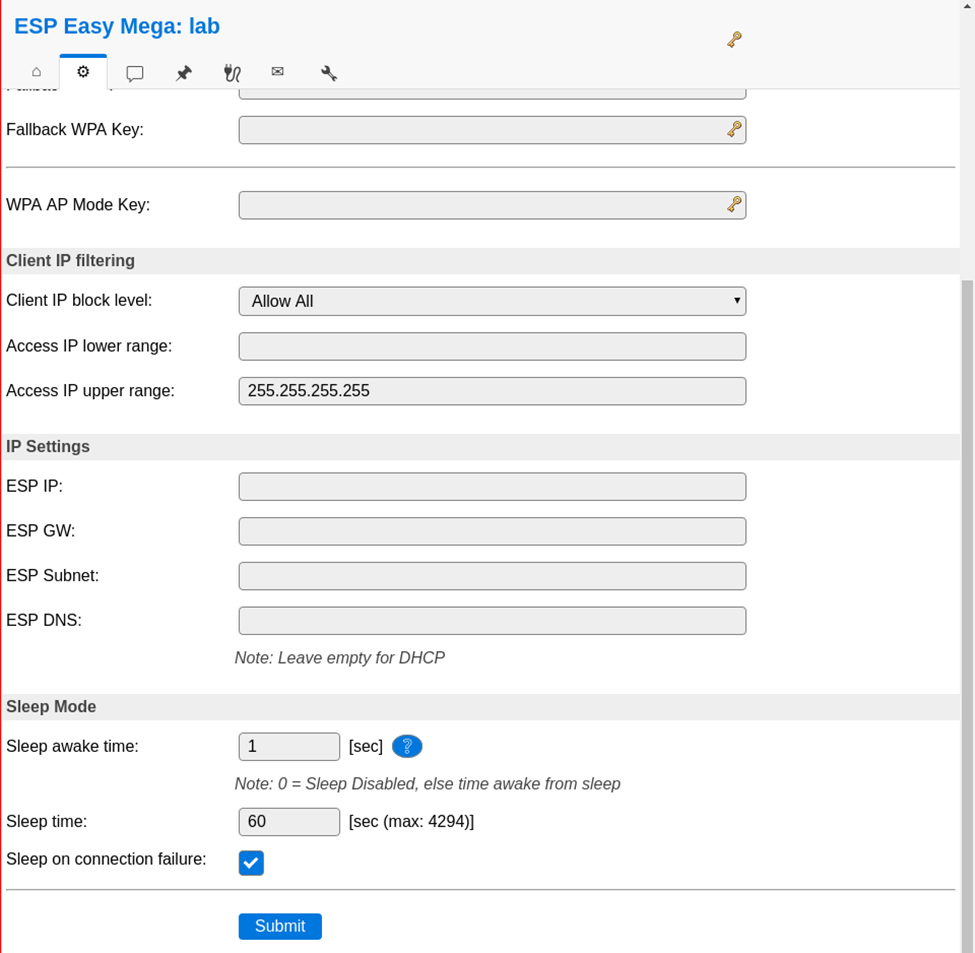
Everything okay? Back to the config tab
We are going to set the sleep mode.
Warning ! .. when setting this it is hard to get into the config pages again.
ESP will startup, connect to wifi, send values and goes to sleep again.
At the bottom set: Sleep awake time 1 sec
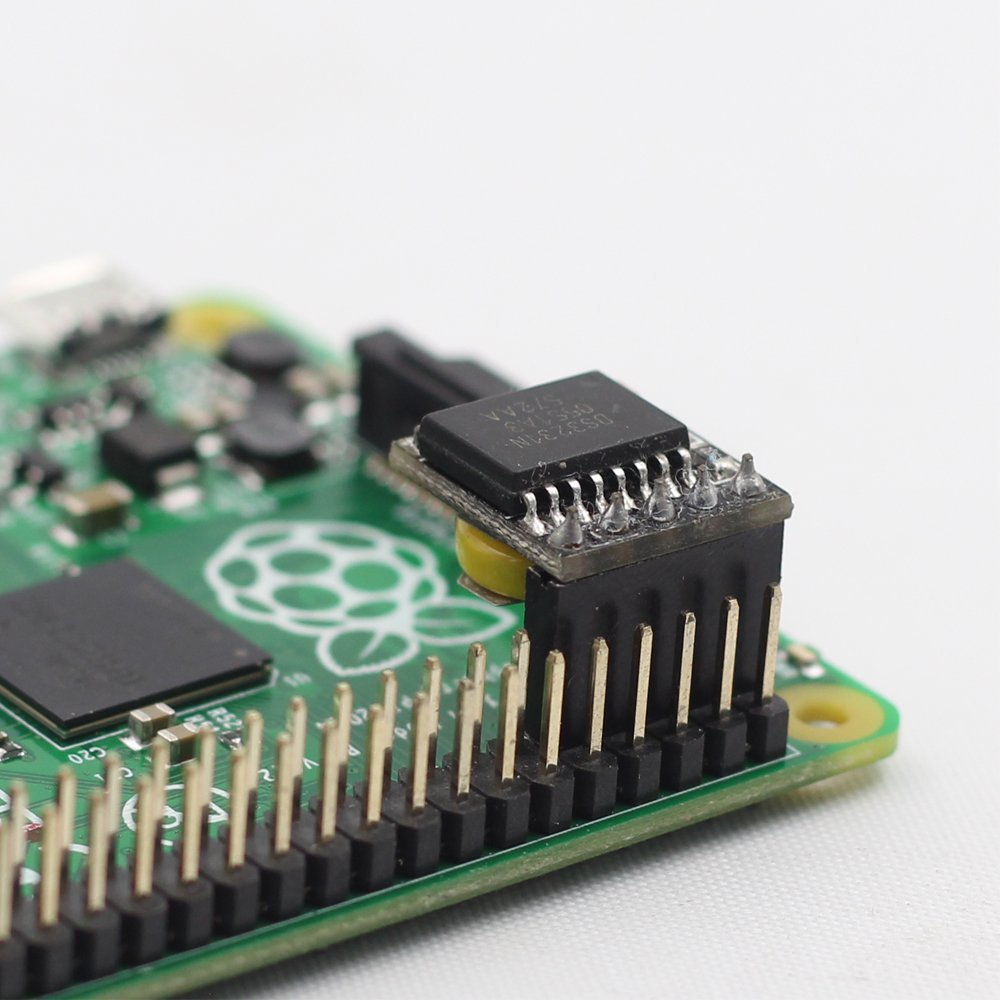
Buttons on the raspberry / pressurespot
Red button :
- Less than 3 seconds is reboot
- Longer than 3 seconds is shut down
- Charger can be removed, when the green light is off
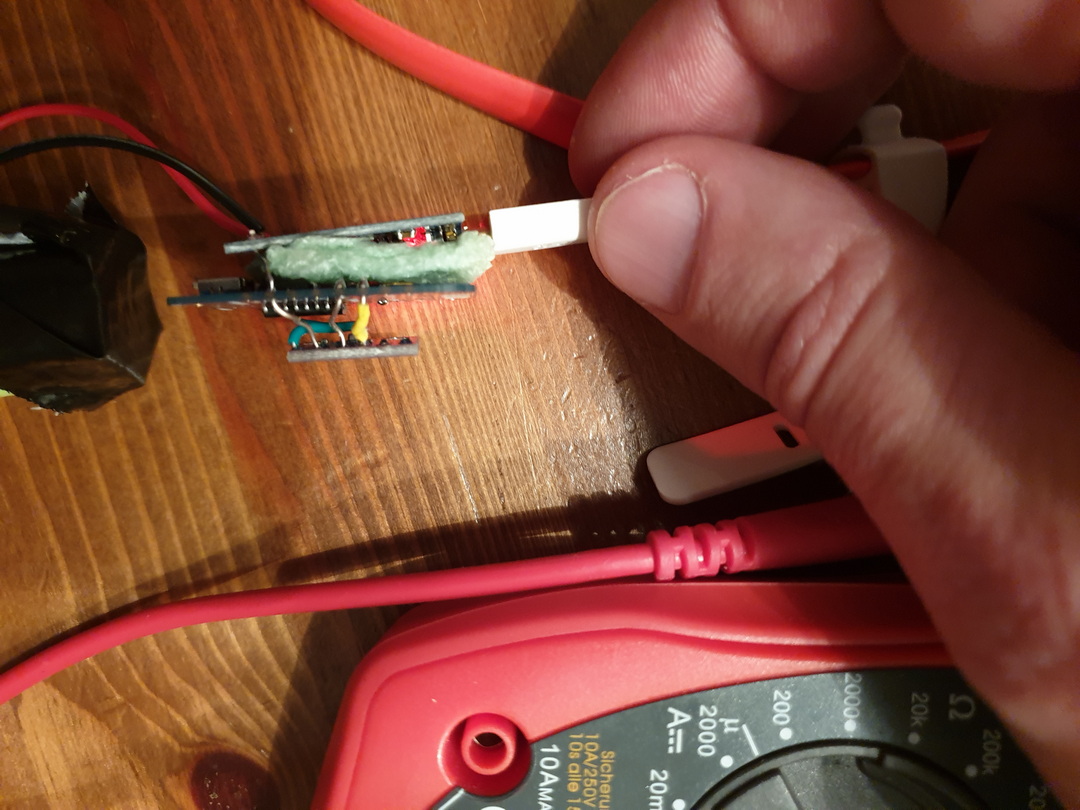
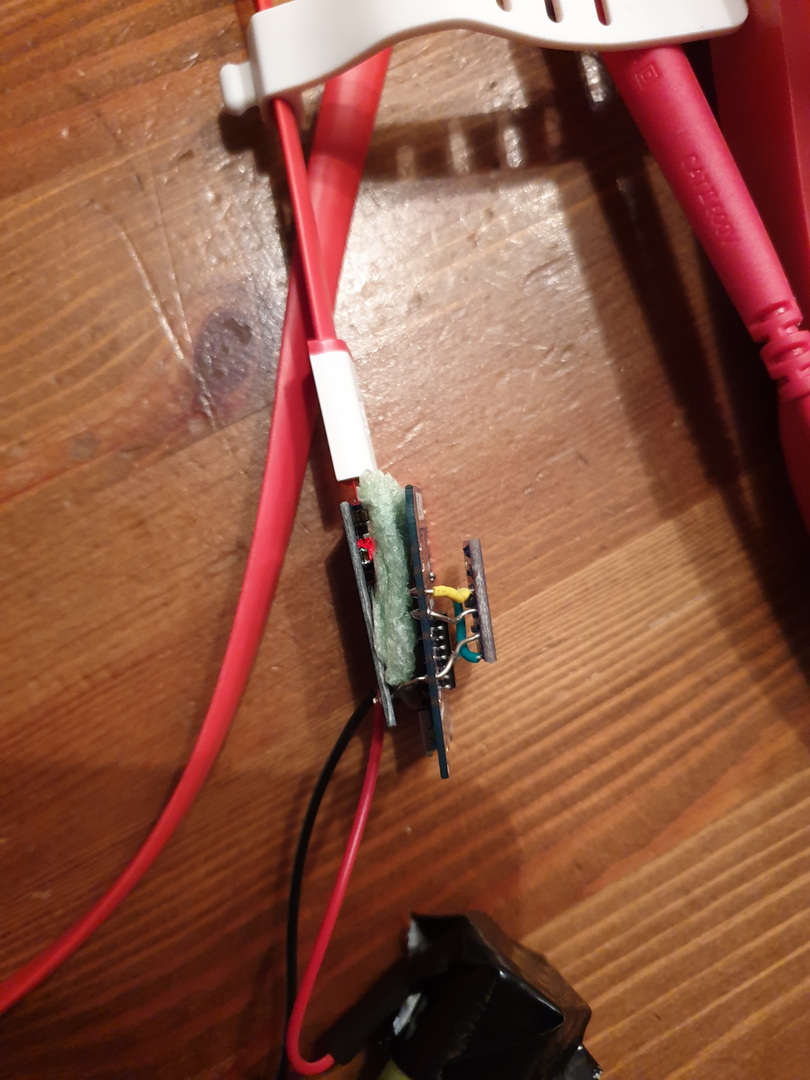
Led lights on the sensors
- Red light (R2; constant): battery is charging
- Blue light (R1; constant): battery is full
- Blue light (R1; constant) & red light (R2; blinking): trying to charge, but no battery connected
Add shutdown script to /etc/rc.local
python /usr/local/bin/power-switch.py &
/usr/local/bin/power-switch.py
#!/usr/bin/python
import threading, subprocess
import RPi.GPIO as GPIO
def shutdown():
    subprocess.call('sudo shutdown -h now', shell=True)
def edge_detected(pin):
    if GPIO.input(pin):
        t.cancel()
        subprocess.call('sudo reboot', shell=True)
    else:
        t.start()
if __name__ == '__main__':
    try:
        GPIO.setmode(GPIO.BOARD)
        GPIO.setup(5, GPIO.IN)
        GPIO.add_event_detect(5, GPIO.BOTH, callback=edge_detected, bouncetime=10)
        t = threading.Timer(3.0, shutdown)
        while True:
            pass
    finally:
        GPIO.cleanup()
/usr/local/bin/ledoff.py
#!/usr/bin/python
import RPi.GPIO as GPIO
import time
GPIO.setmode(GPIO.BCM)
GPIO.setwarnings(False)
GPIO.setup(18,GPIO.OUT)
GPIO.output(18,GPIO.LOW)
/usr/local/bin/ledon.py
#!/usr/bin/python
import RPi.GPIO as GPIO
import time
GPIO.setmode(GPIO.BCM)
GPIO.setwarnings(False)
GPIO.setup(18,GPIO.OUT)
GPIO.output(18,GPIO.HIGH)
nmcli device wifi hotspot ssid pressurespot password pressurespot
/etc/NetworkManager/system-connections/Hotspot-1
[connection]
id=Hotspot-1
uuid=c2c05528-63f9-44c7-93ce-264187a45086
type=wifi
permissions=
timestamp=1553708934

[wifi]
hidden=true
mac-address=B8:27:EB:7F:D5:E7
mac-address-blacklist=
mode=ap
seen-bssids=B8:27:EB:7F:D5:E7;
ssid=pressurespot

[wifi-security]
group=ccmp;
key-mgmt=wpa-psk
pairwise=ccmp;
proto=rsn;
psk=pressurespot

[ipv4]
dns-search=
method=shared

[ipv6]
addr-gen-mode=stable-privacy
dns-search=
method=ignore
/usr/bin/servicecheck.sh (in rc.local and crontab root user – every minute
#!/bin/bash
nmcli connection show  | grep "Hotspot-1           c2c05528-63f9-44c7-93ce-264187a45086  802-11-wireless  wlan0" >/dev/null && touch /tmp/wlan || rm -f /tmp/wlan
for f in influx domoticz telegraf grafana mosquitto ; do
pgrep $f >/dev/null && touch /tmp/$f || rm -f /tmp/$f
done
count=$(ls  /tmp/influx /tmp/domoticz /tmp/telegraf /tmp/grafana /tmp/mosquitto /tmp/wlan | wc -l)
if [ $count -eq 6 ]  ; then
/usr/local/bin/ledon.py
exit 0
fi

for timer in {1..10} ; do
/usr/local/bin/ledon.py
sleep 1

/usr/local/bin/ledoff.py
sleep 1
done
Rest services to be installed on Raspberry
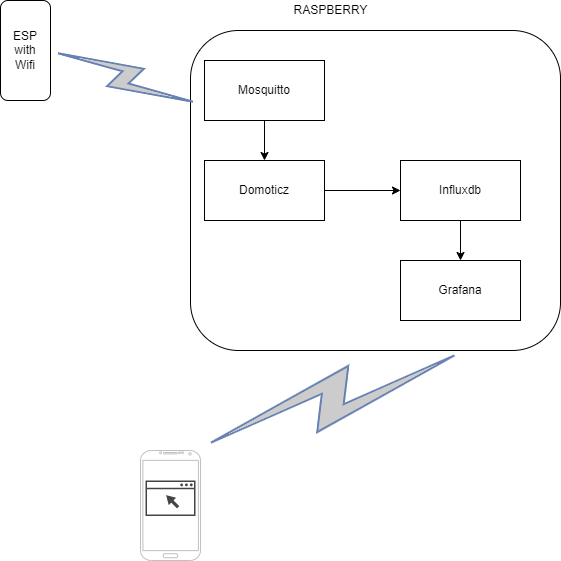
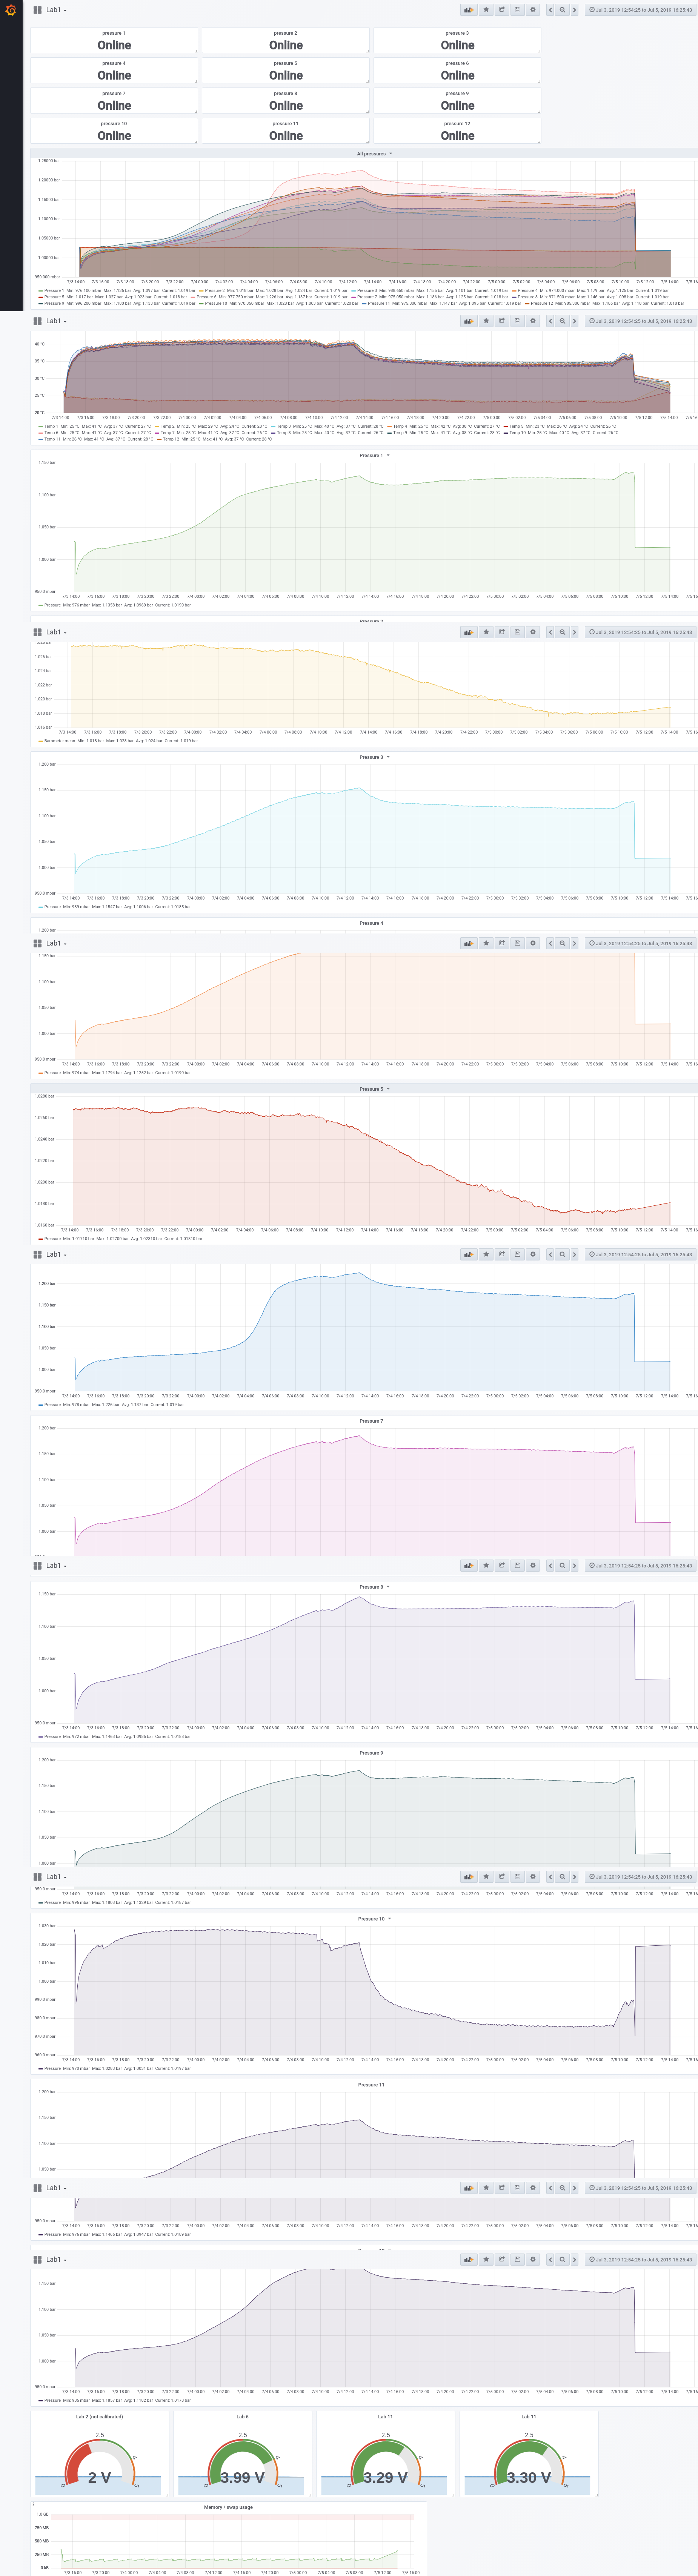
At the moment the raspberry uses domoticz between the Mqtt broker (Mosquitto) and the database (Influx)
Data wil be displayed using grafana.
tail -f /var/log/syslog shows which ip to which ESP
DHCPACK(wlan0) 10.42.0.104 cc:50:e3:c4:96:61 lab-
DHCPACK(wlan0) 10.42.0.181 cc:50:e3:c4:8d:73 lab-4
DHCPACK(wlan0) 10.42.0.186 cc:50:e3:c4:9b:ef lab-1
Configuring the raspberry
Install influx and grafana
First we add Influx repositories to apt:
wget -qO- https://repos.influxdata.com/influxdb.key | sudo apt-key add -
source /etc/os-release
echo "deb https://repos.influxdata.com/debian $(lsb_release -cs) stable" | sudo tee /etc/apt/sources.list.d/influxdb.list
Update apt with the new repo & install.
sudo apt update && sudo apt install -y influxdb
Then start the influxdb service and set it to run at boot:
sudo systemctl enable influxdb --now
Again we need to add the Grafana packages to apt:
wget -q -O - https://packages.grafana.com/gpg.key | sudo apt-key add -
echo "deb https://packages.grafana.com/oss/deb stable main" | sudo tee /etc/apt/sources.list.d/grafana.list
We can now update and install the binaries:
sudo apt update && sudo apt install -y grafana
Then simply enable the service and set to run at boot:
sudo systemctl enable grafana-server.service --now
Now we can check that grafana is up by loading it in a browser: http://10.42.0.1:3000. If so, you can log in with the username and password = admin and set a new admin password.
Install mosquitto
sudo apt install mosquitto mosquitto-clients
Install domoticz using below command
<code><strong>curl -sSL install.domoticz.com | sudo bash</strong></code>
Under hardware add MQTT server adress 127.0.0.1
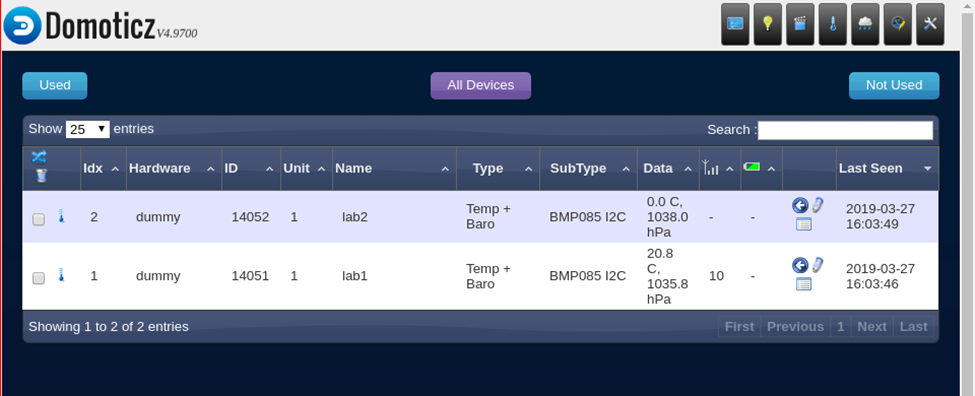
Add virtual sensors to domoticz.
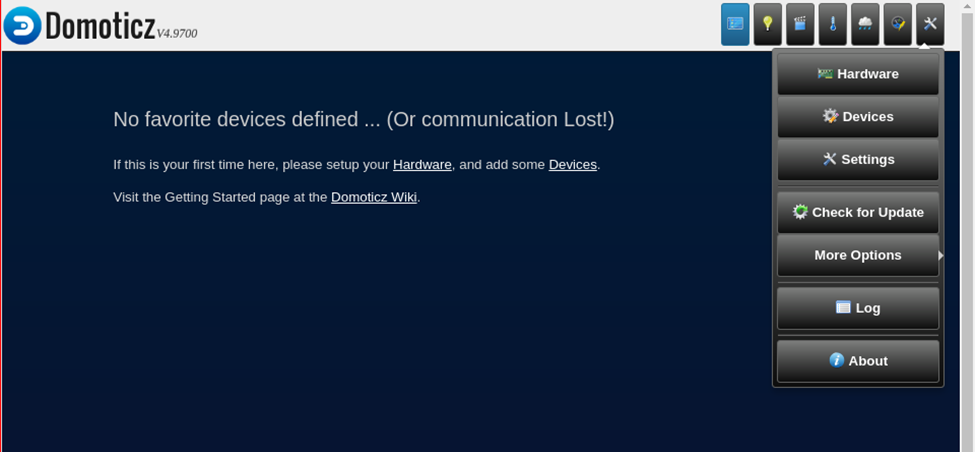
Click hardware and create virtual sensor, lab with sensornumber. Sensor type is Temp+Baro.
When looking at devices you will see the virtual devices.
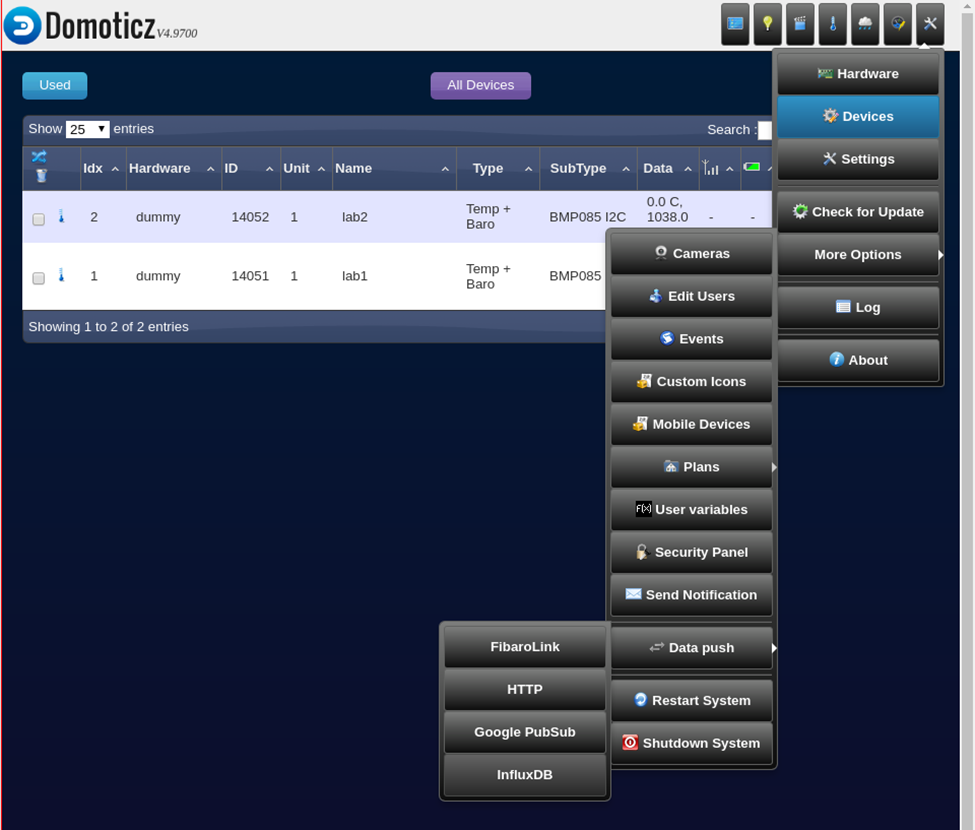
Pushing the data into Influxdb:
Goto settings > more options > data push > influxdb
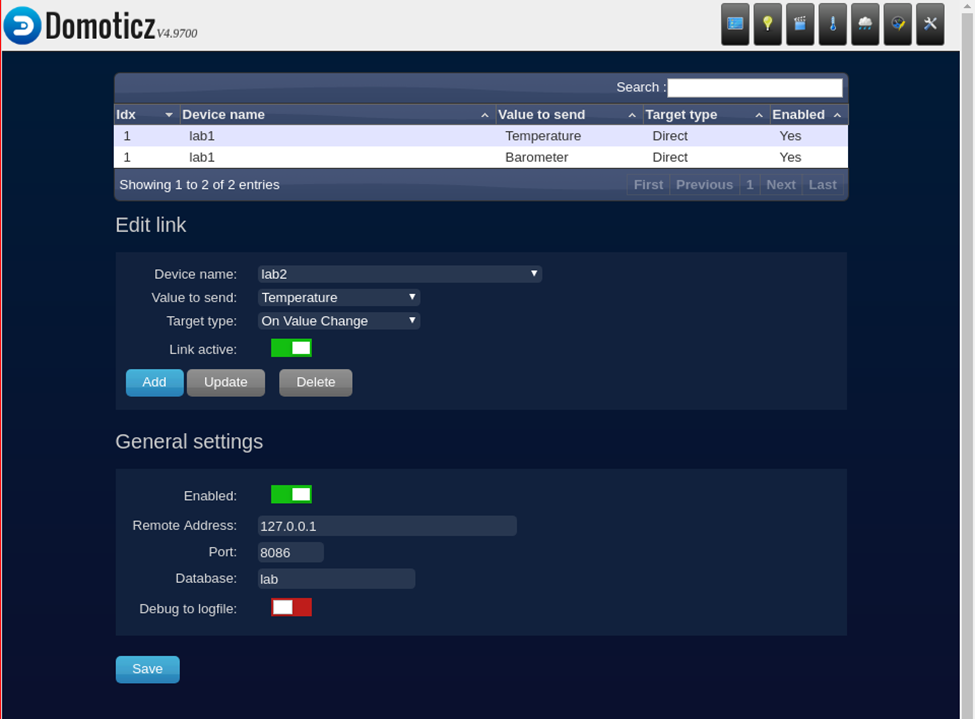
Add temperature
- Device name: lab* (lab plus unit number)
- Value to send: temperature
- Target type: direct (NOTE screenshot below is wrong)
- press add
Add barometer
- Device name: lab* (lab plus unit number)
- Value to send: Barometer
- Target type: direct (NOTE screenshot below is wrong)
- press add
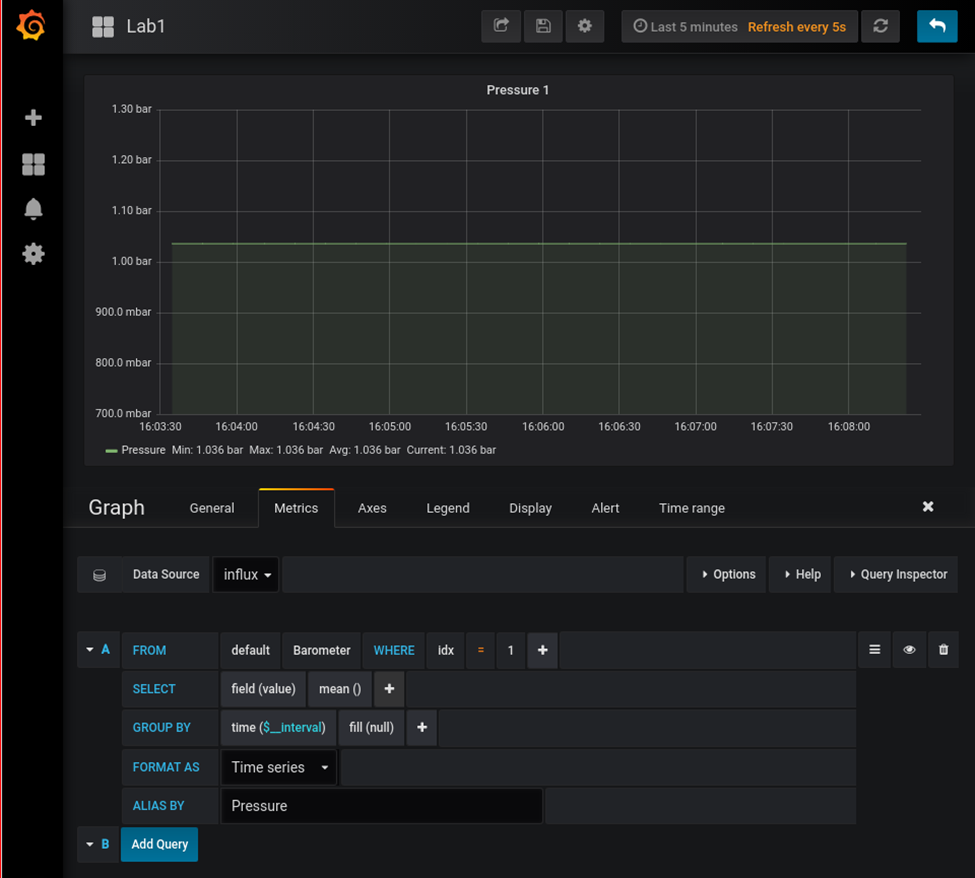
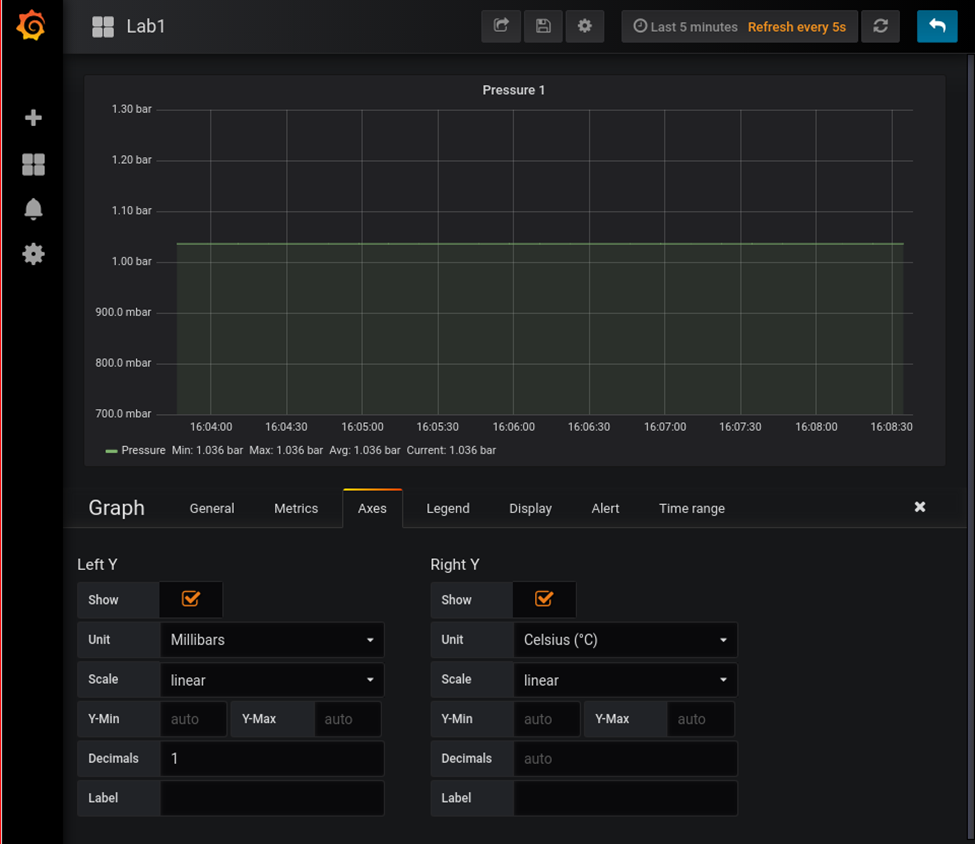
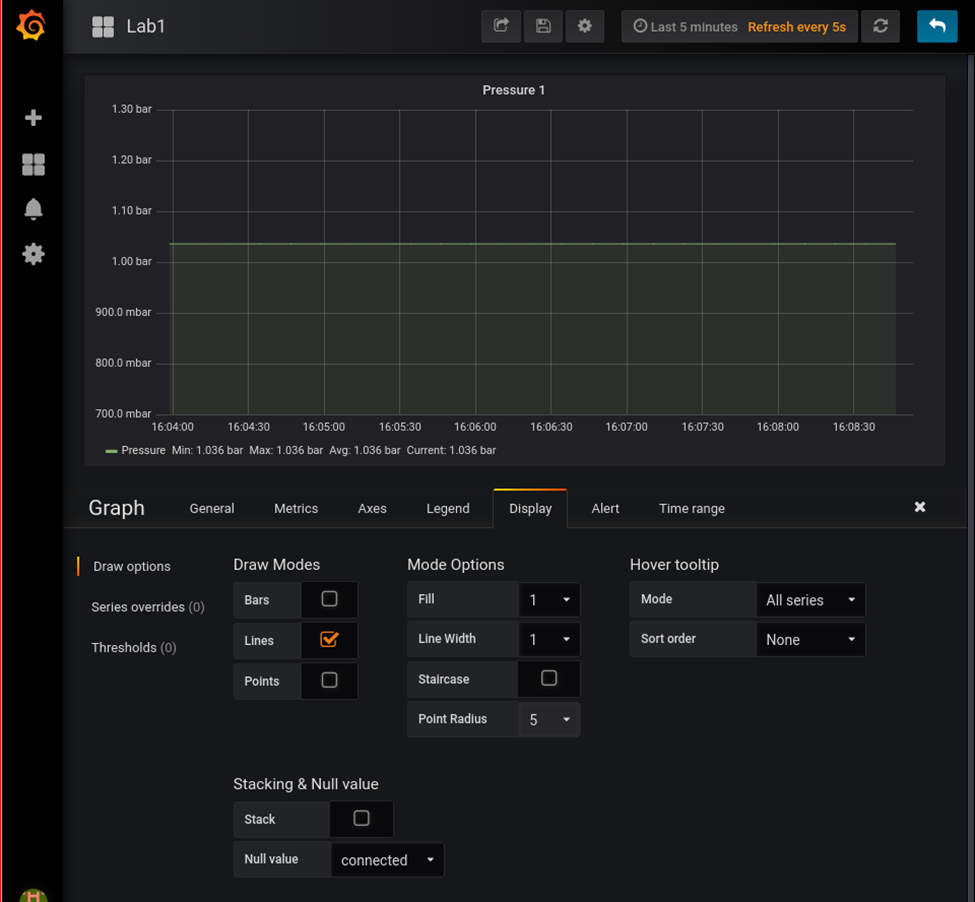
Configure Grafana
Go with your browser to http://10.42.0.1 when connected to the rpi access point
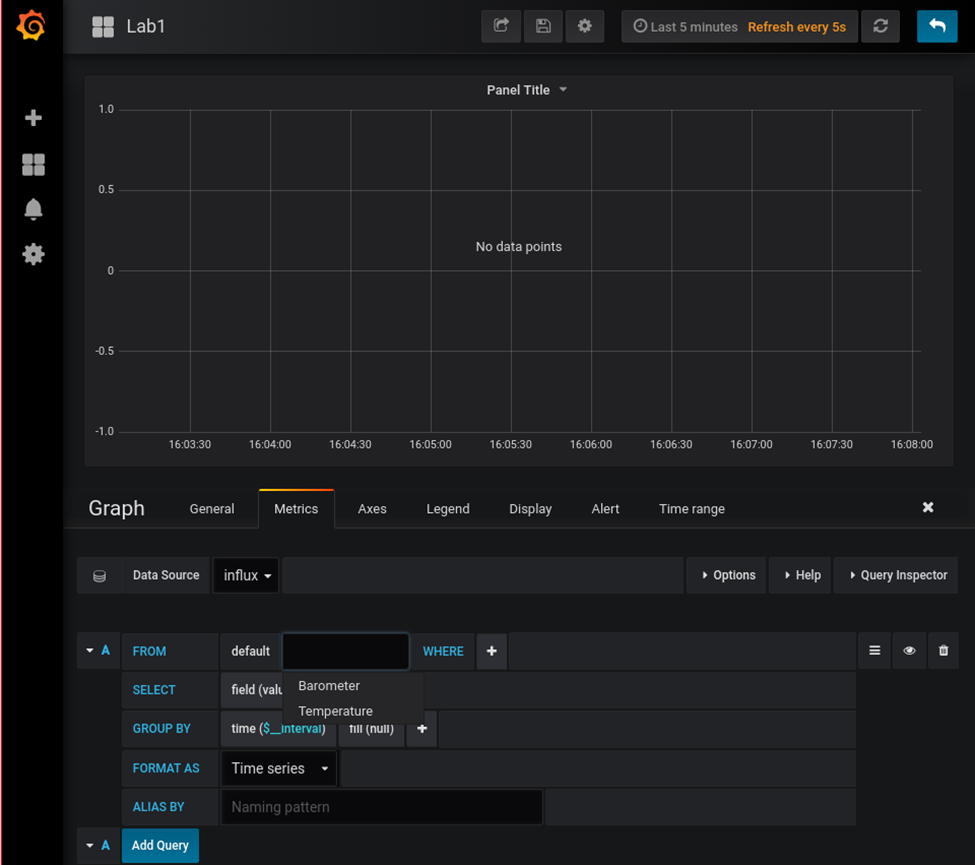
Goto settings and data sources, add influxdb with source http://localhost:8086
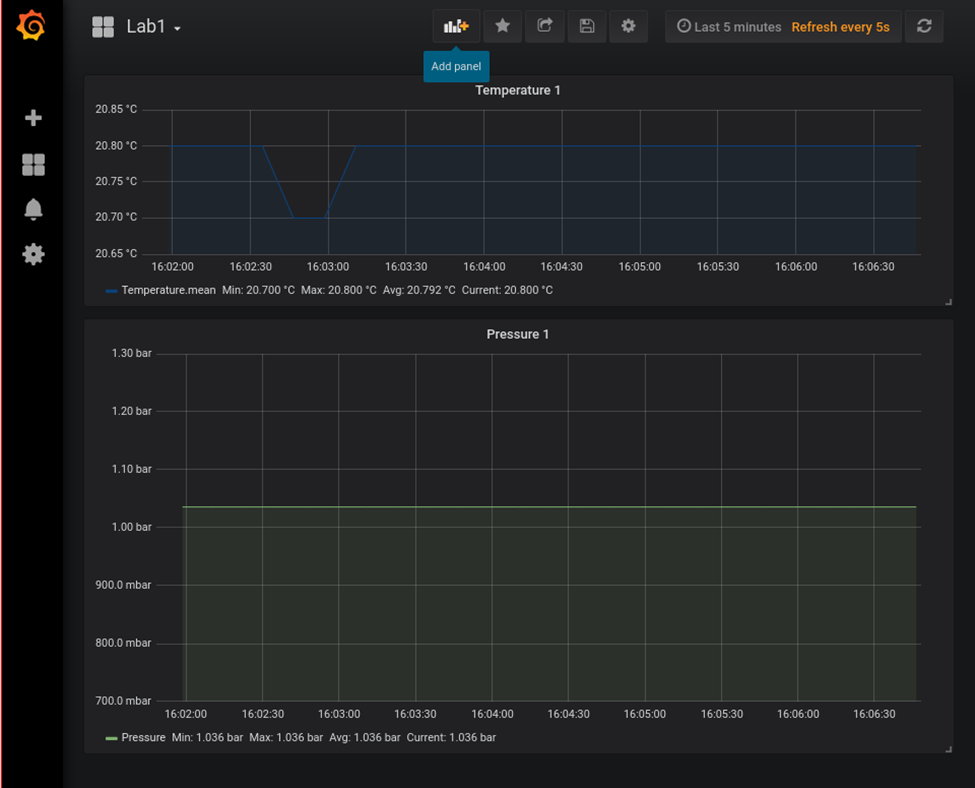
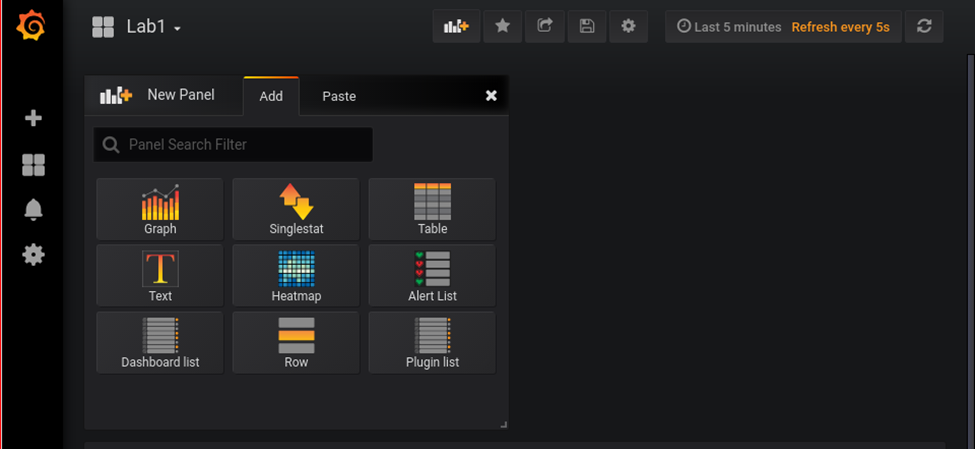
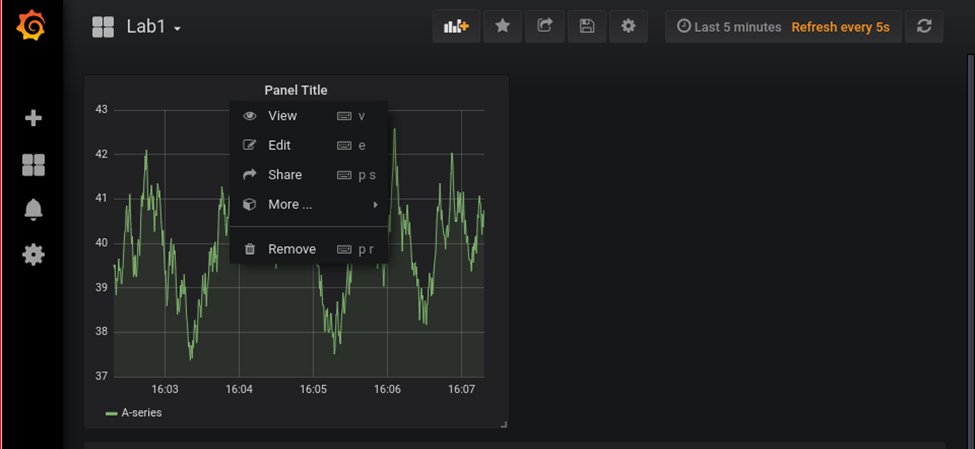
Goto dashboard and create a new one.
TODO
Telegraf/mosquito
Services in domoticz
Rpi status display
Sensor test / monitor