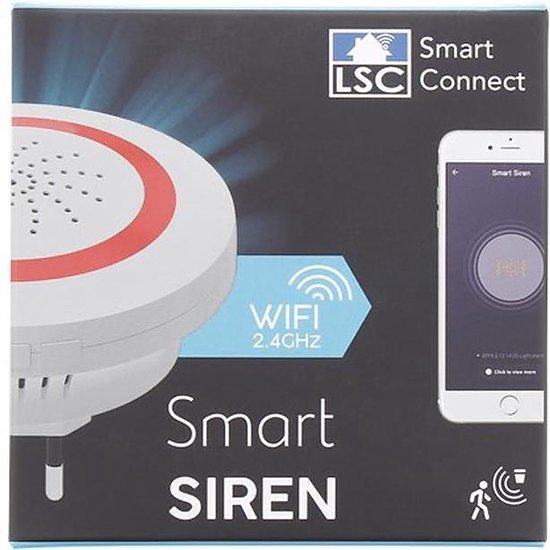
I’ve modded several LSC devices, most of them i could flash with esp-easy or tasmota. Why mod it? Because it uses the cloud .. i’d like to keep control myself. Just connect/solder a USB to TTL Converter UART Module like below. (See other posts)
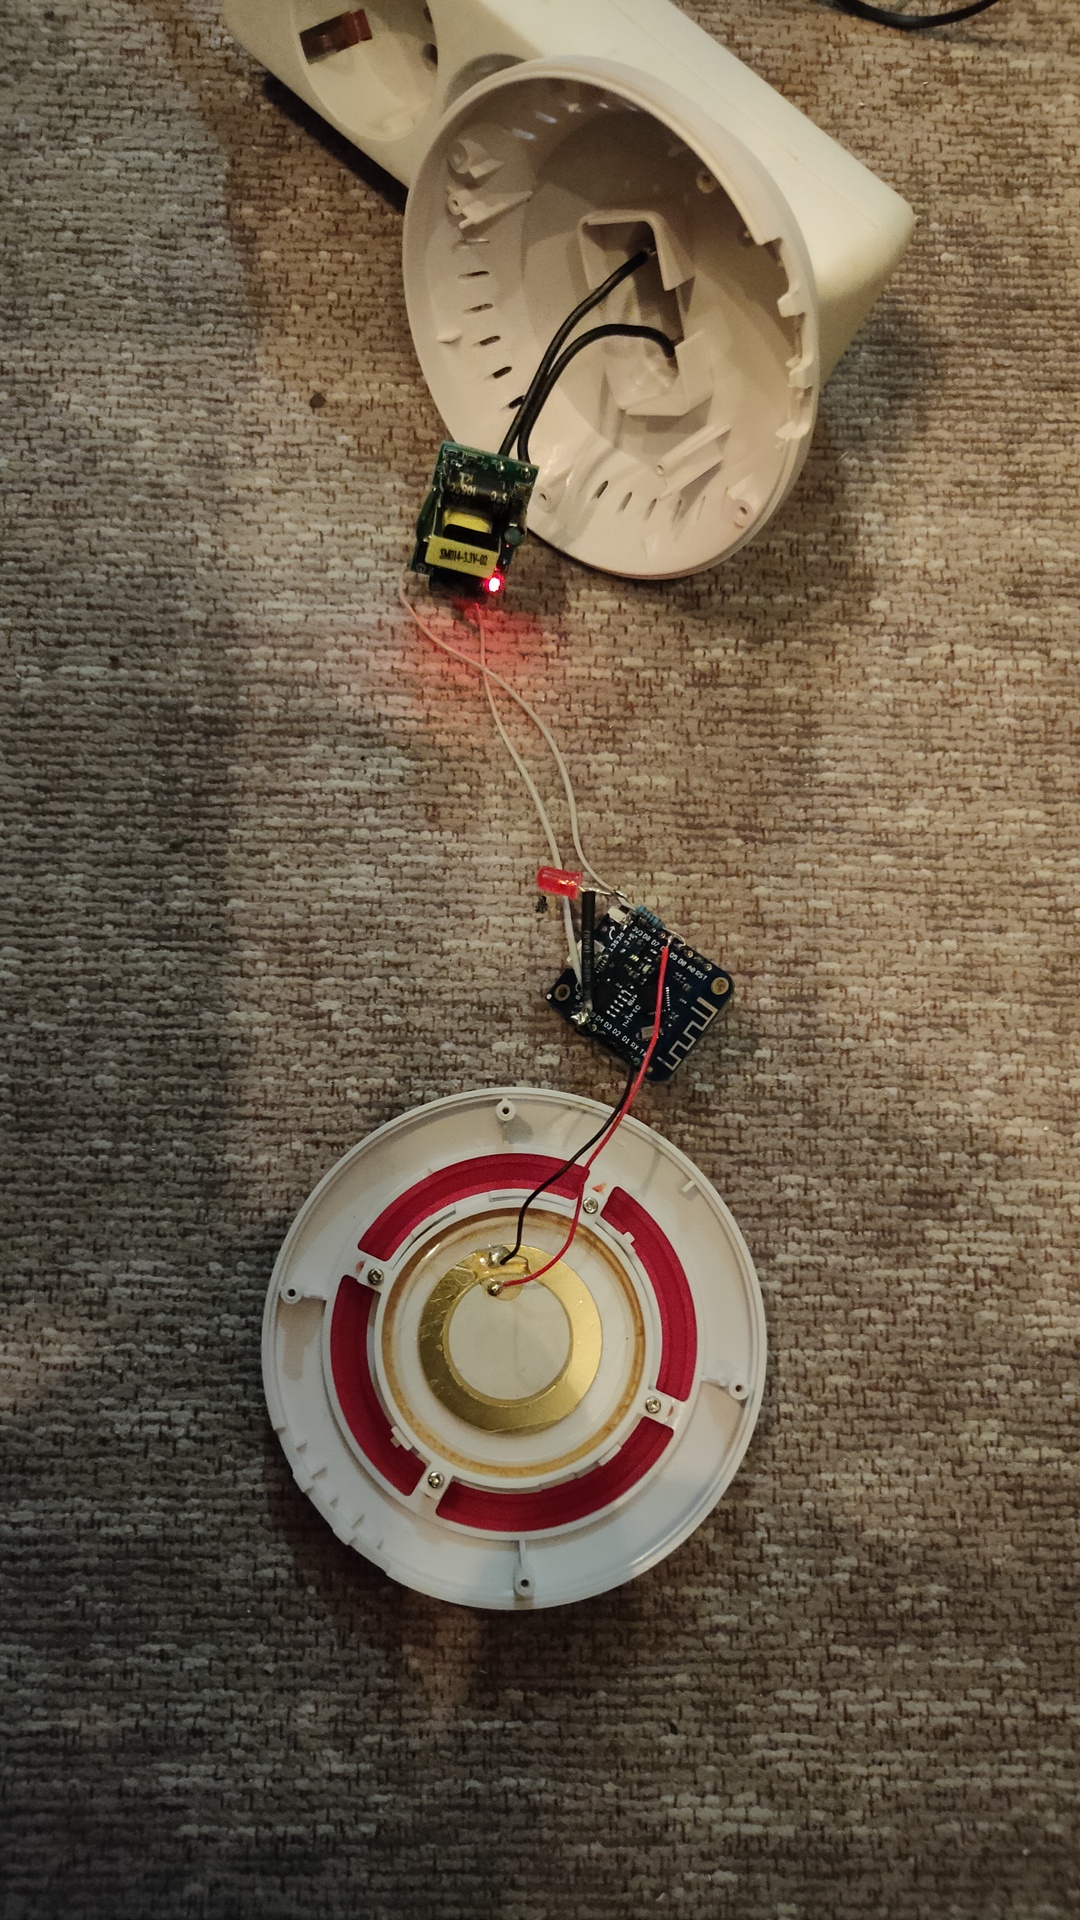
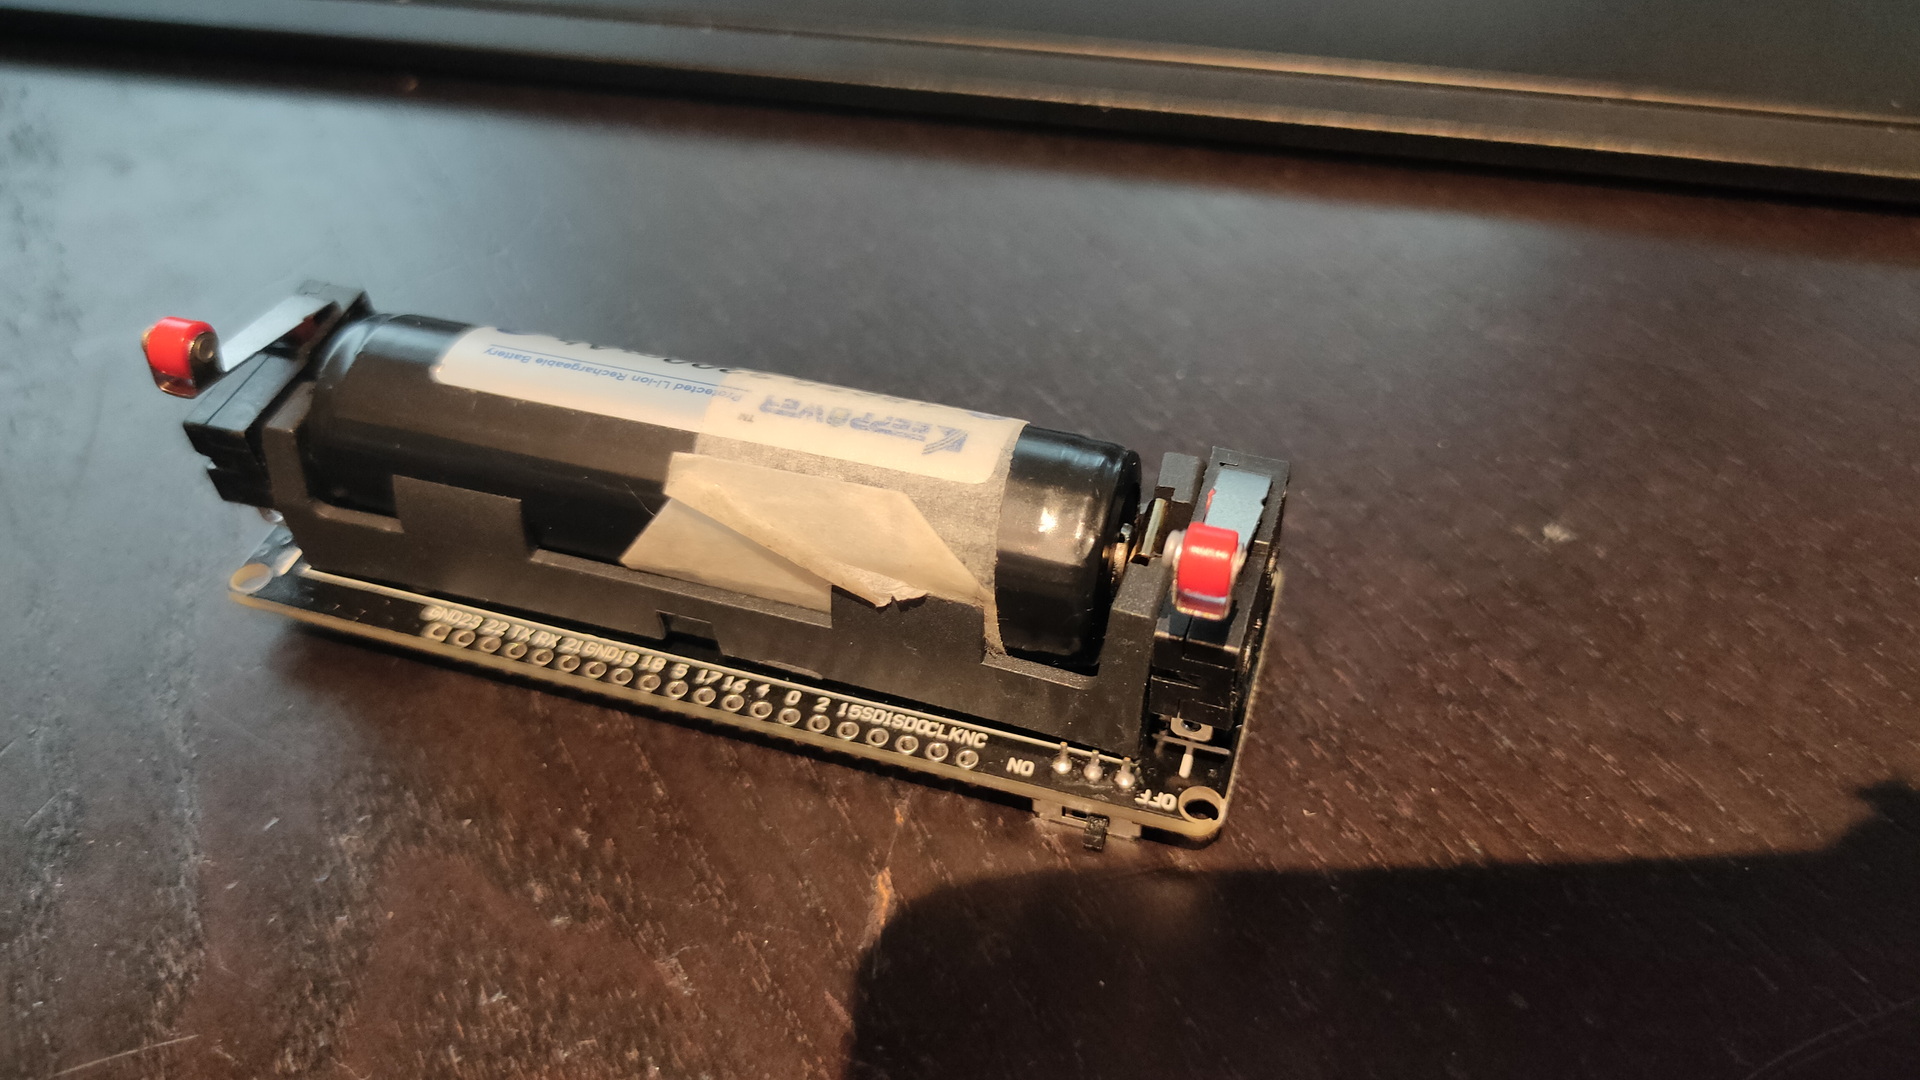
But this alarm was different, i ended up removing the chip and replace it with a ESP12.
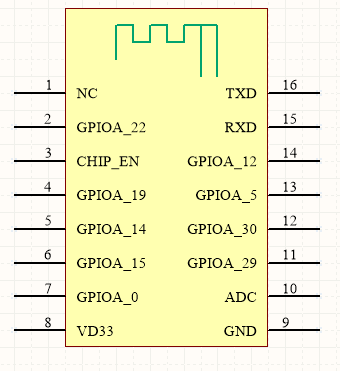
Warning .. loud! .. Yes almost xmasA WR3 is almost like a ESP-12
So now i had to figure out which GPIO pins and how to control them.
#1/bin/bash
# Flashed ESP Easy on this one
# When i did this, 2019, you needed version 2.1-beta1
# GPIO 4 controls LED
sleep 10
curl http://10.1.1.251/control?cmd=GPIO,4,1
sleep 1
curl http://10.1.1.251/control?cmd=GPIO,4,0
sleep 1
curl http://10.1.1.251/control?cmd=GPIO,4,1
sleep 2
curl http://10.1.1.251/control?cmd=GPIO,4,0
sleep 5
# Sending rtttl ringtone
curl "http://10.1.1.251/control?cmd=rtttl,5:d=4,o=5,b=112:8a,8a,a,8a,8a,a,8a,8c6,8f.,16g,2a,8a-,8a-,8a-.,16a-,8a-,8a,8a.,16a,8a,8g,8g,8a,g,c6"


alarm sound
 curl "http://10.1.1.251/control?cmd=rtttl,5:d=4,o=5,b=160:2g,2c6,2g,2c6,2g,2c6,2g,2c6"
pager
 curl "http://10.1.1.251/control?cmd=rtttl,5:d=4,o=5,b=160:8d6,16p,2d6,16p,8d6,16p,2d6,16p,8d6,16p,2d6"
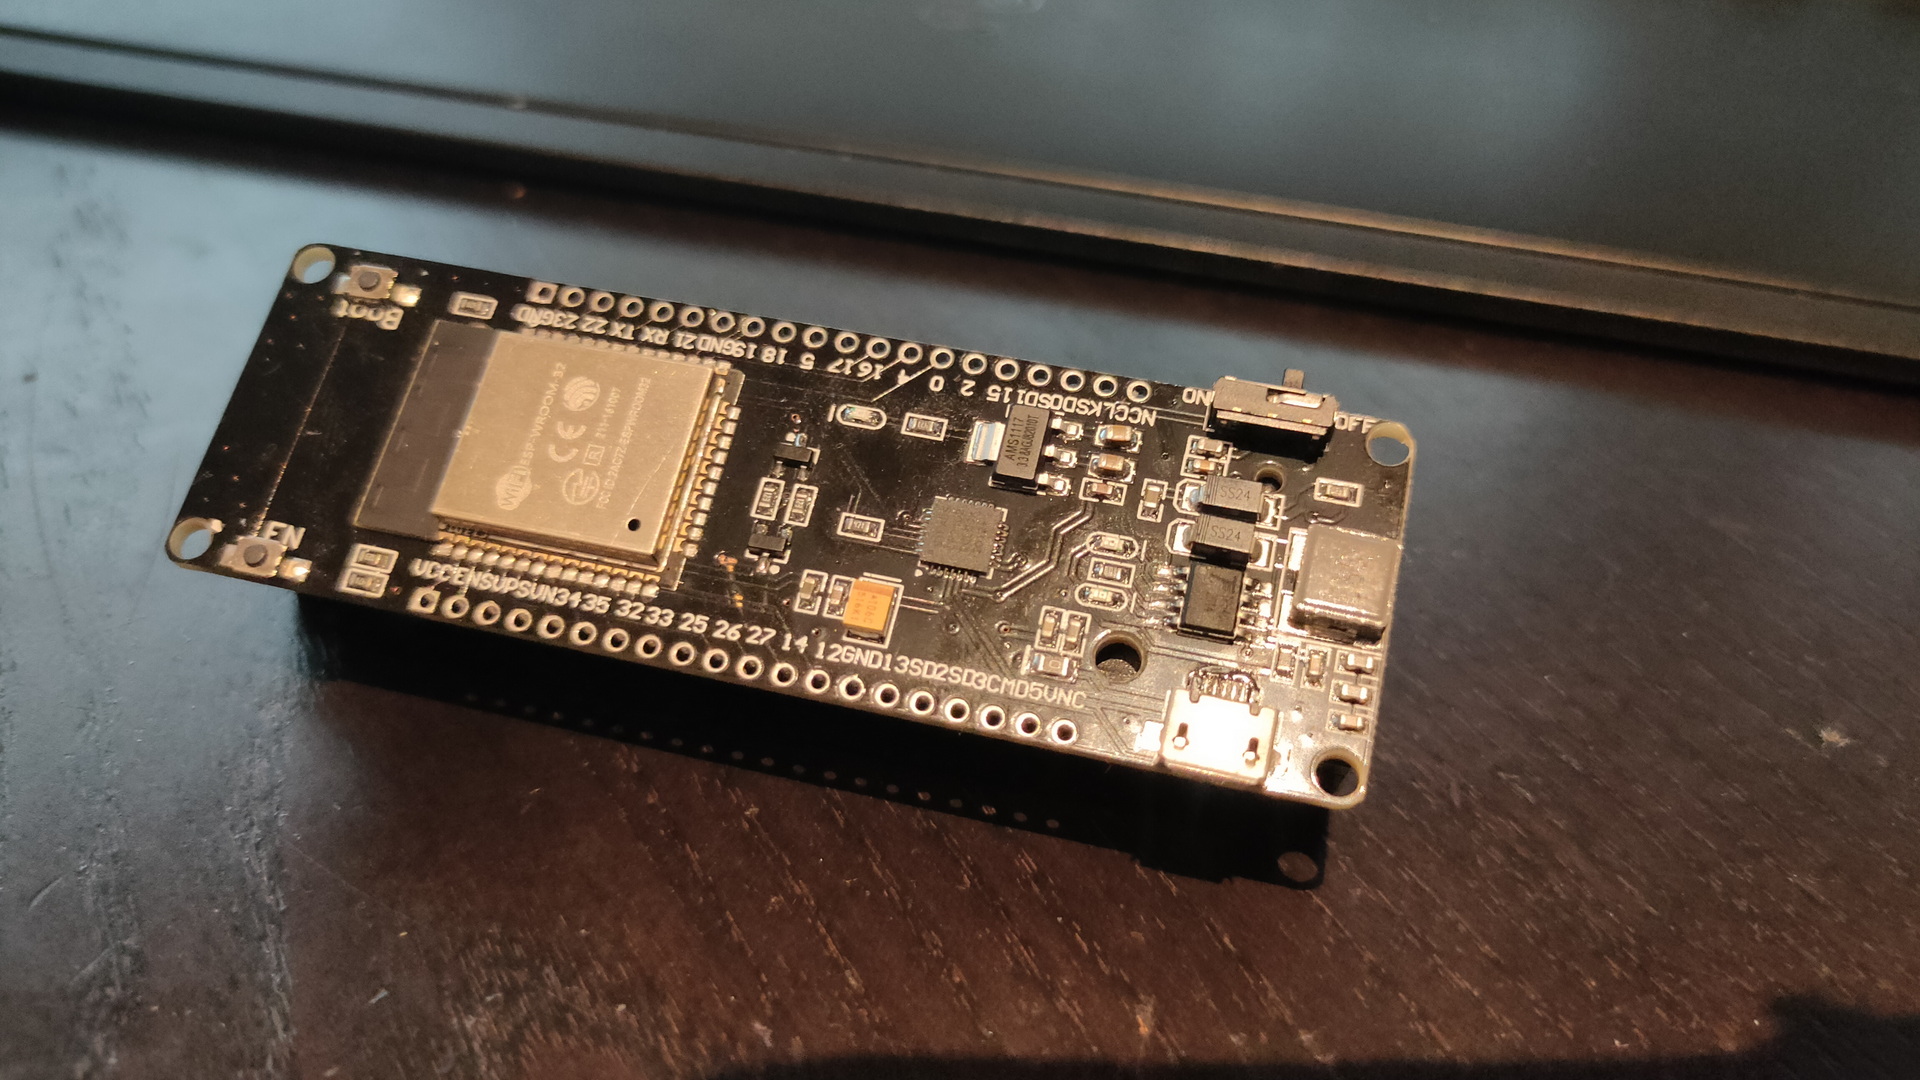
Update 20221208 – removed internals
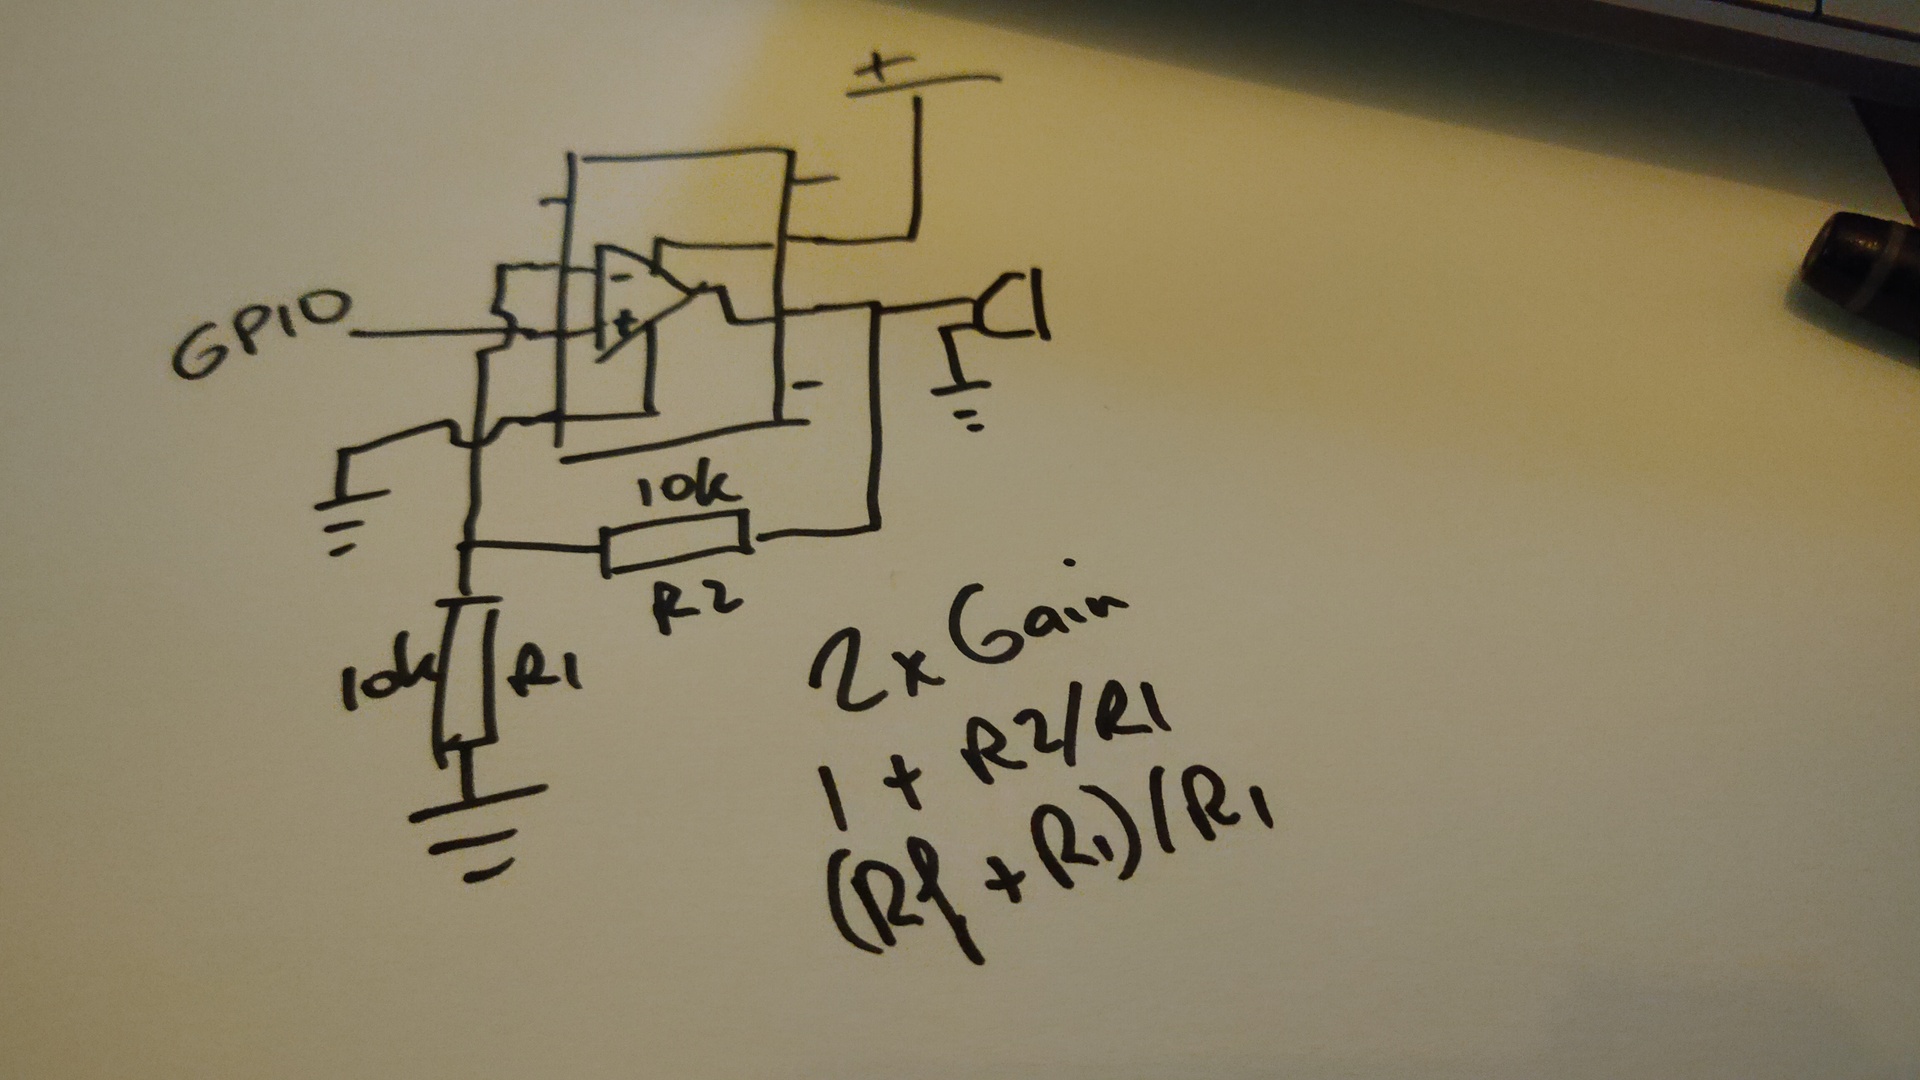
Removed my old hack and replaced it with a Wemos D1. Added a LED Next to do .. add a amplifier using a LM356/358
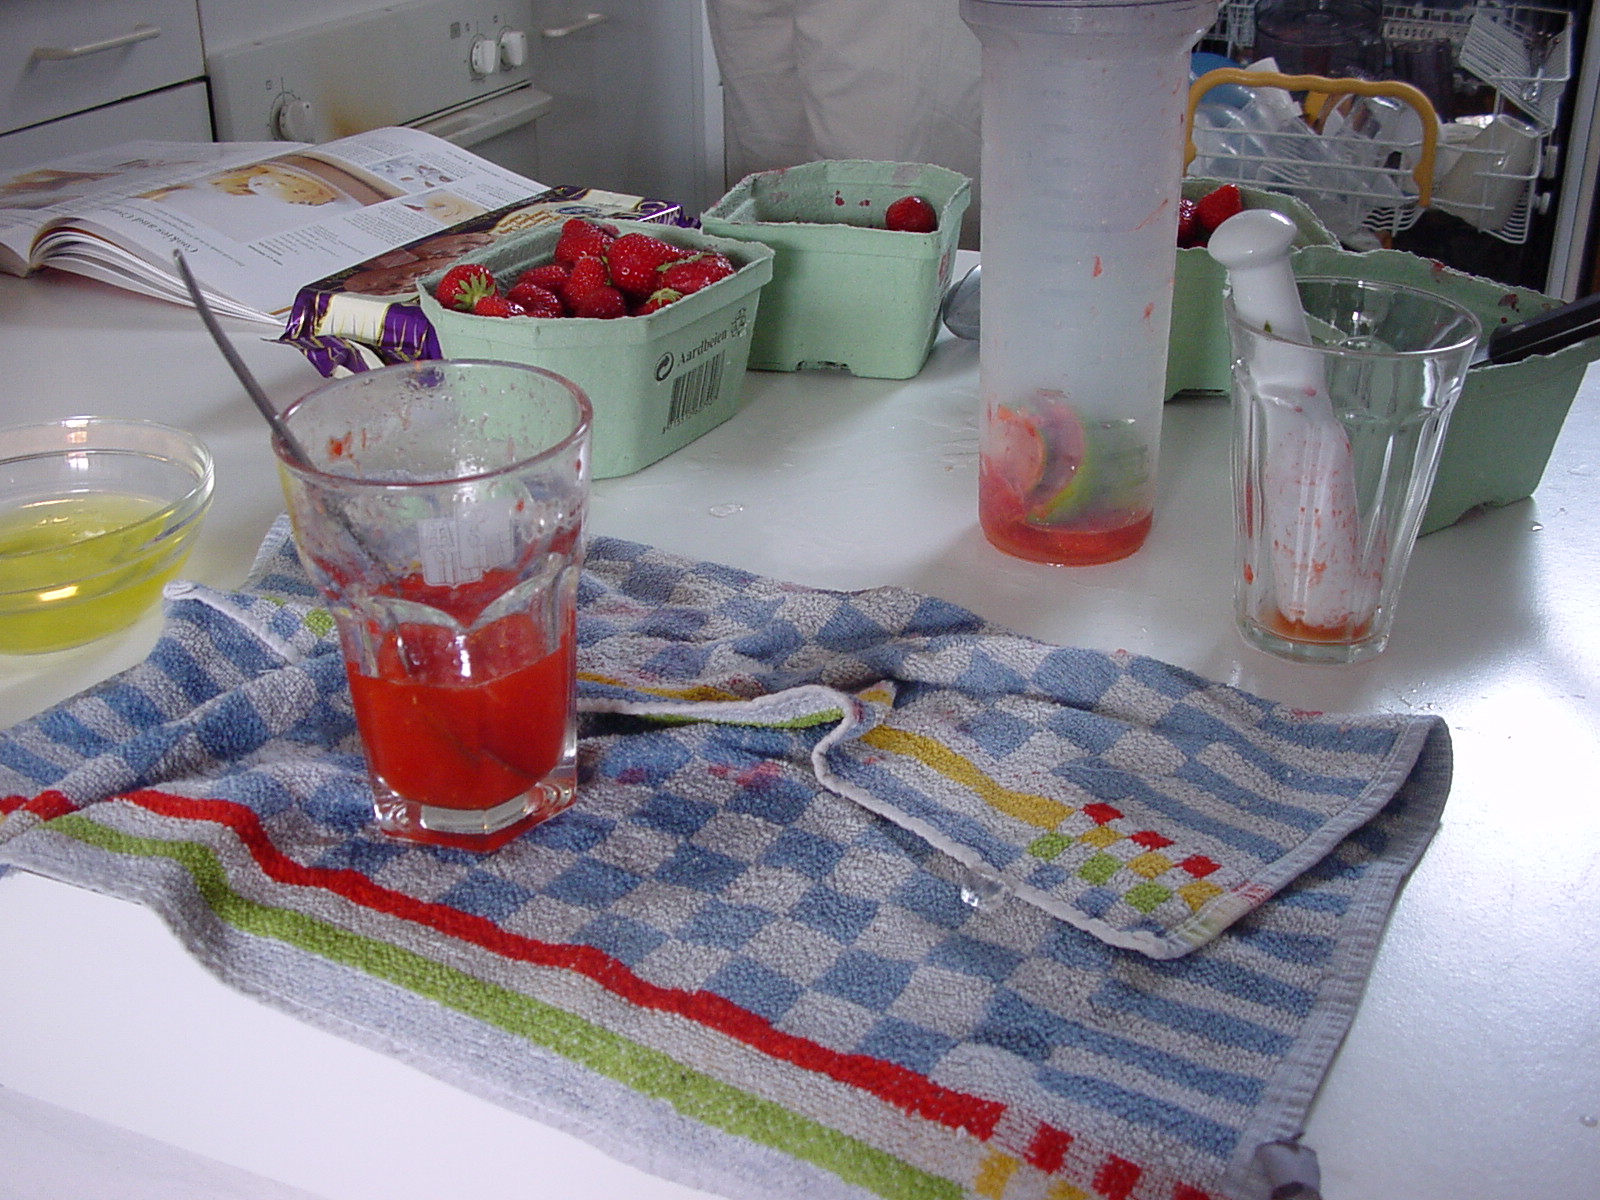
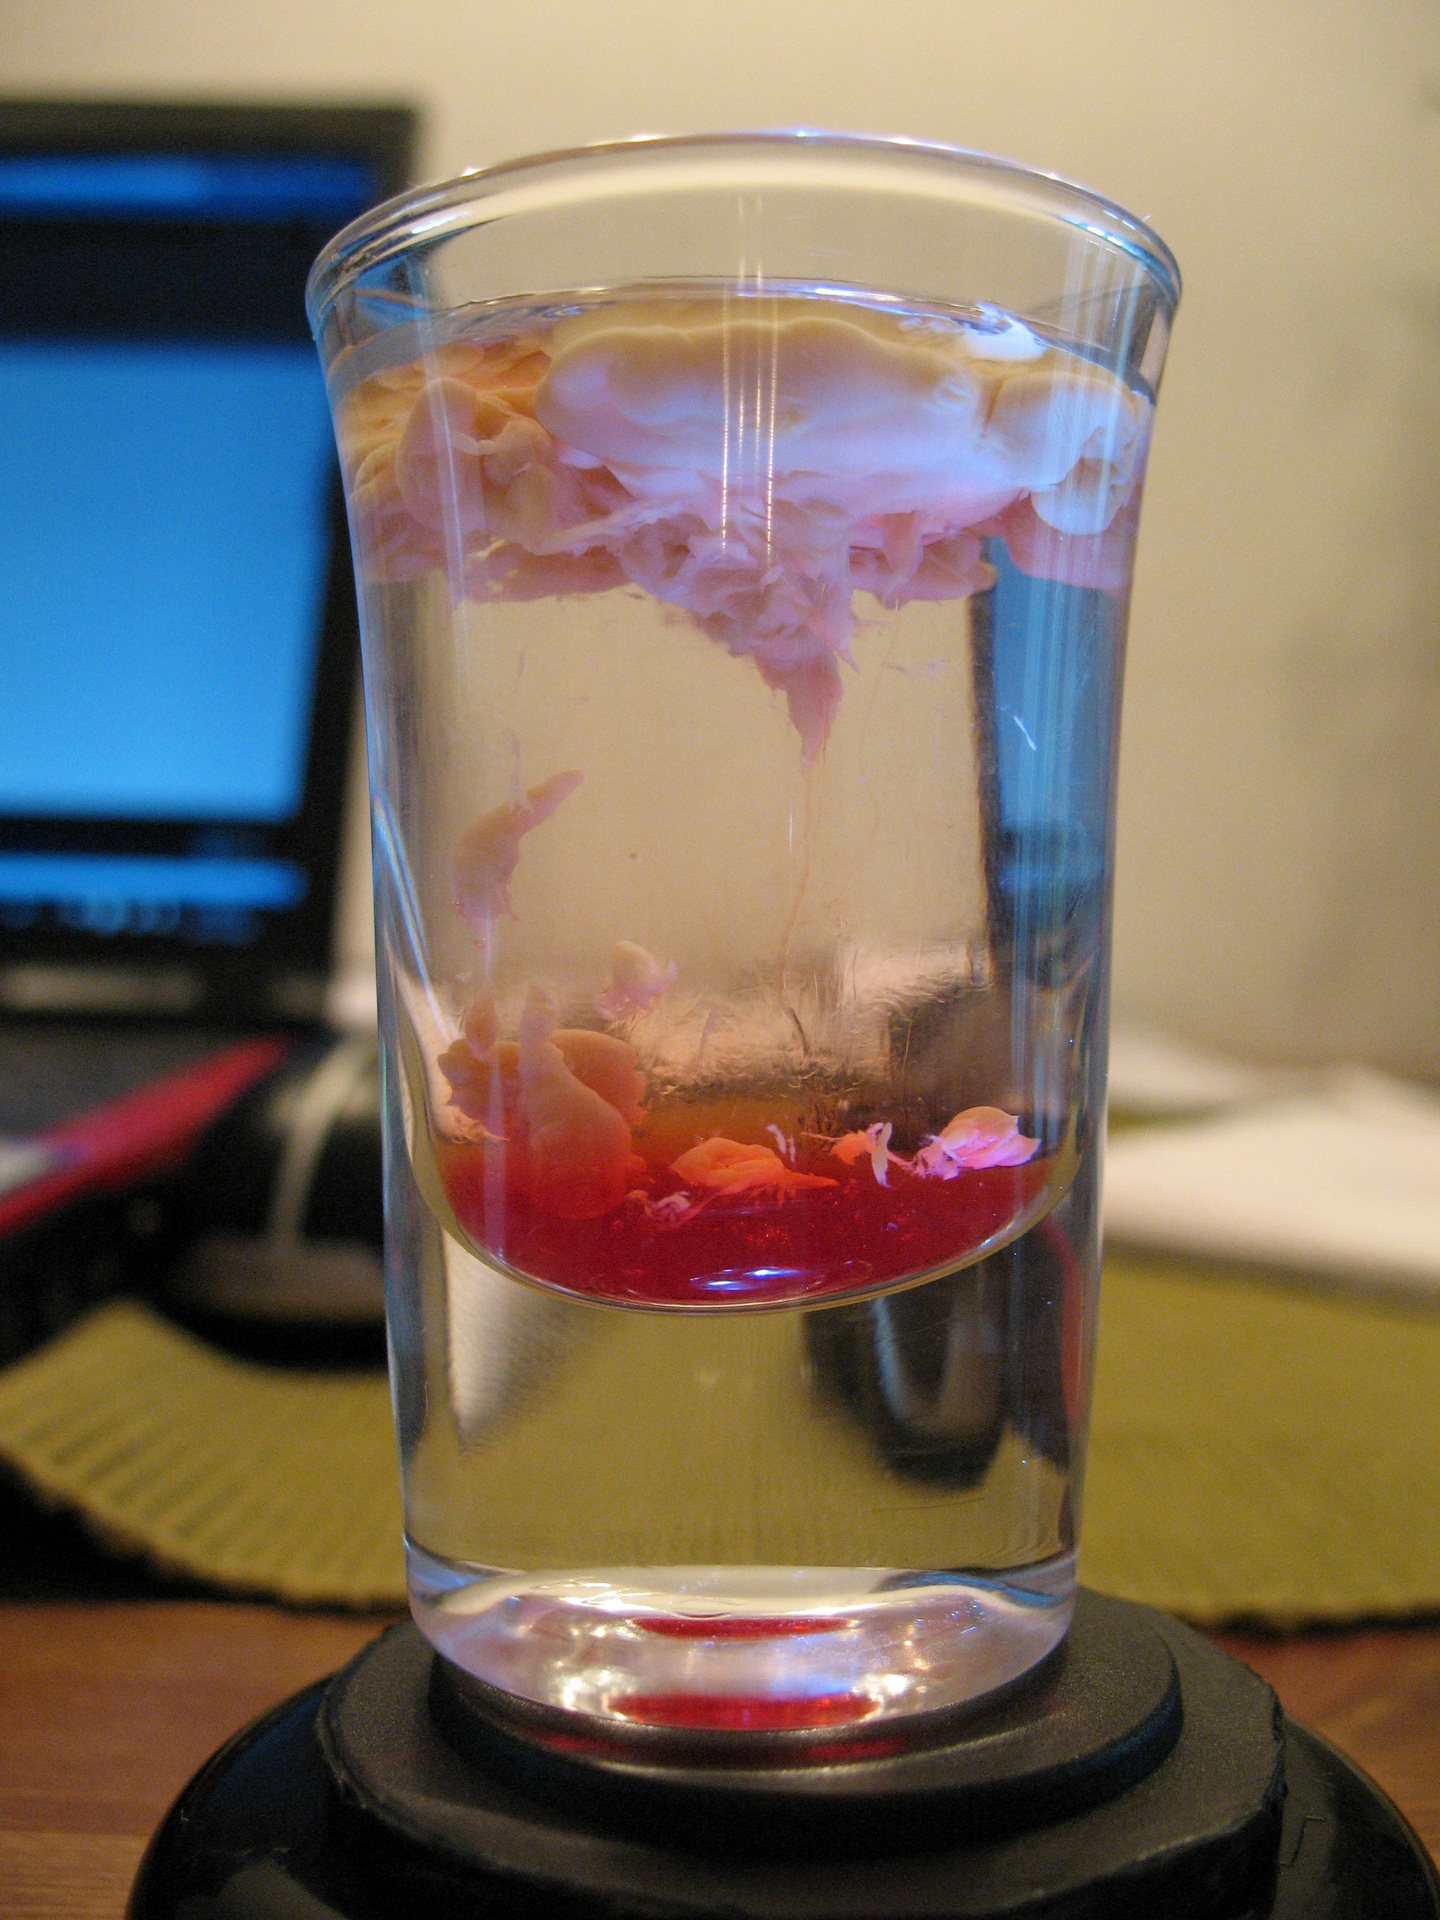
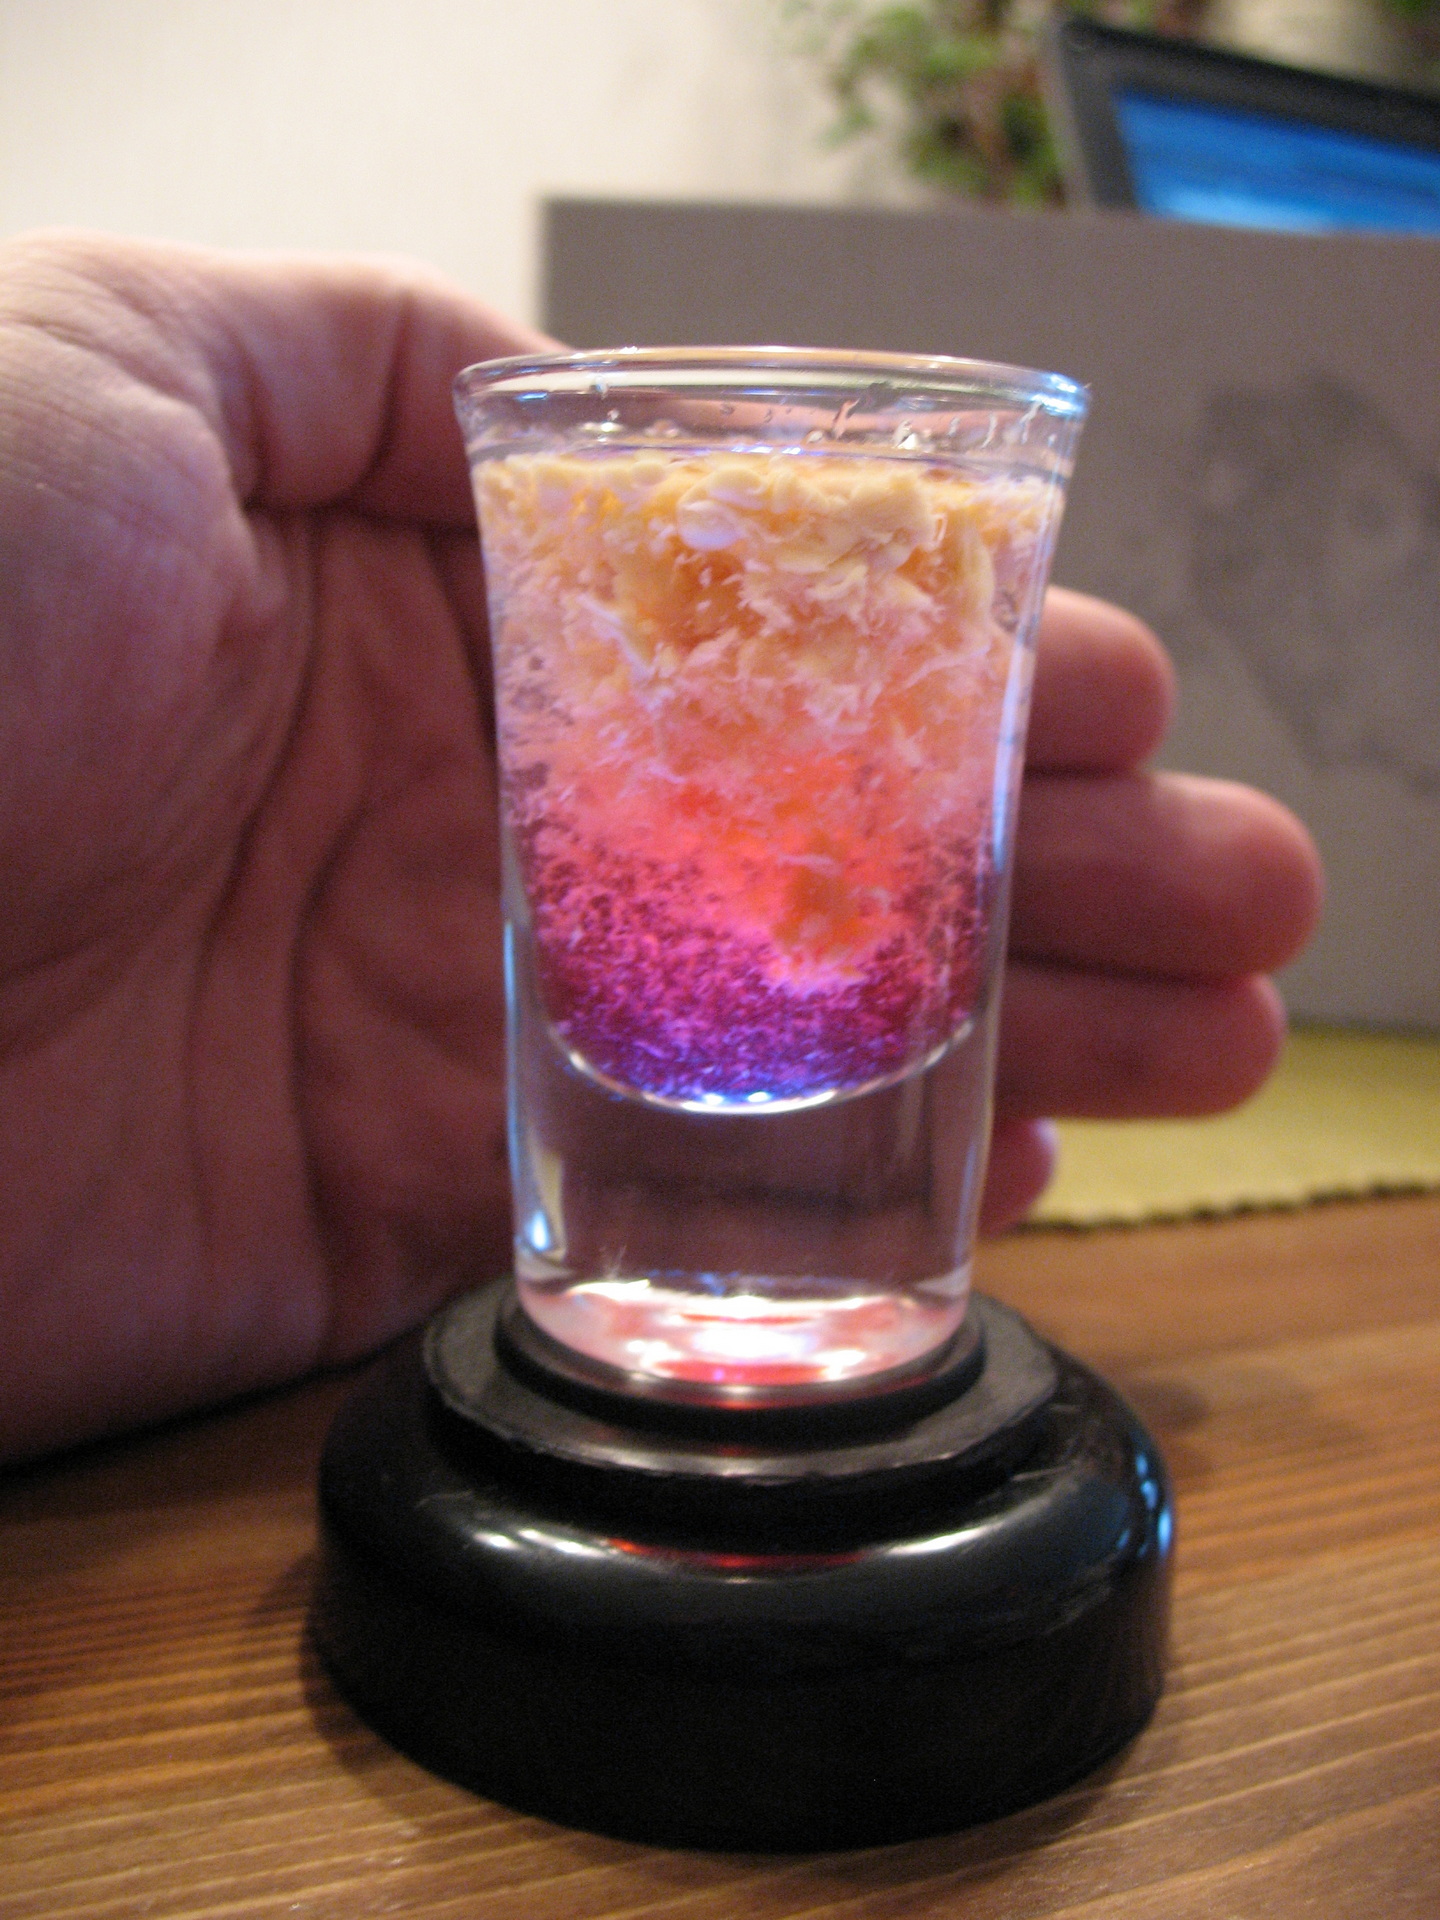
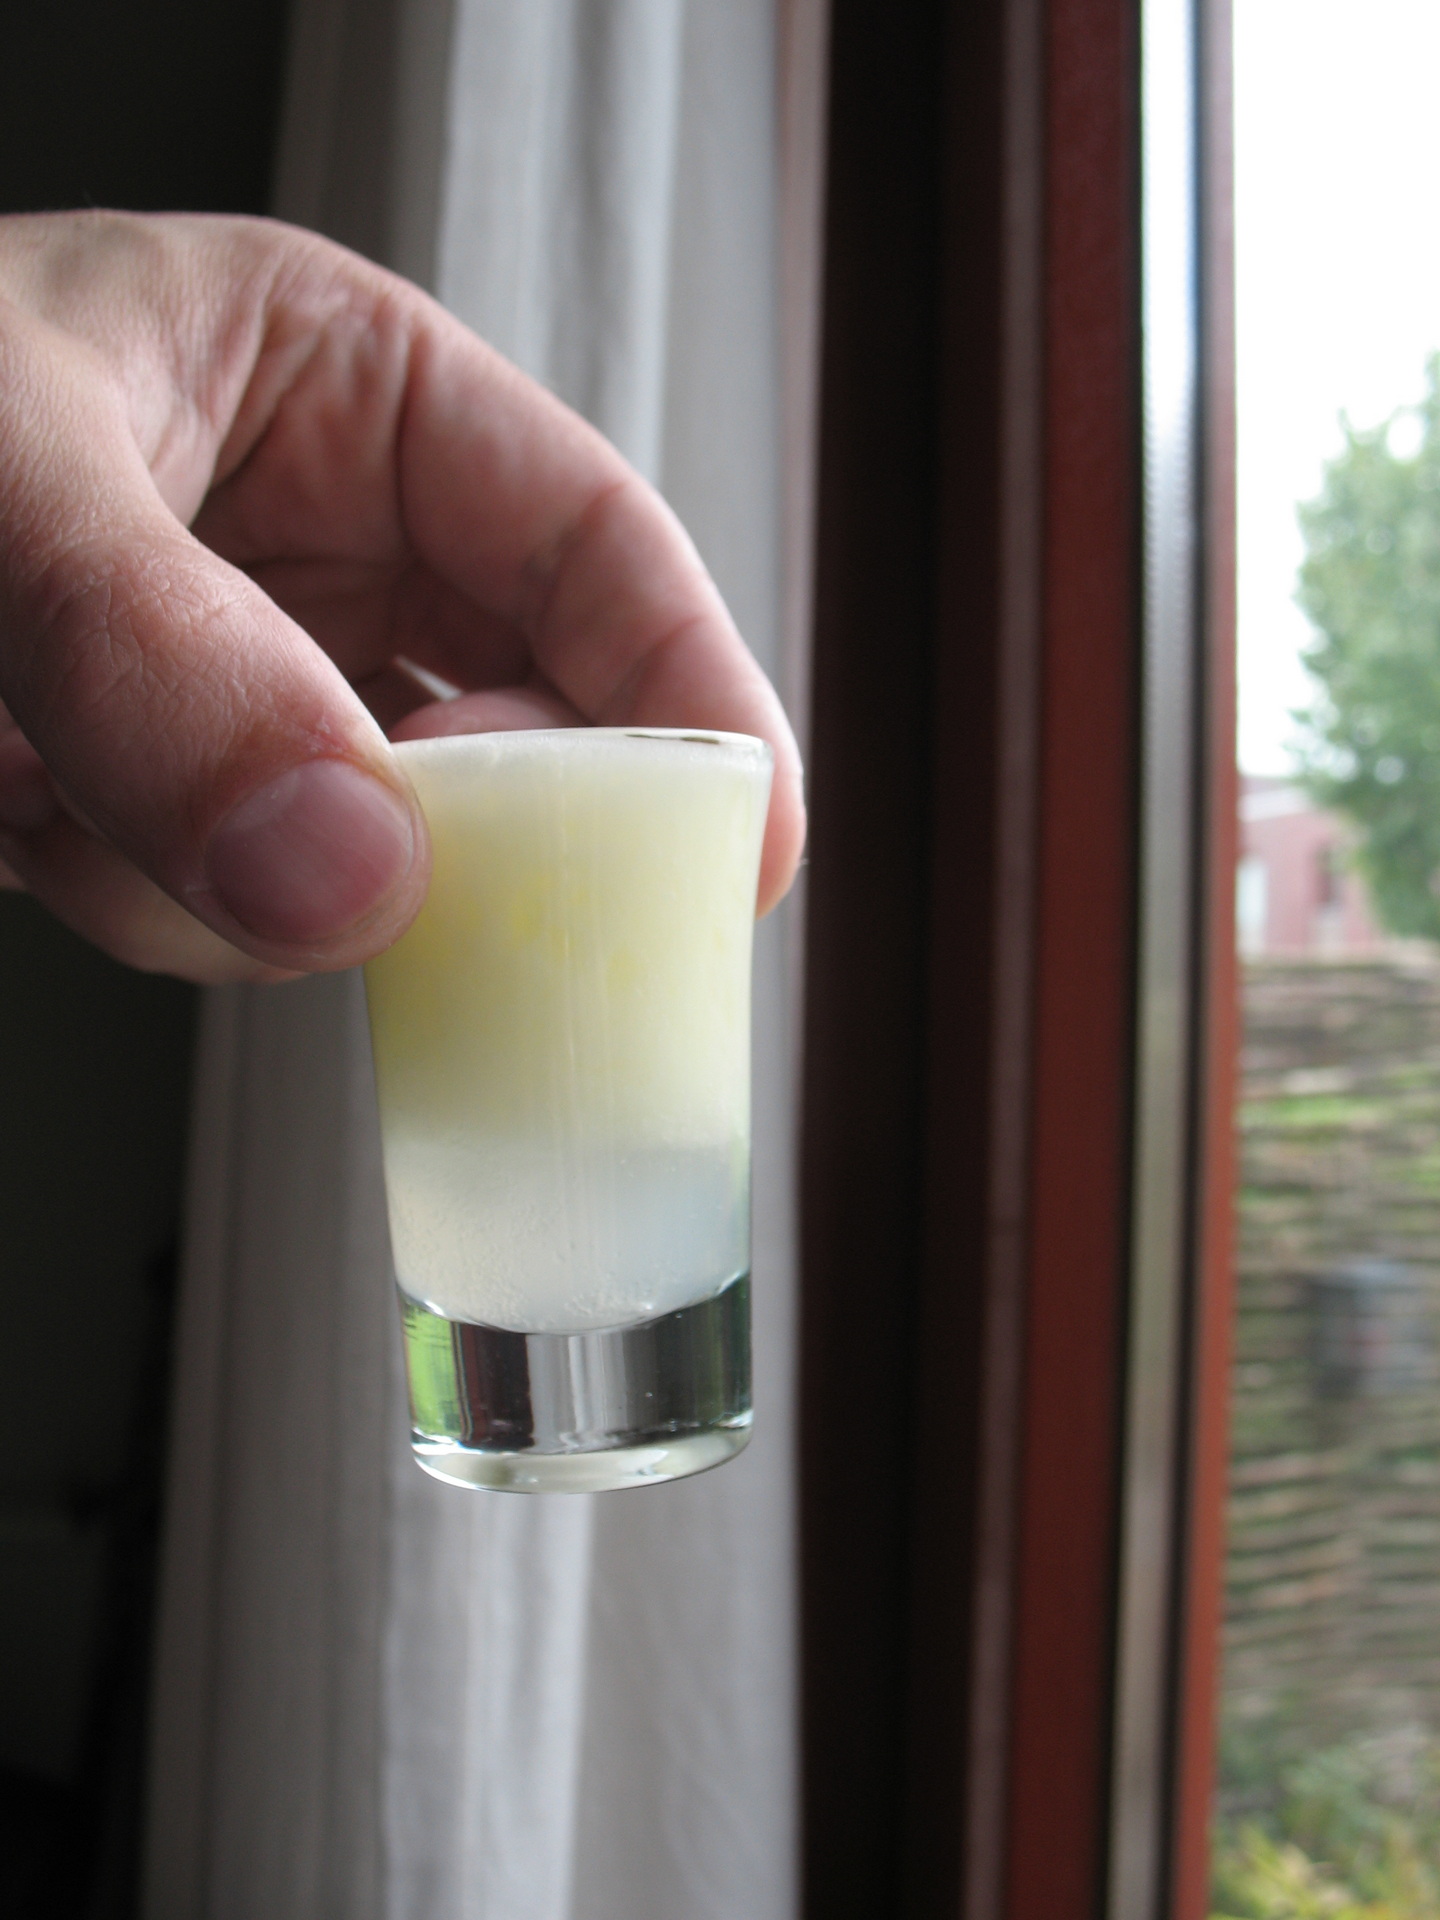
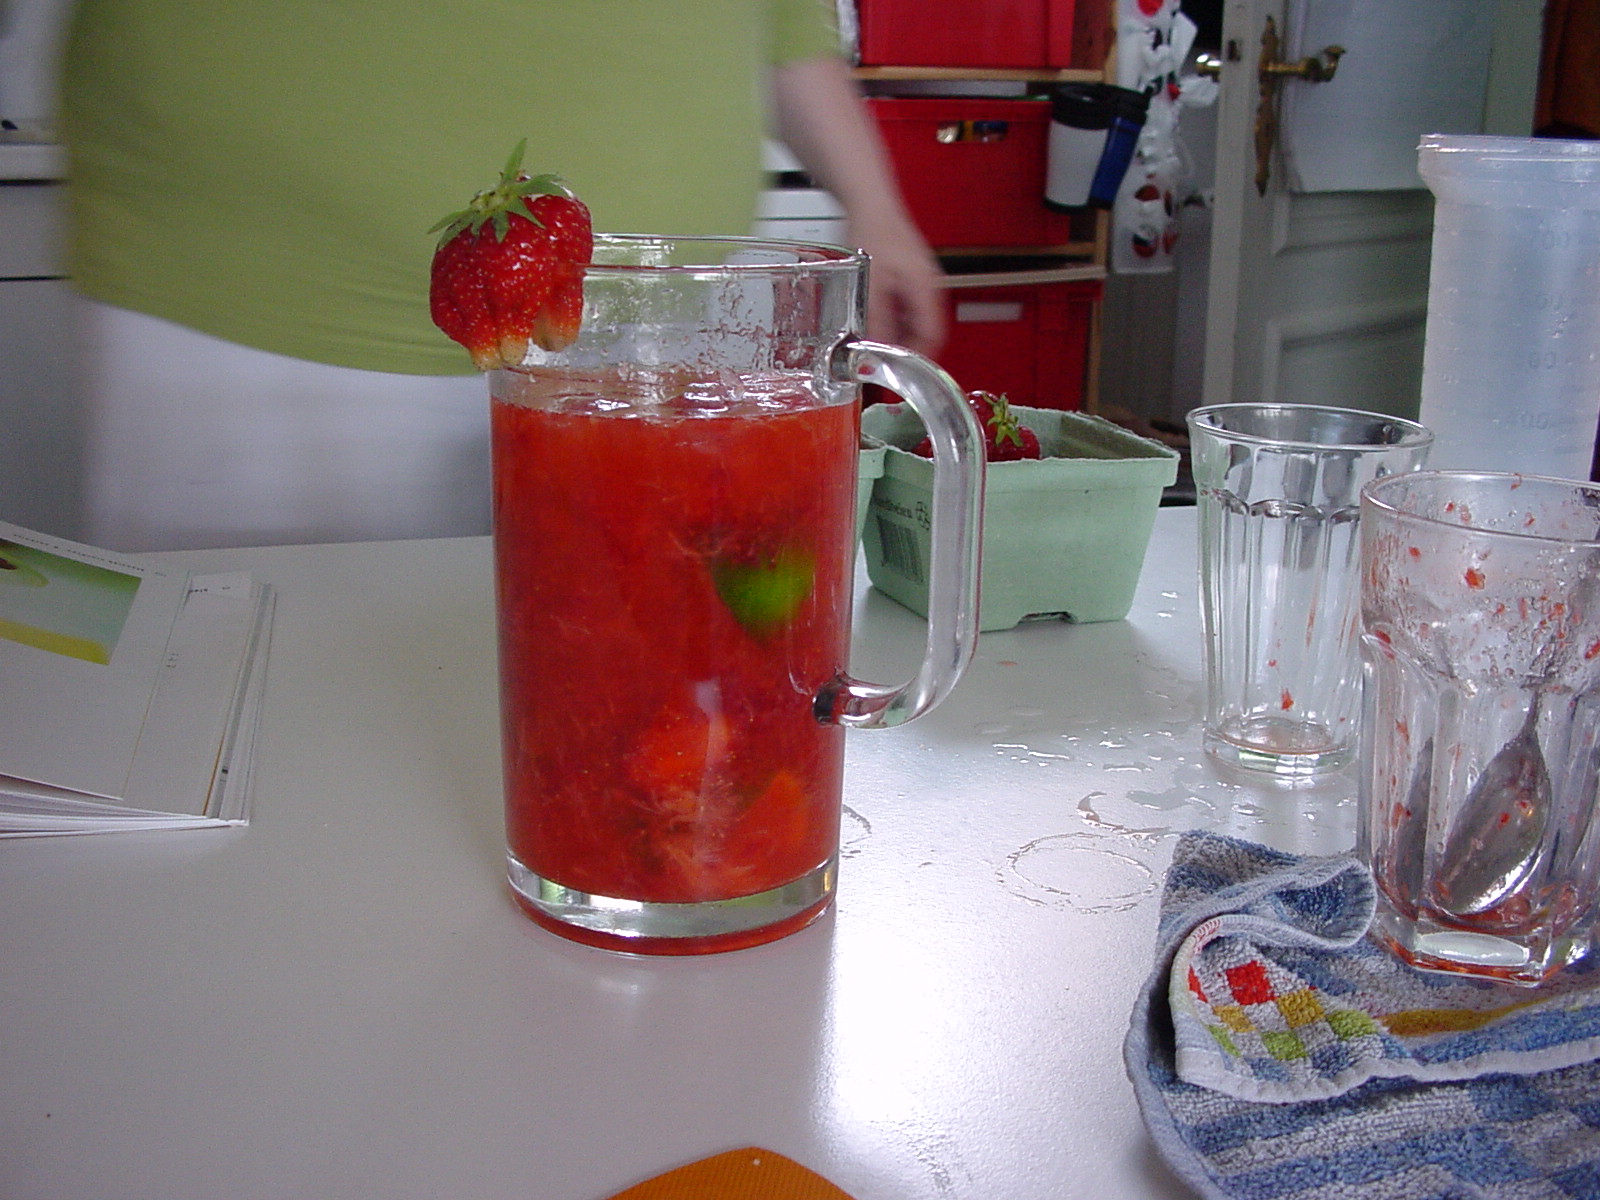
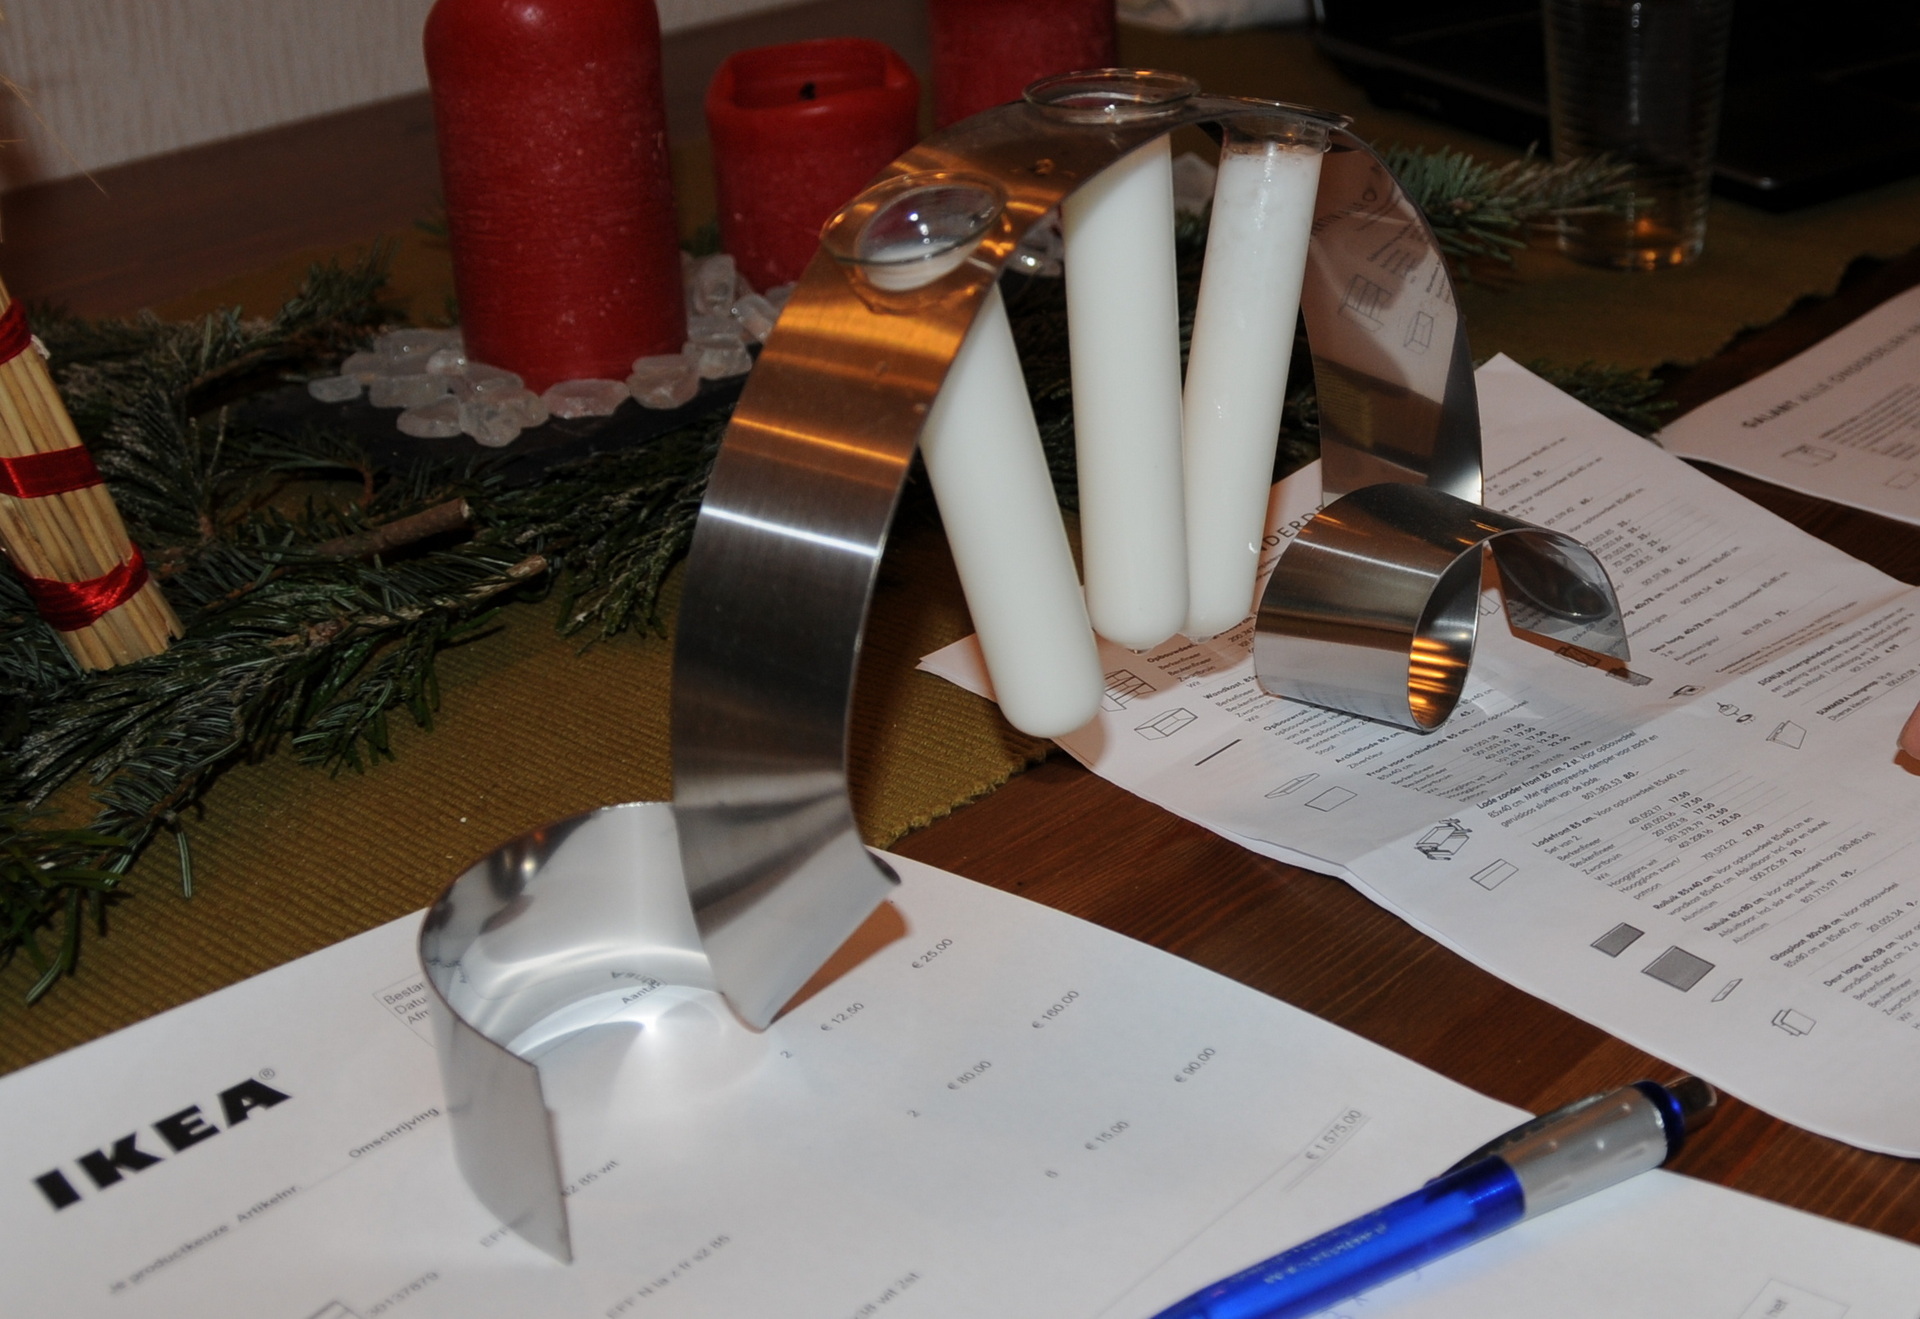
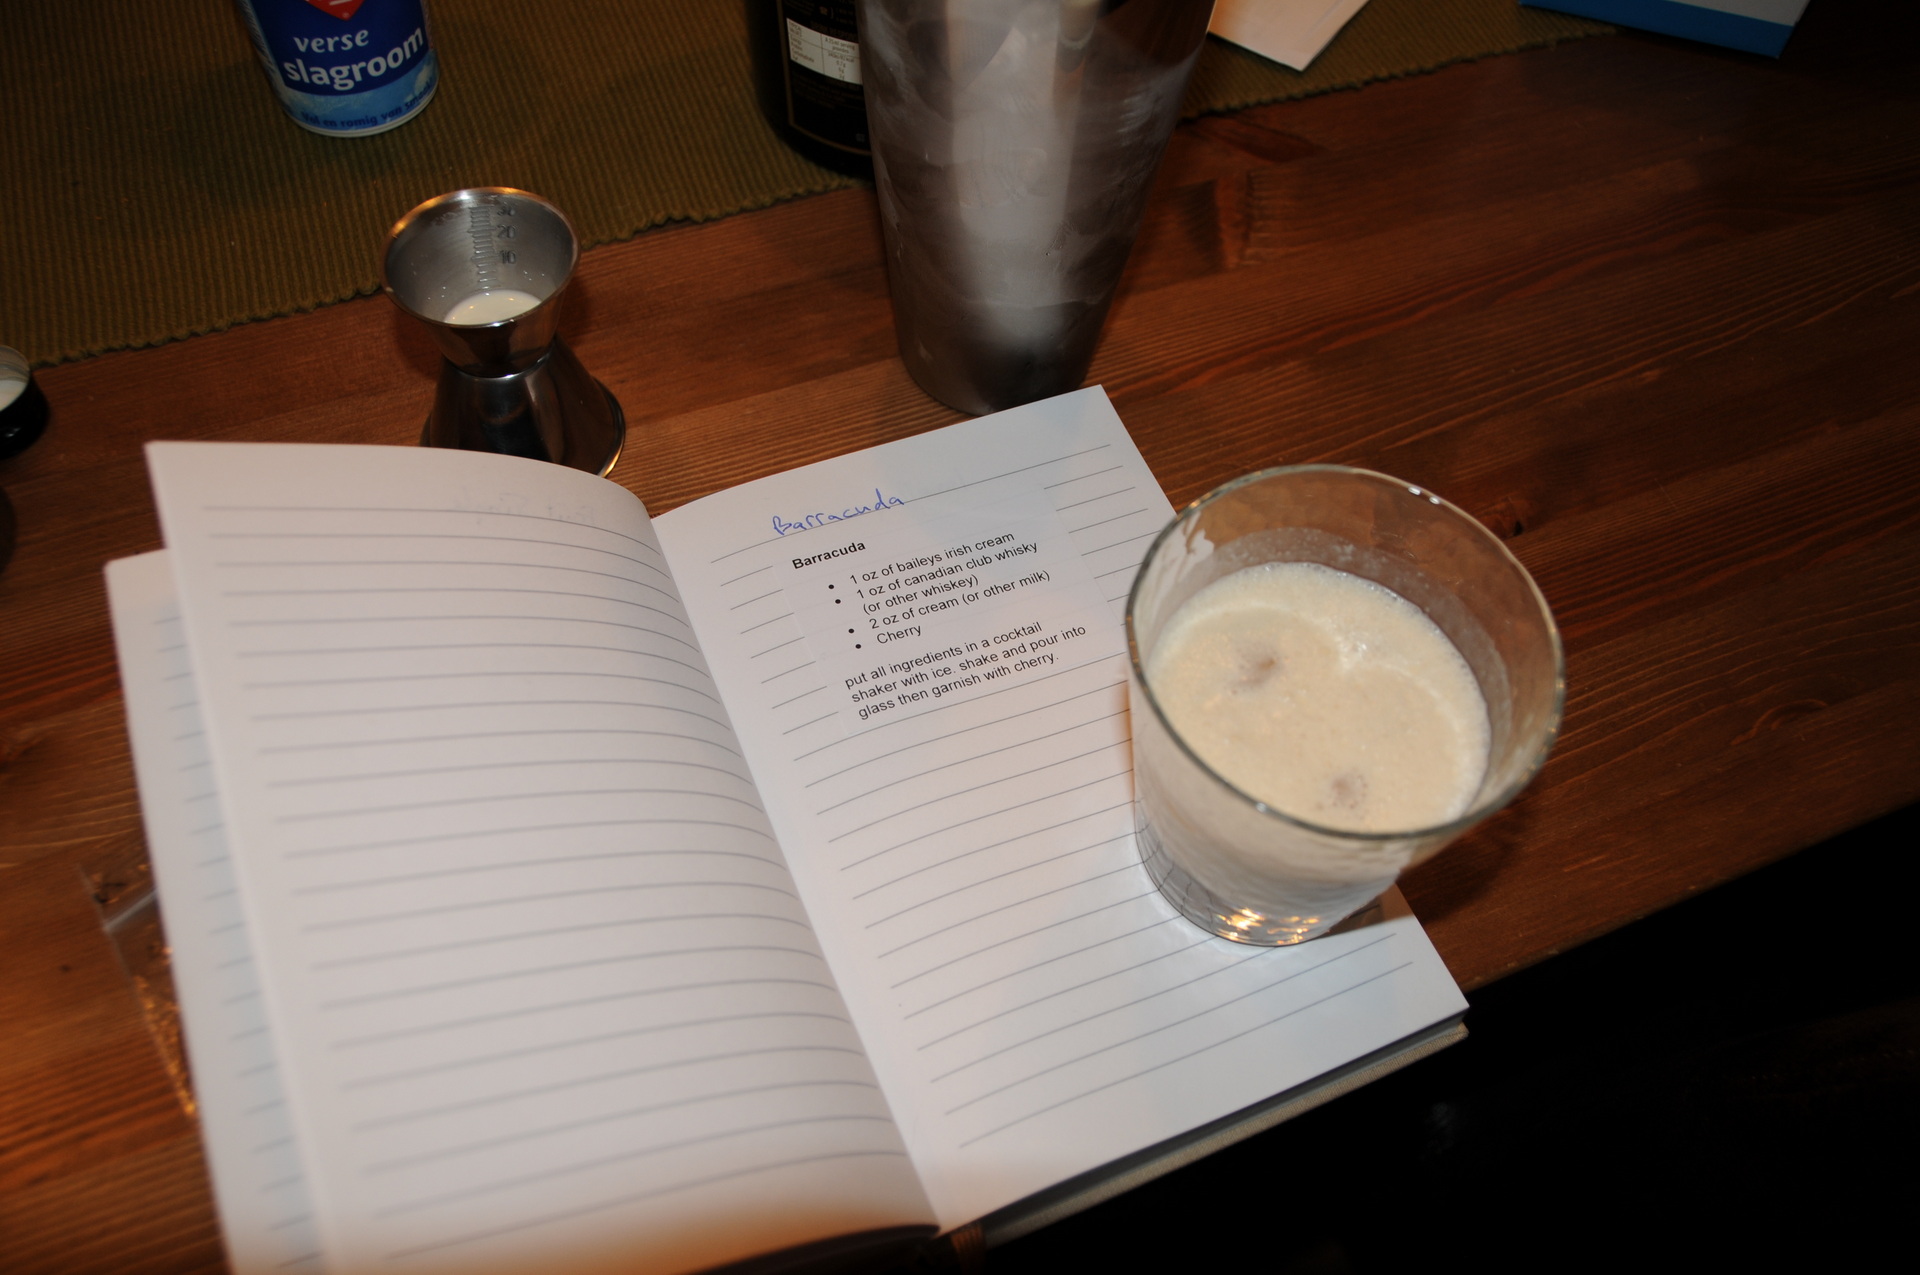
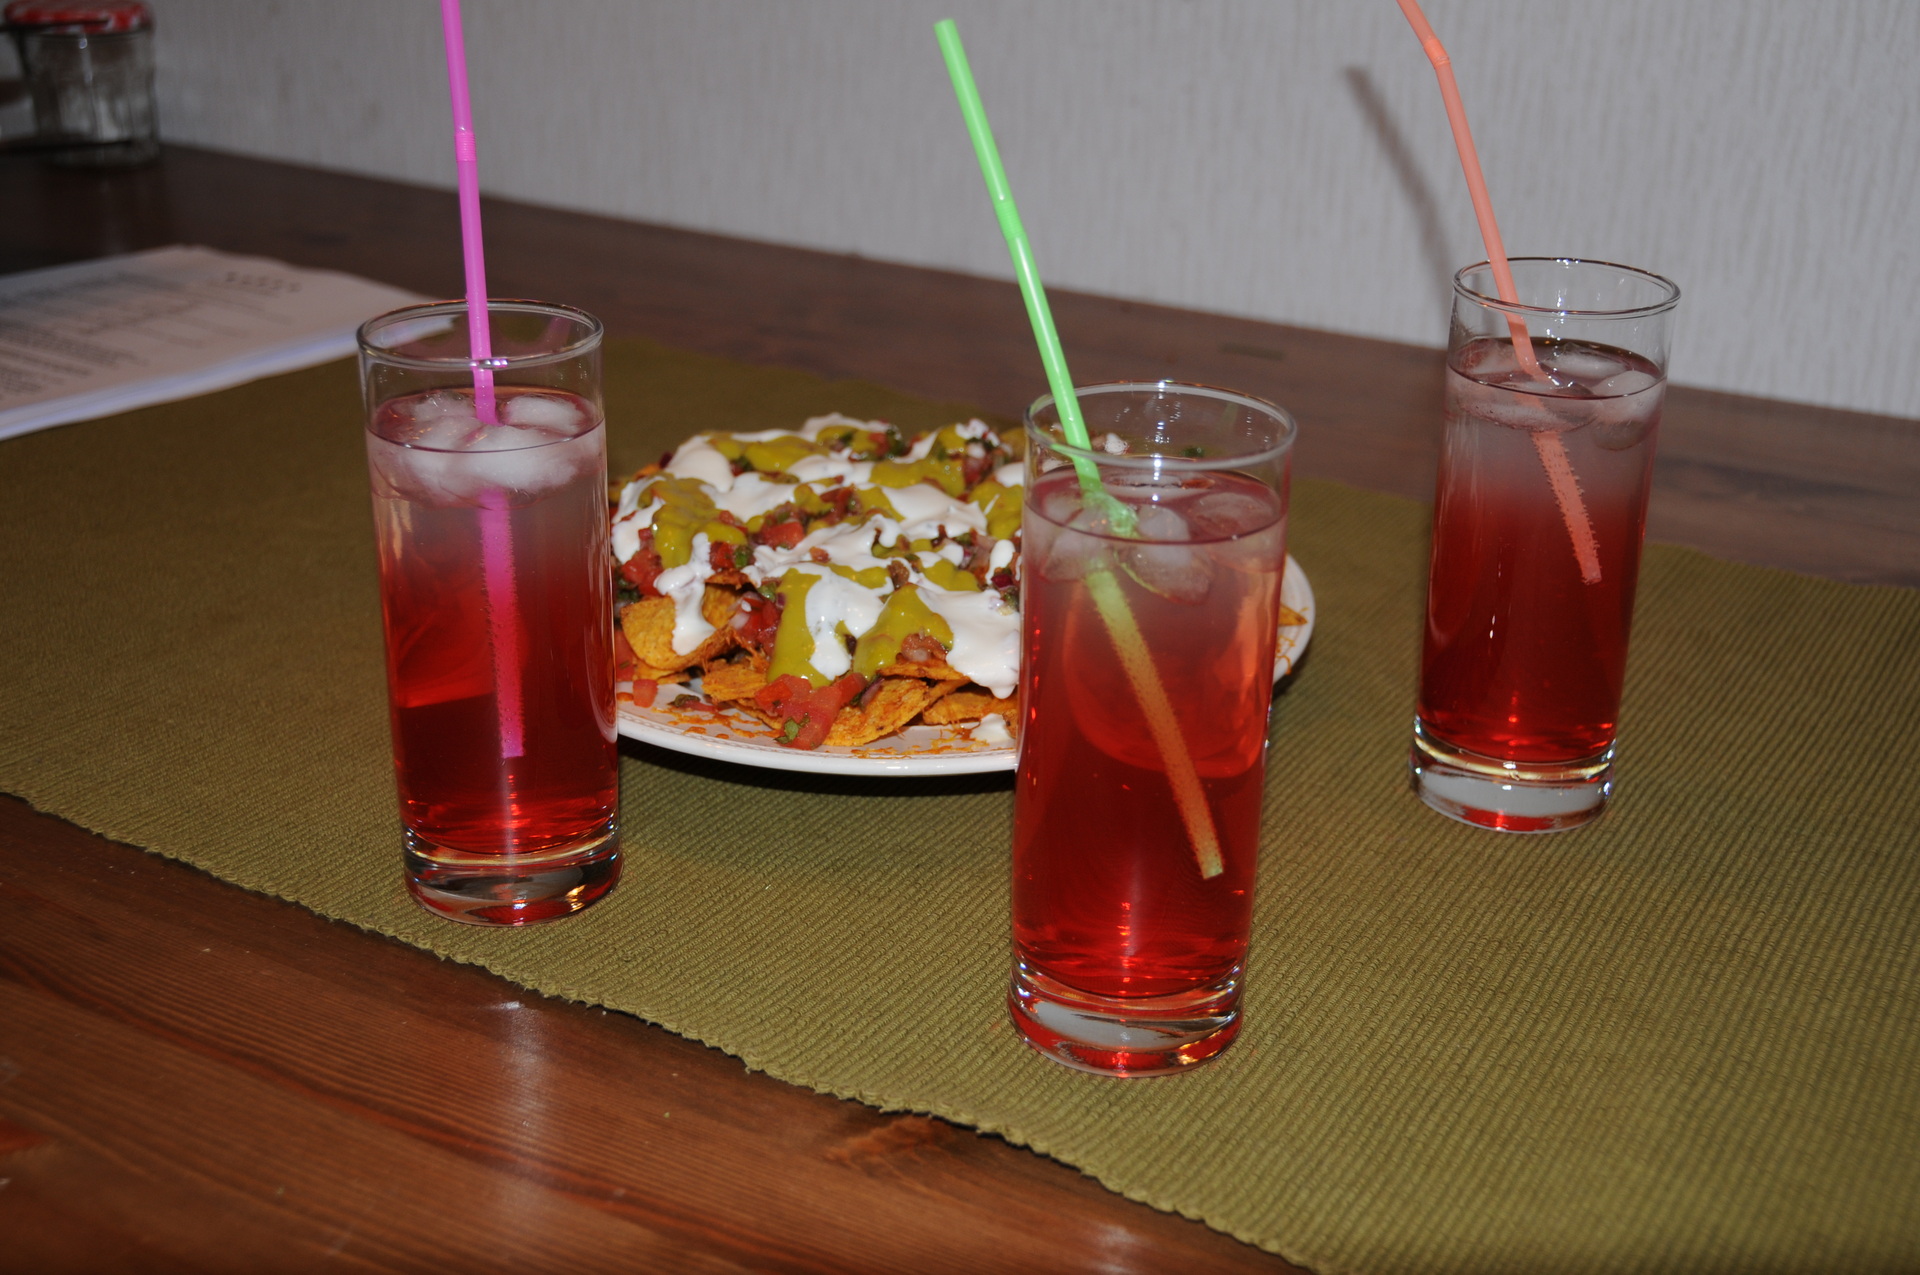
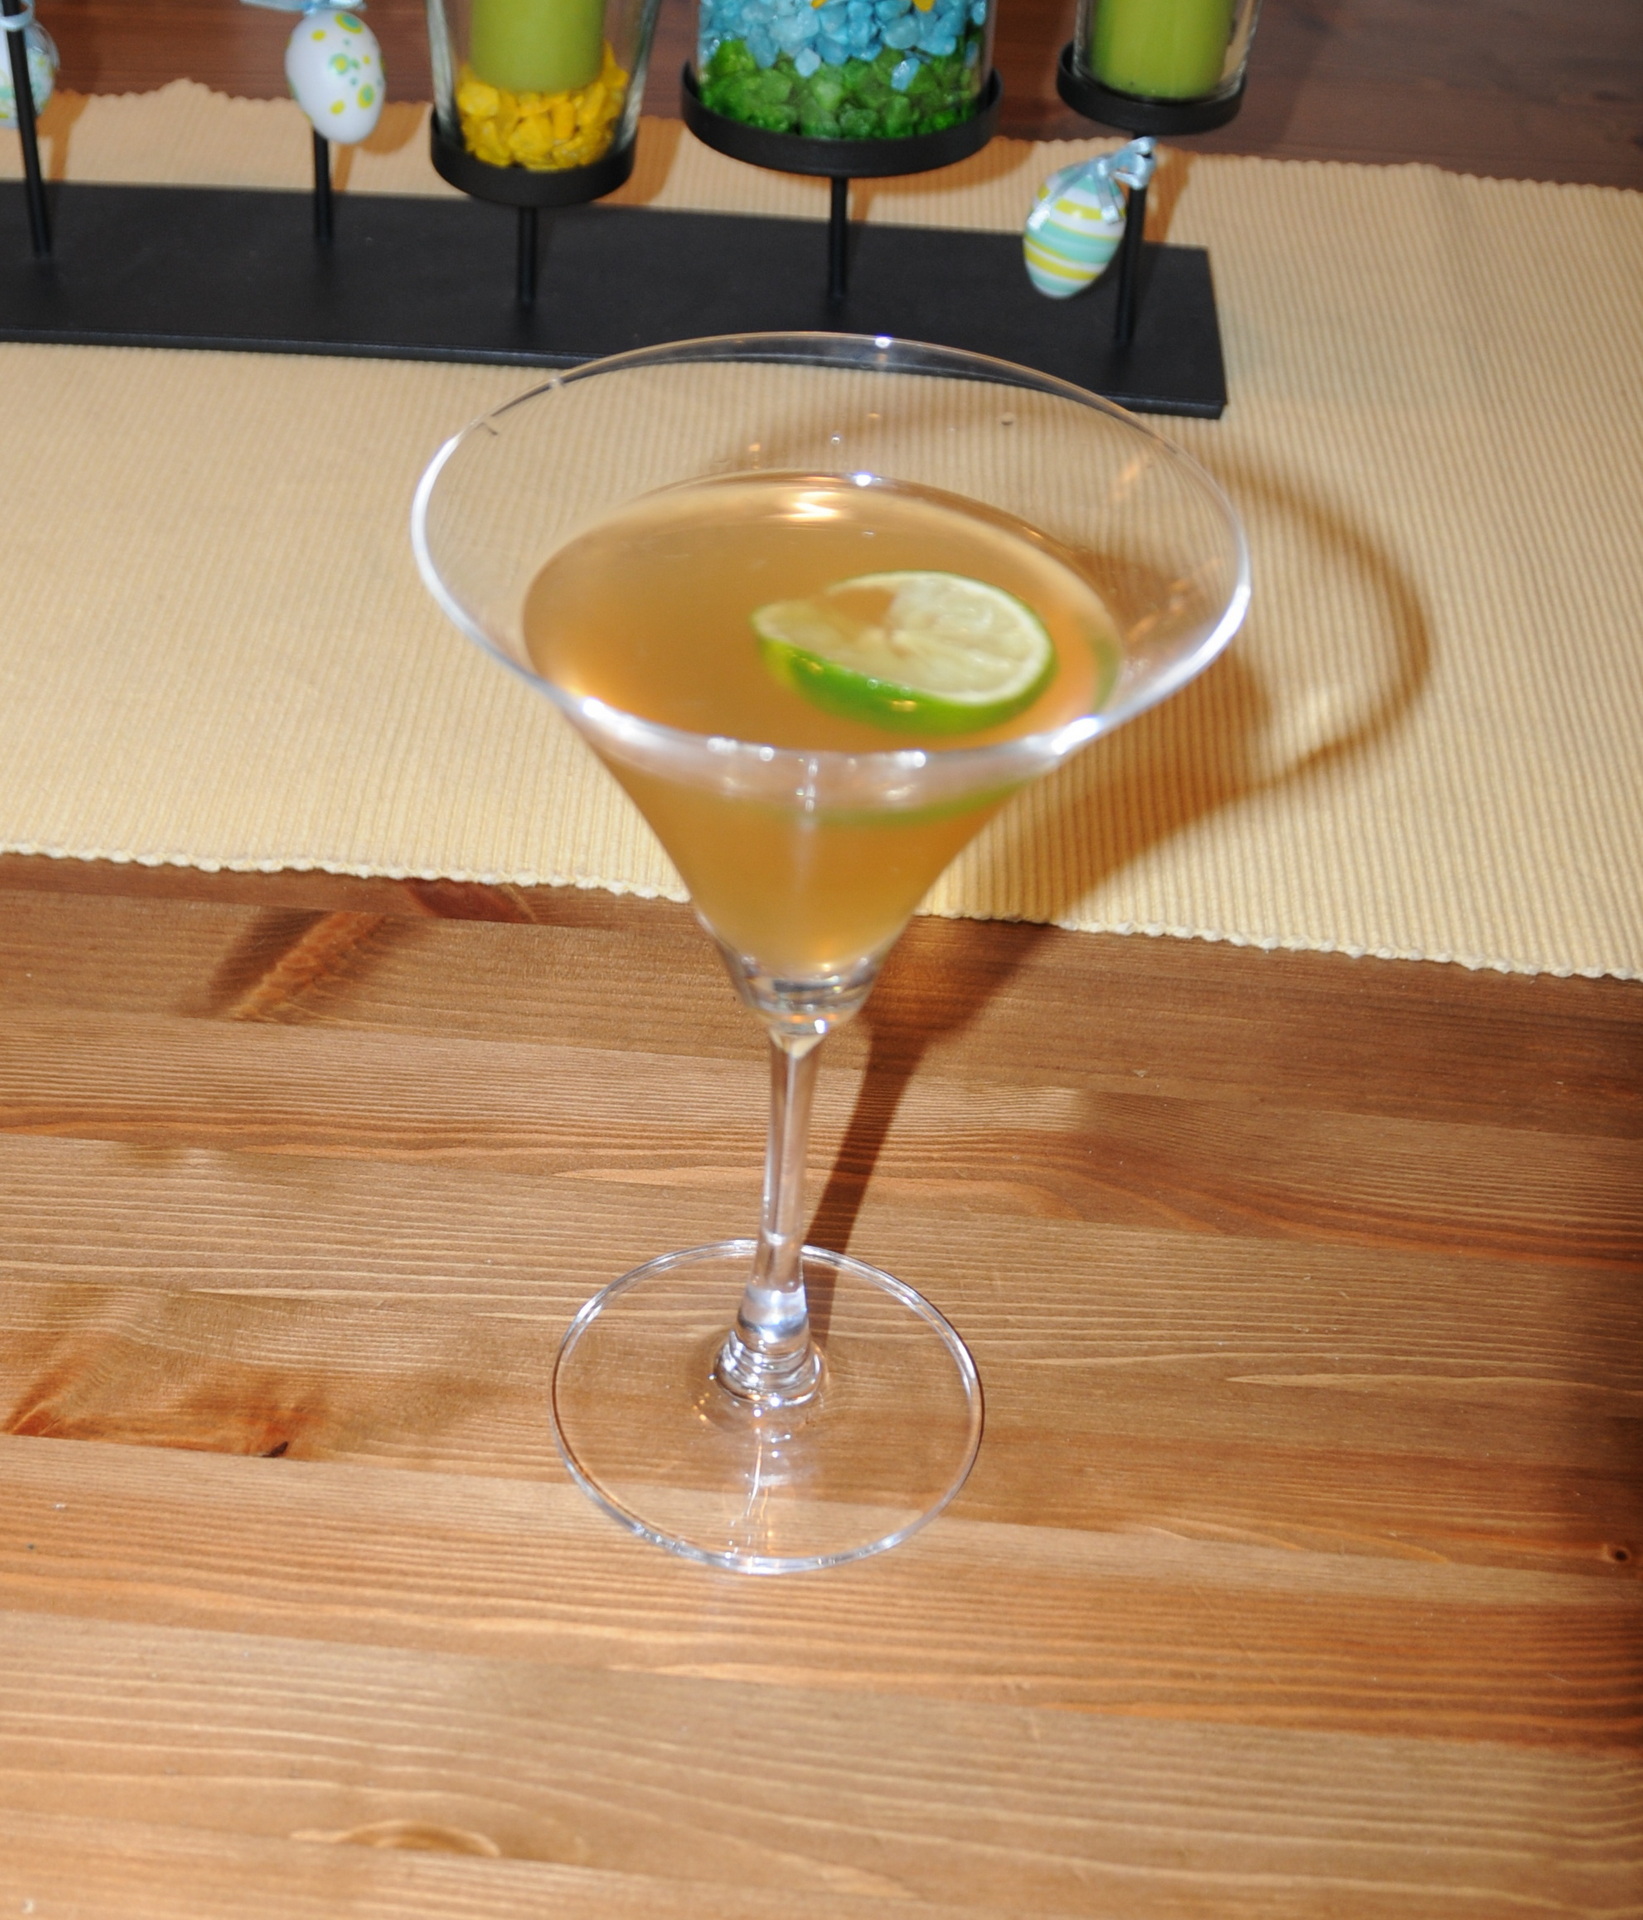
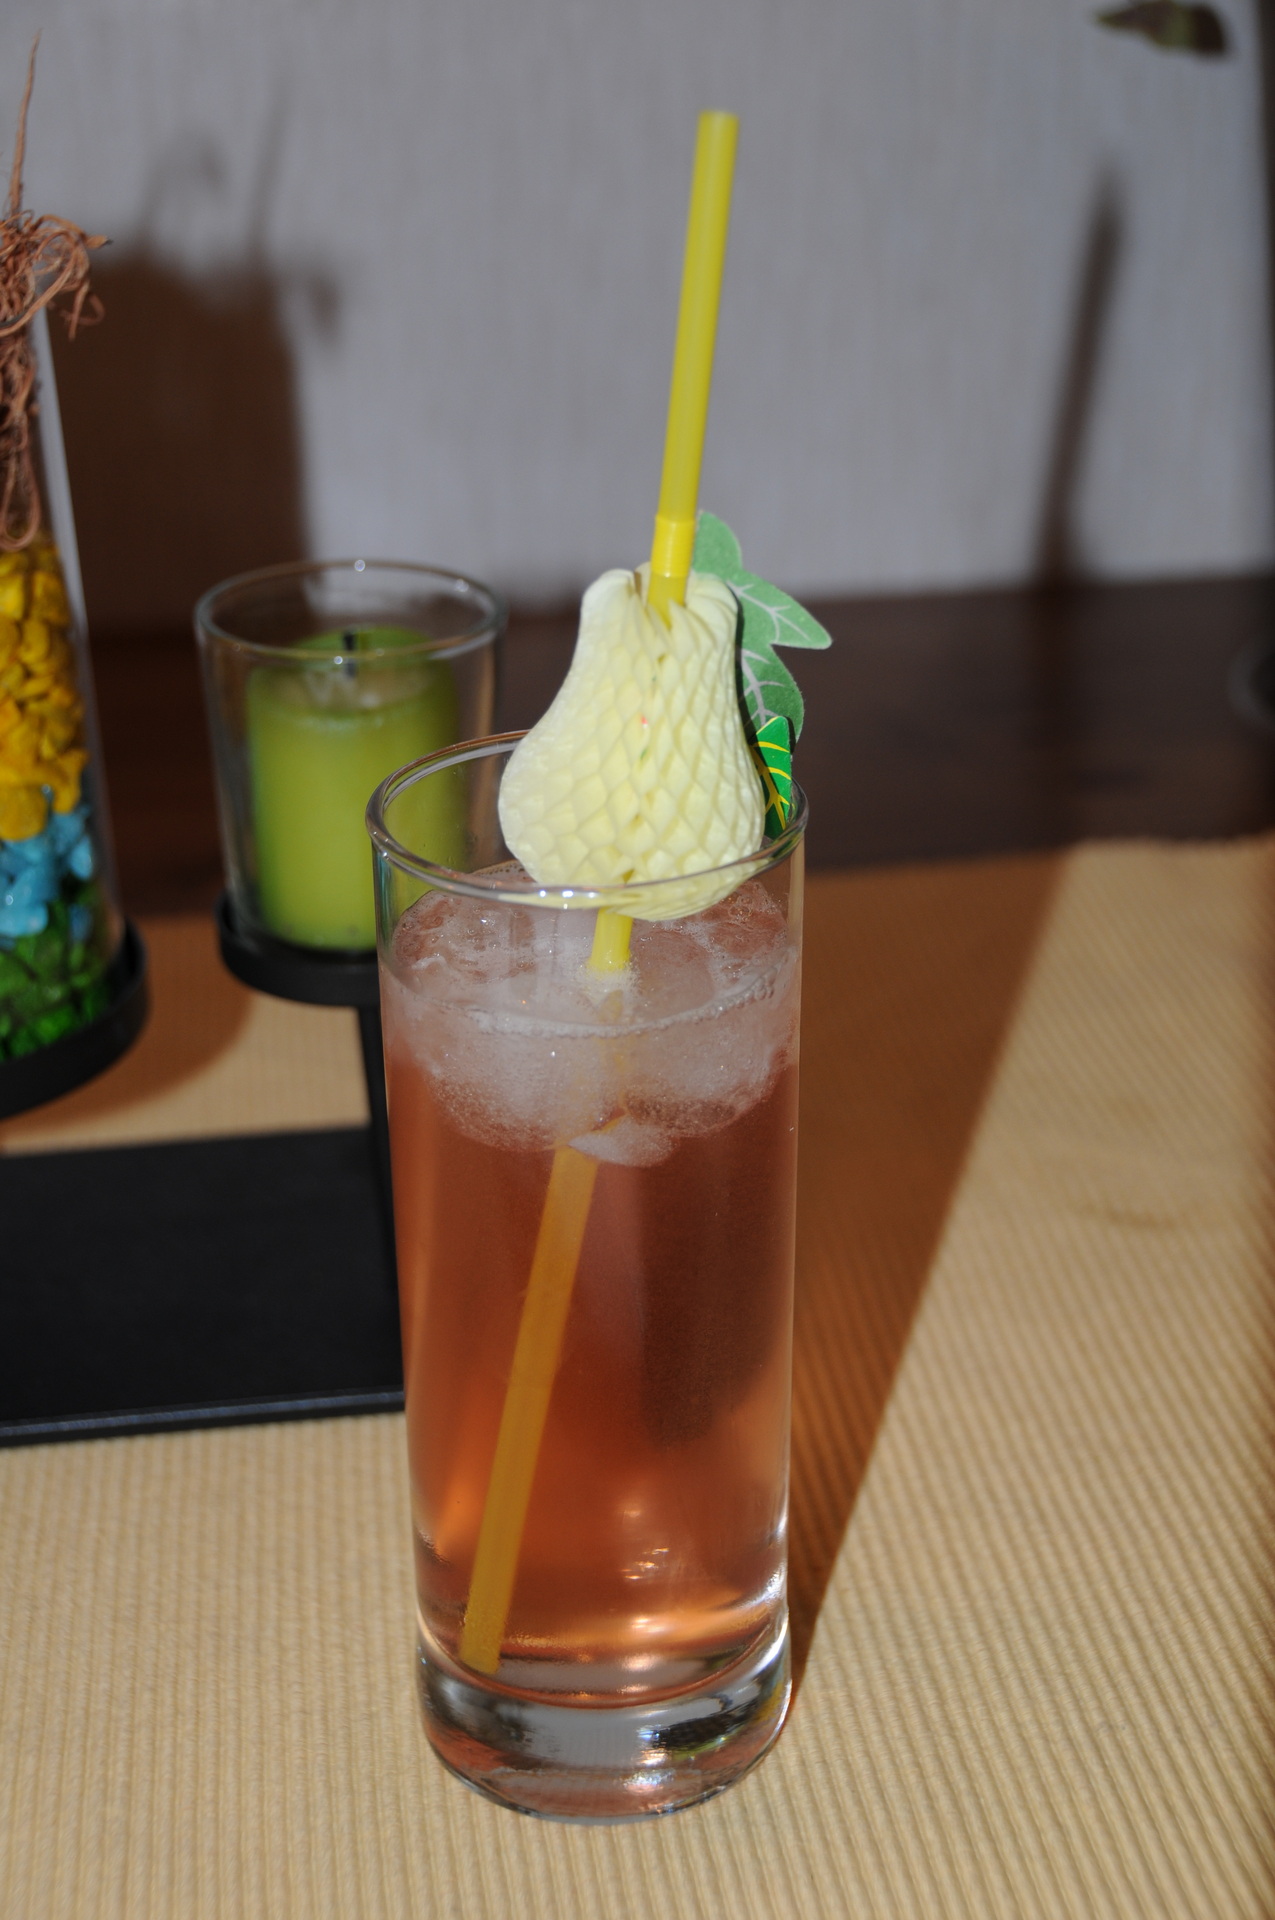
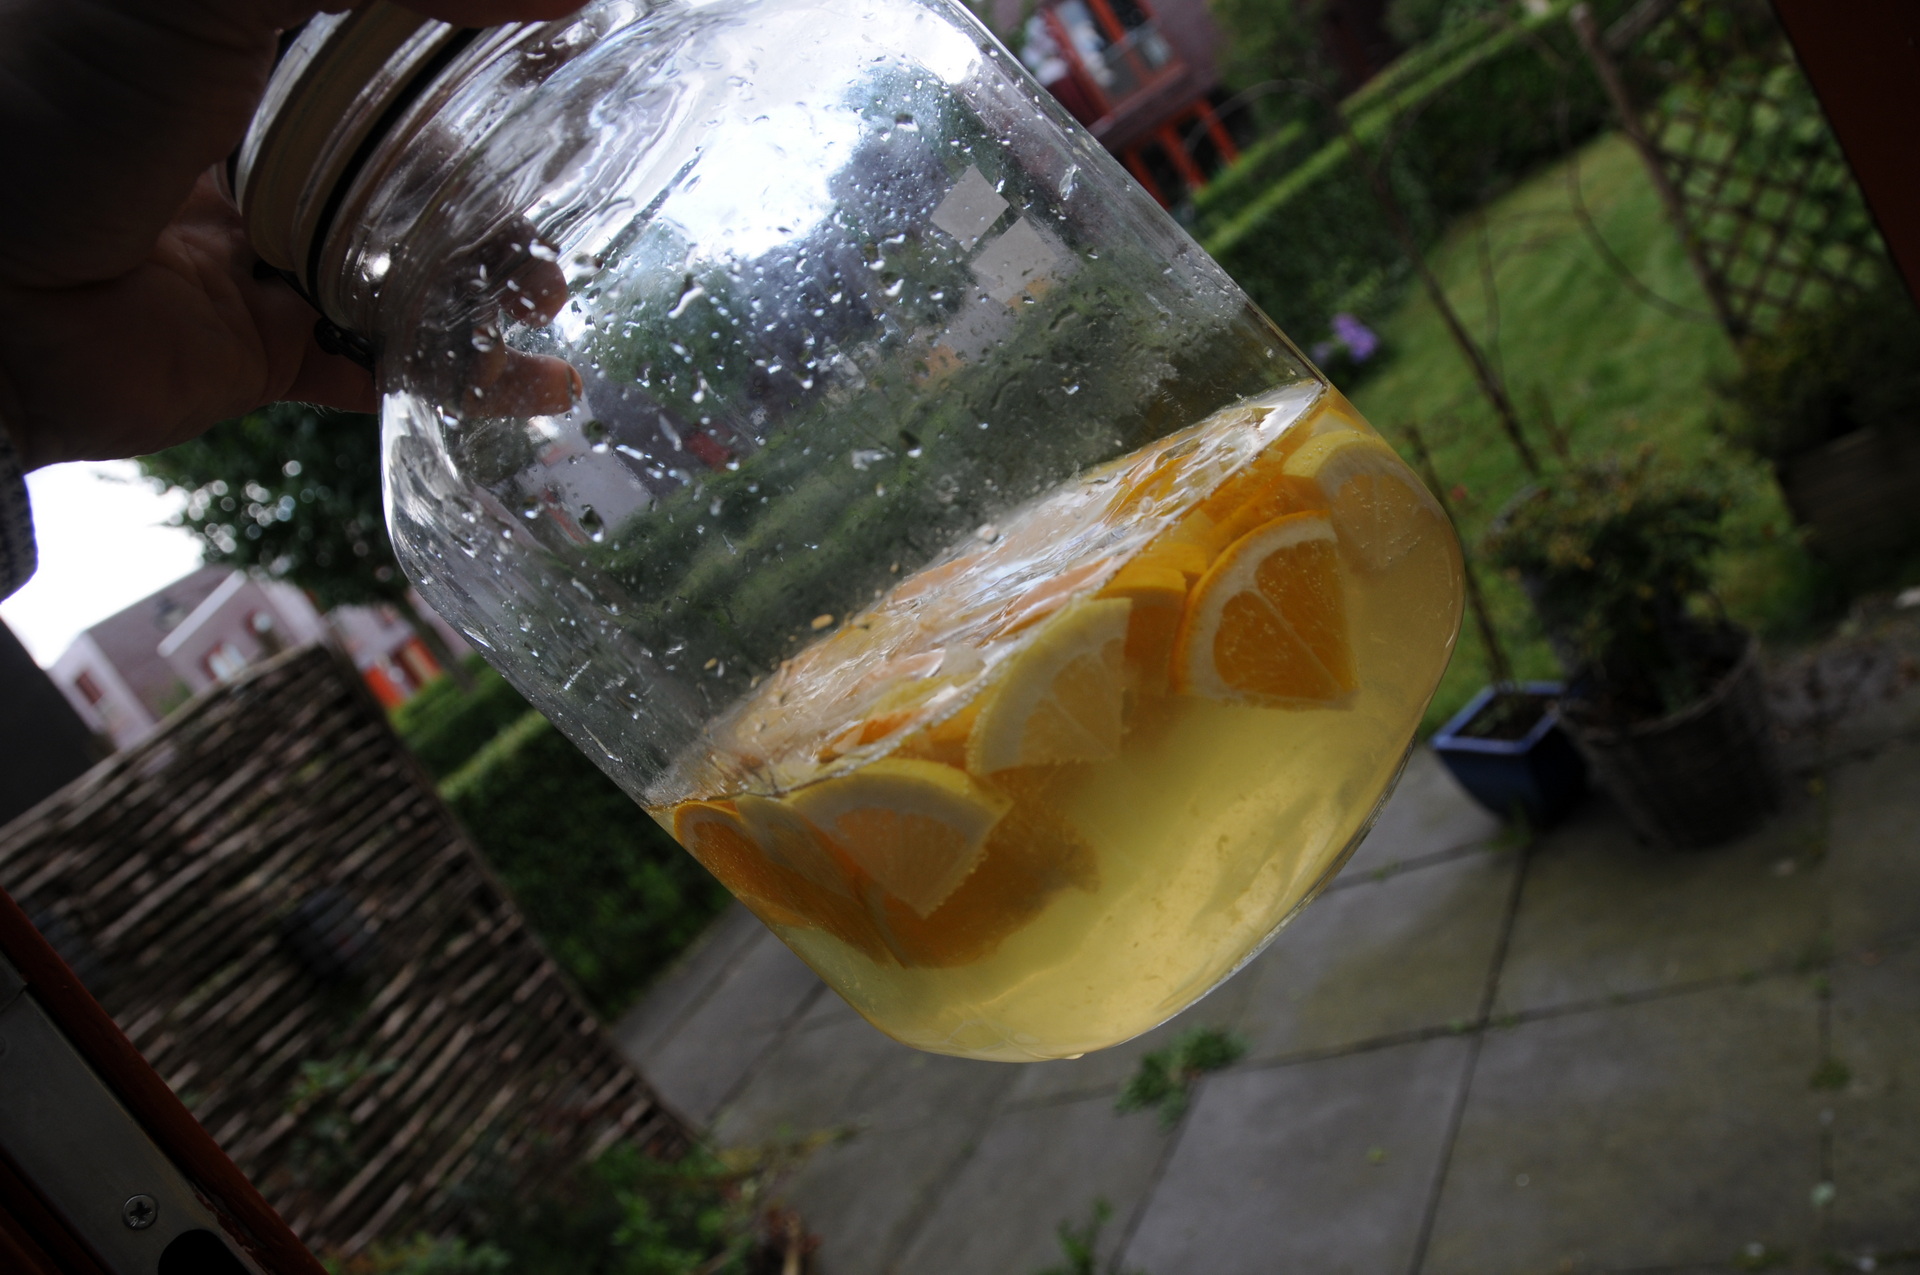
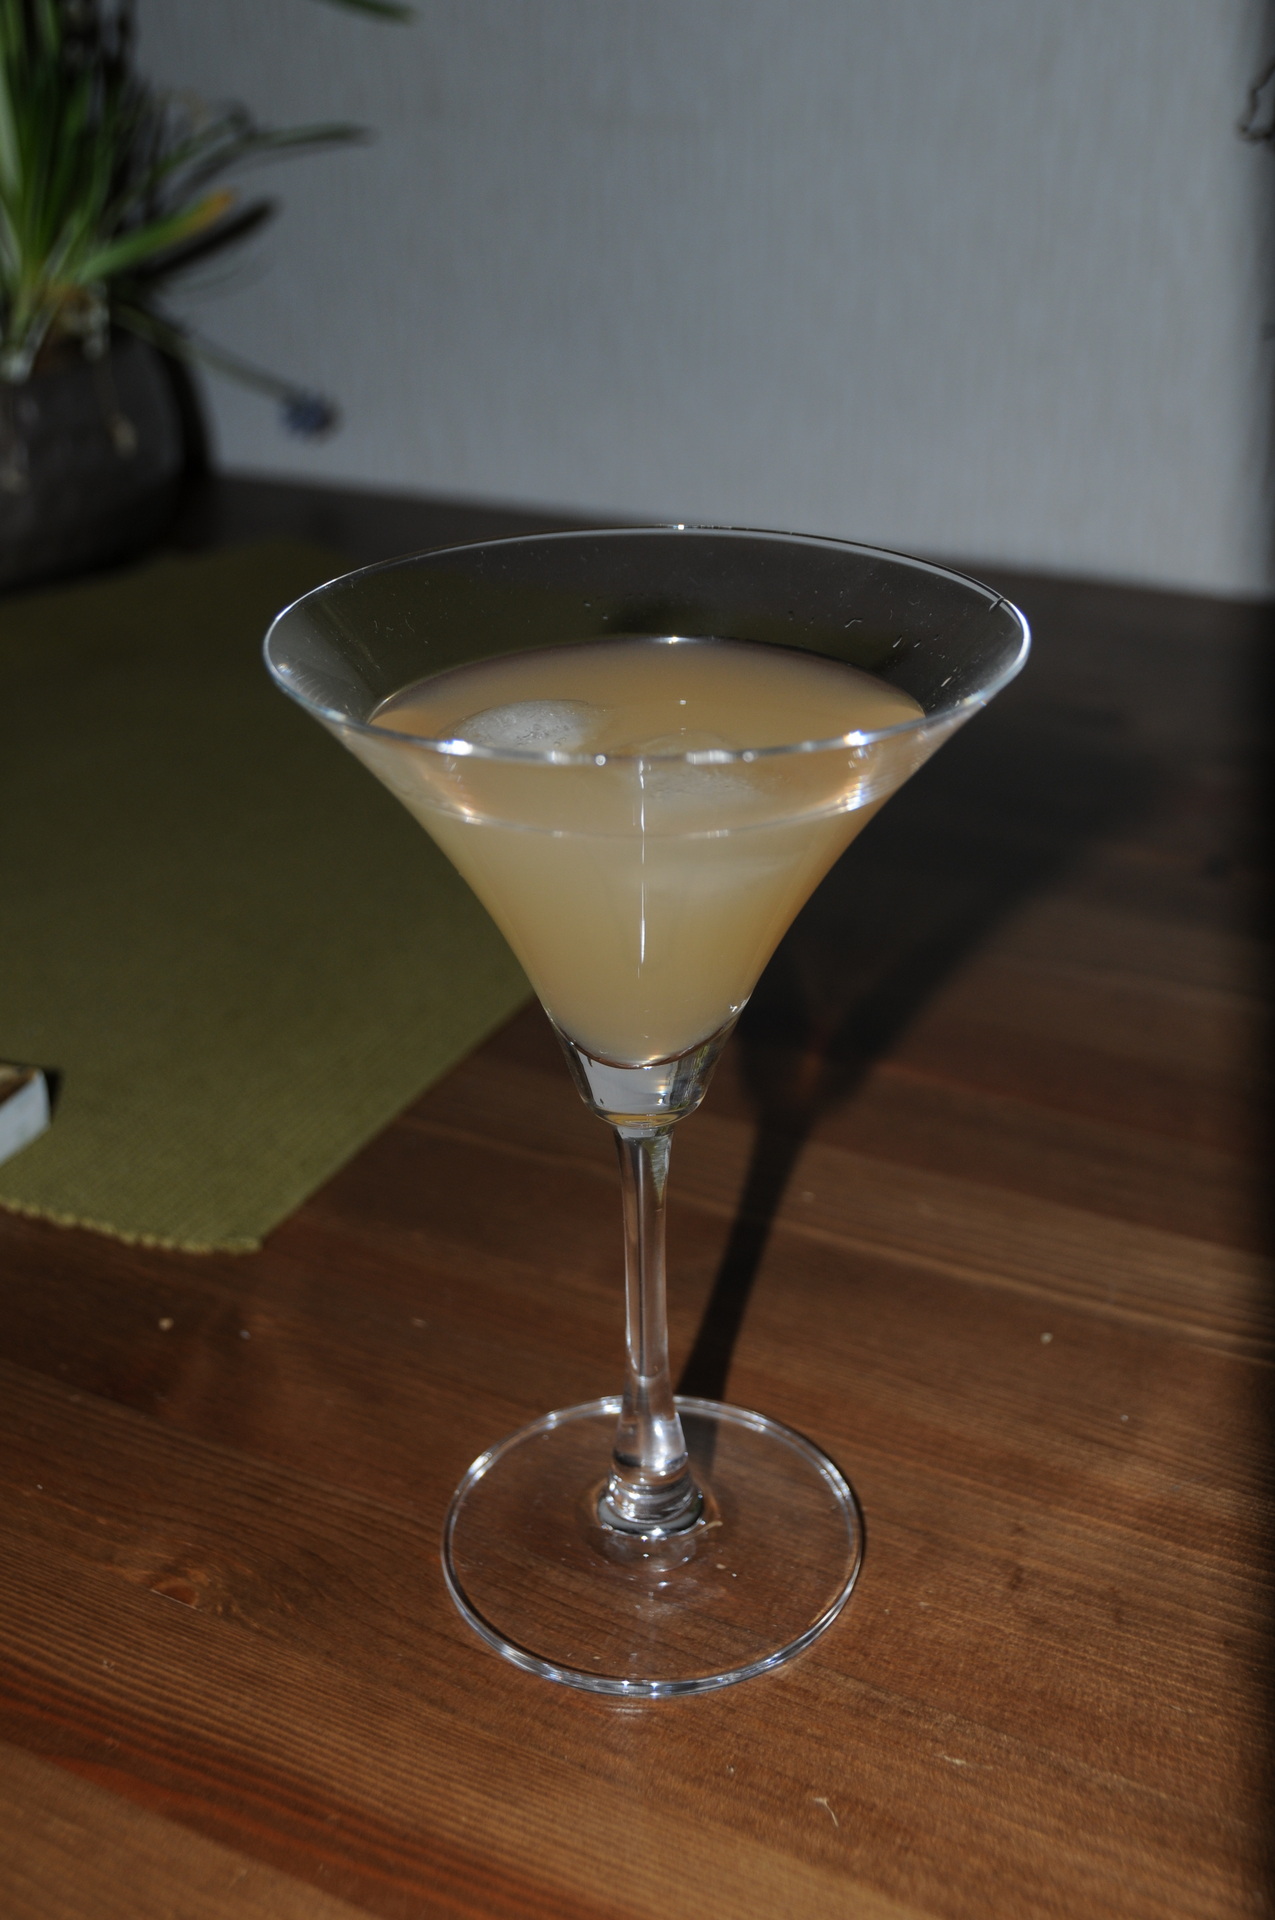
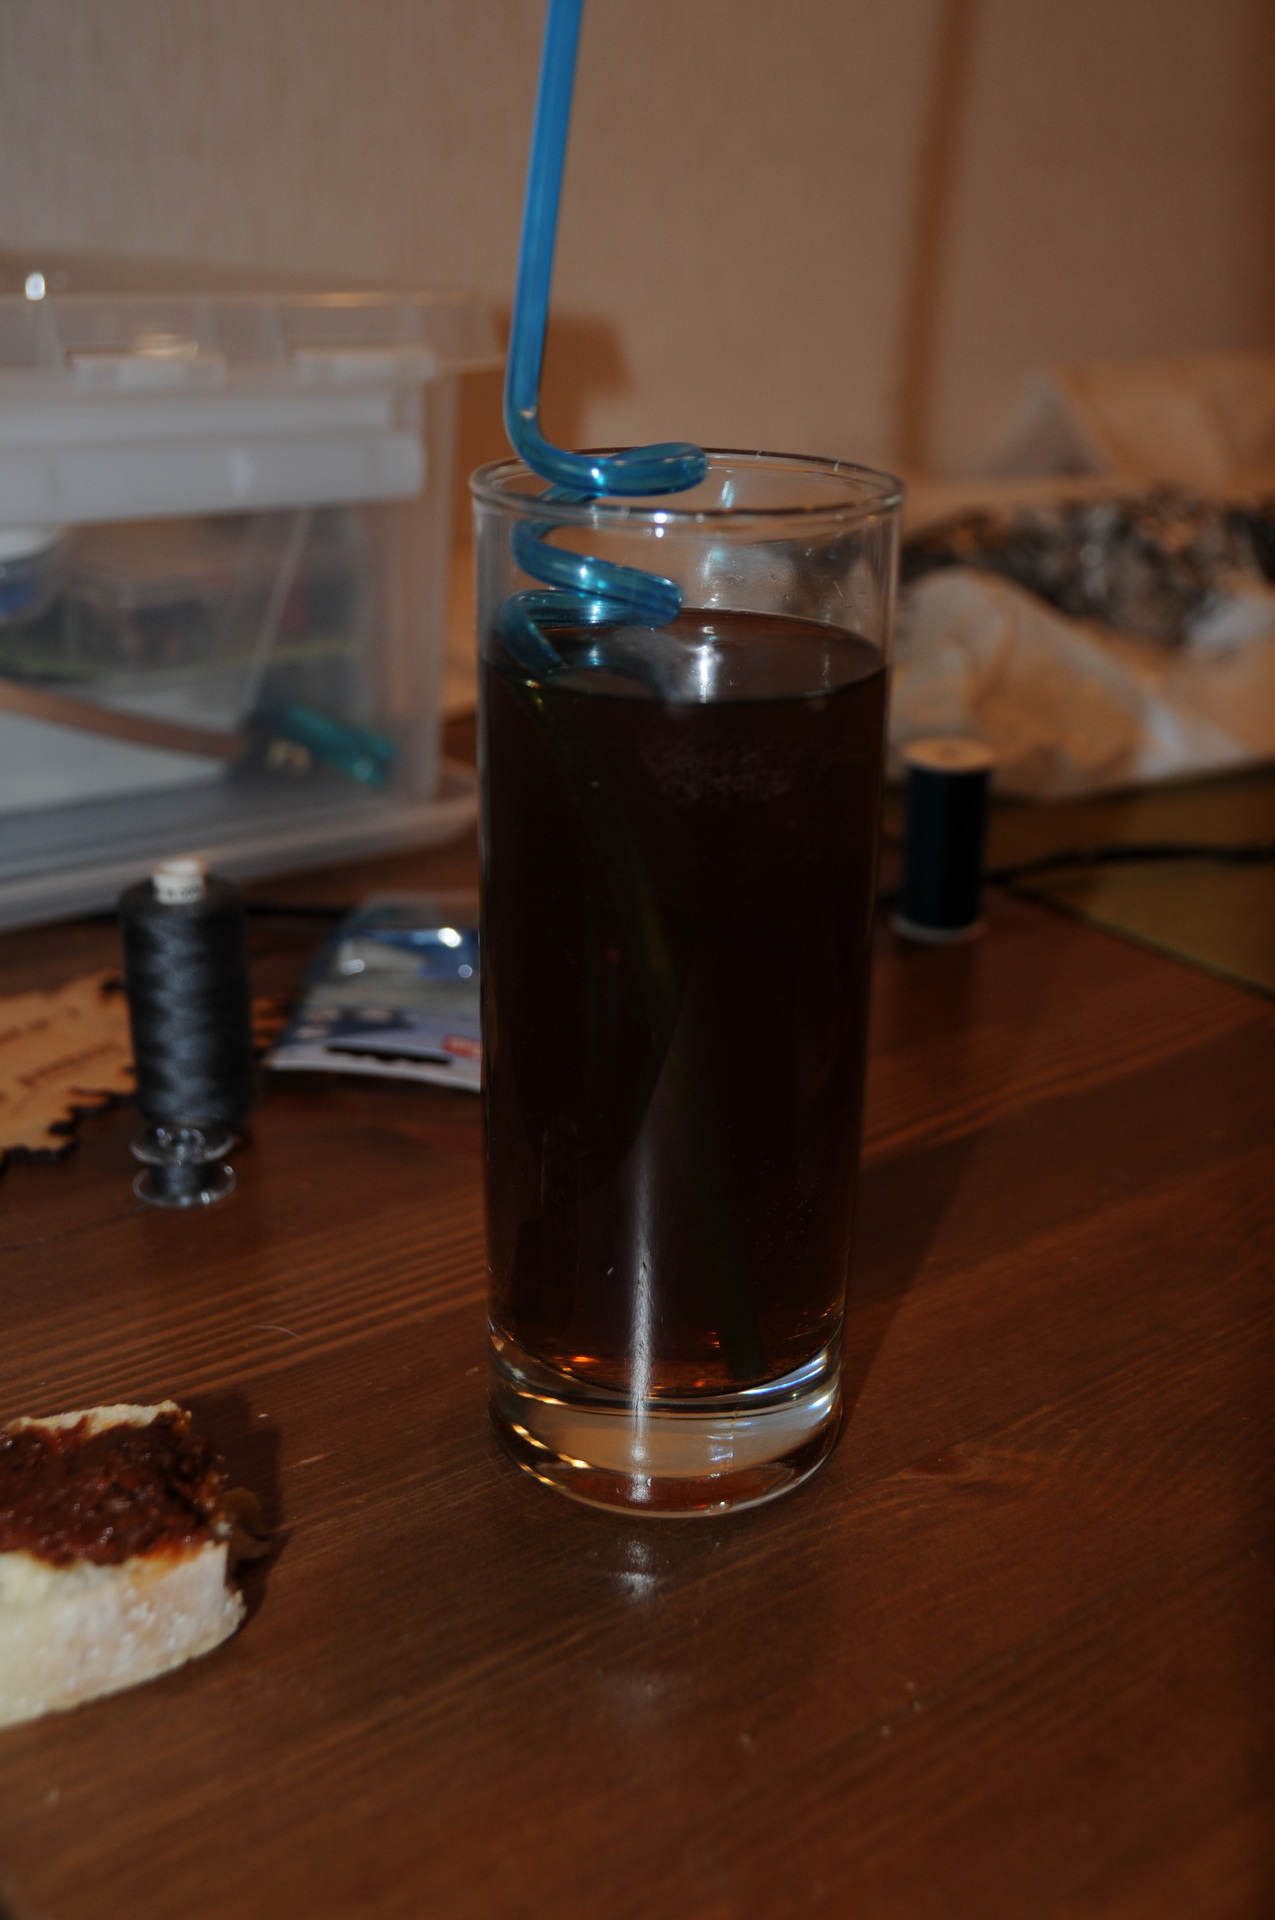
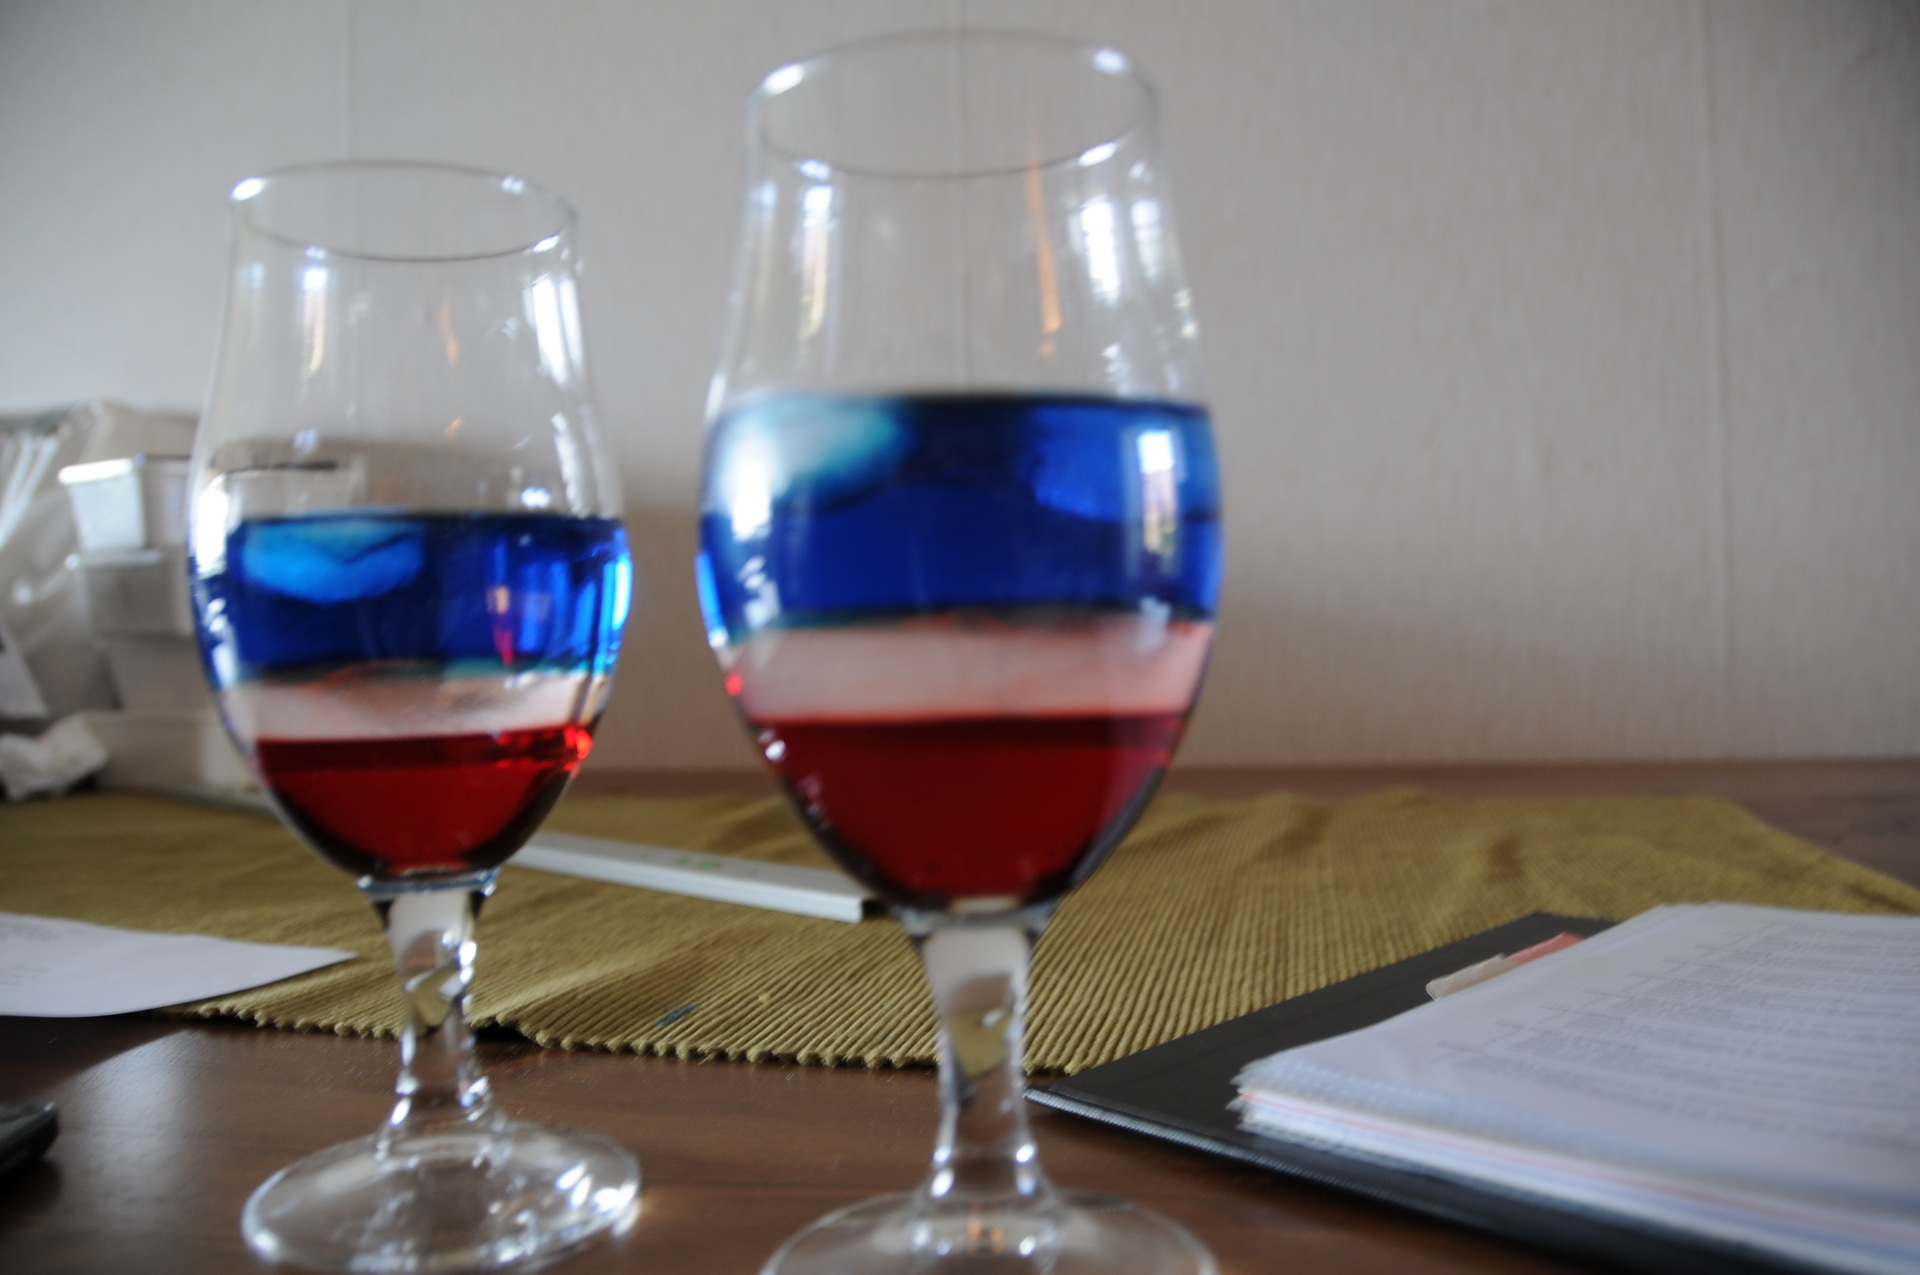
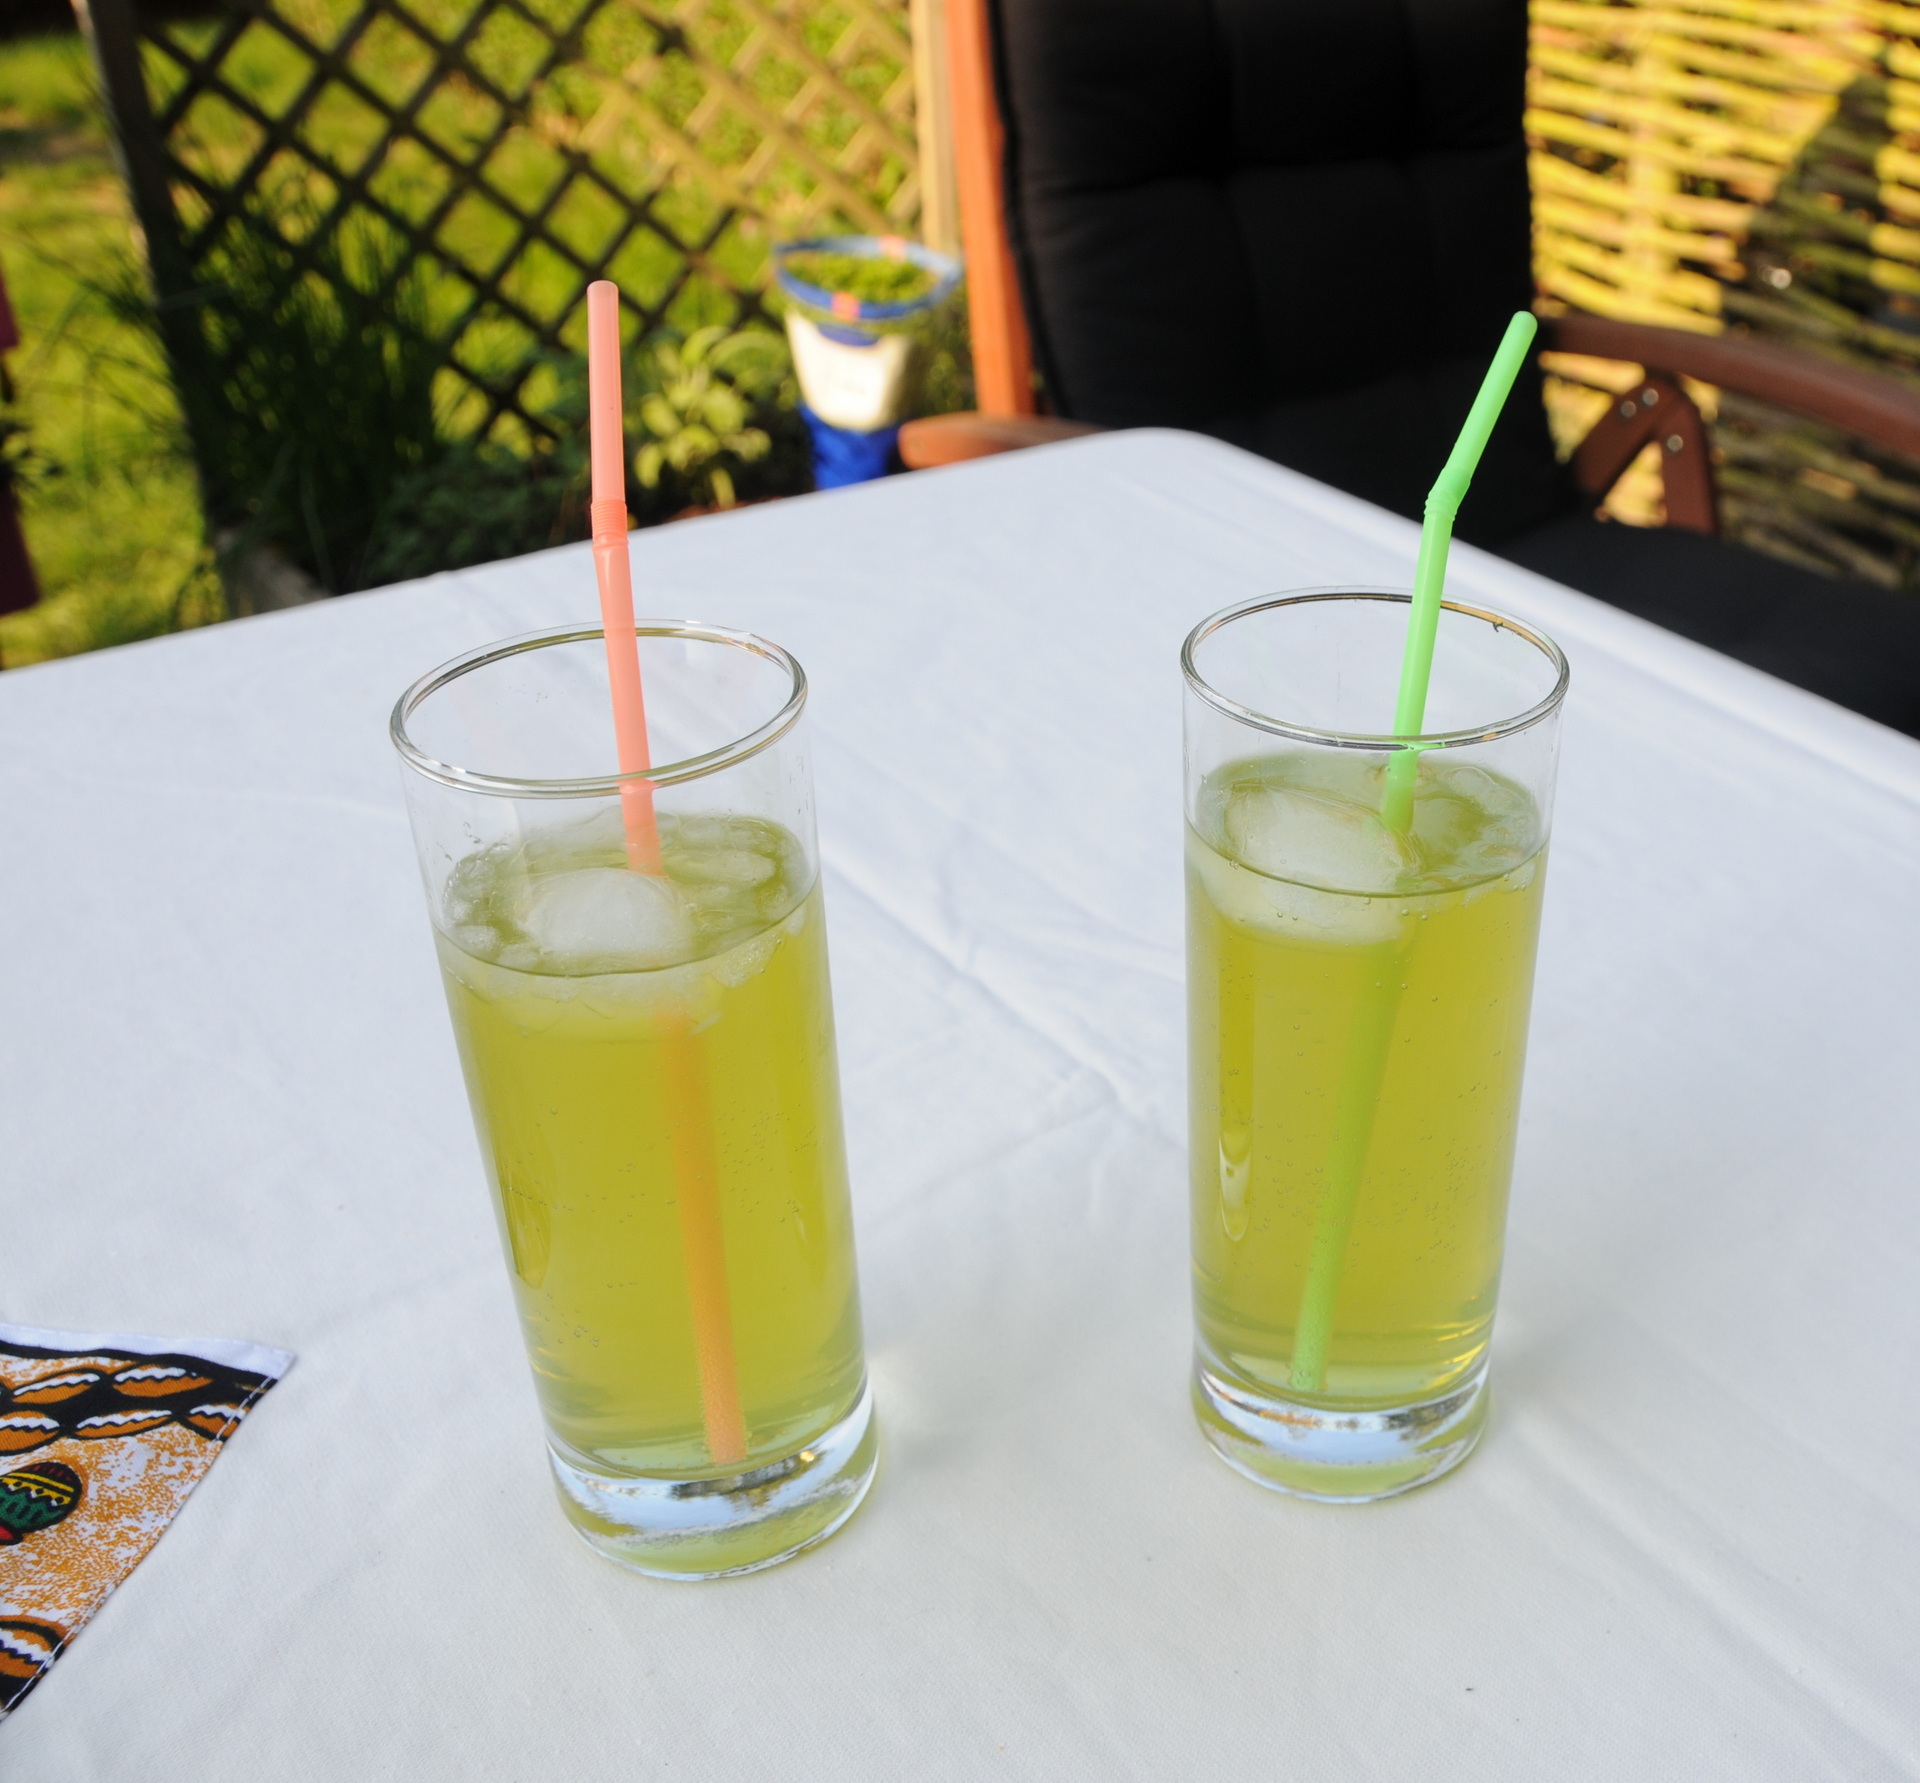
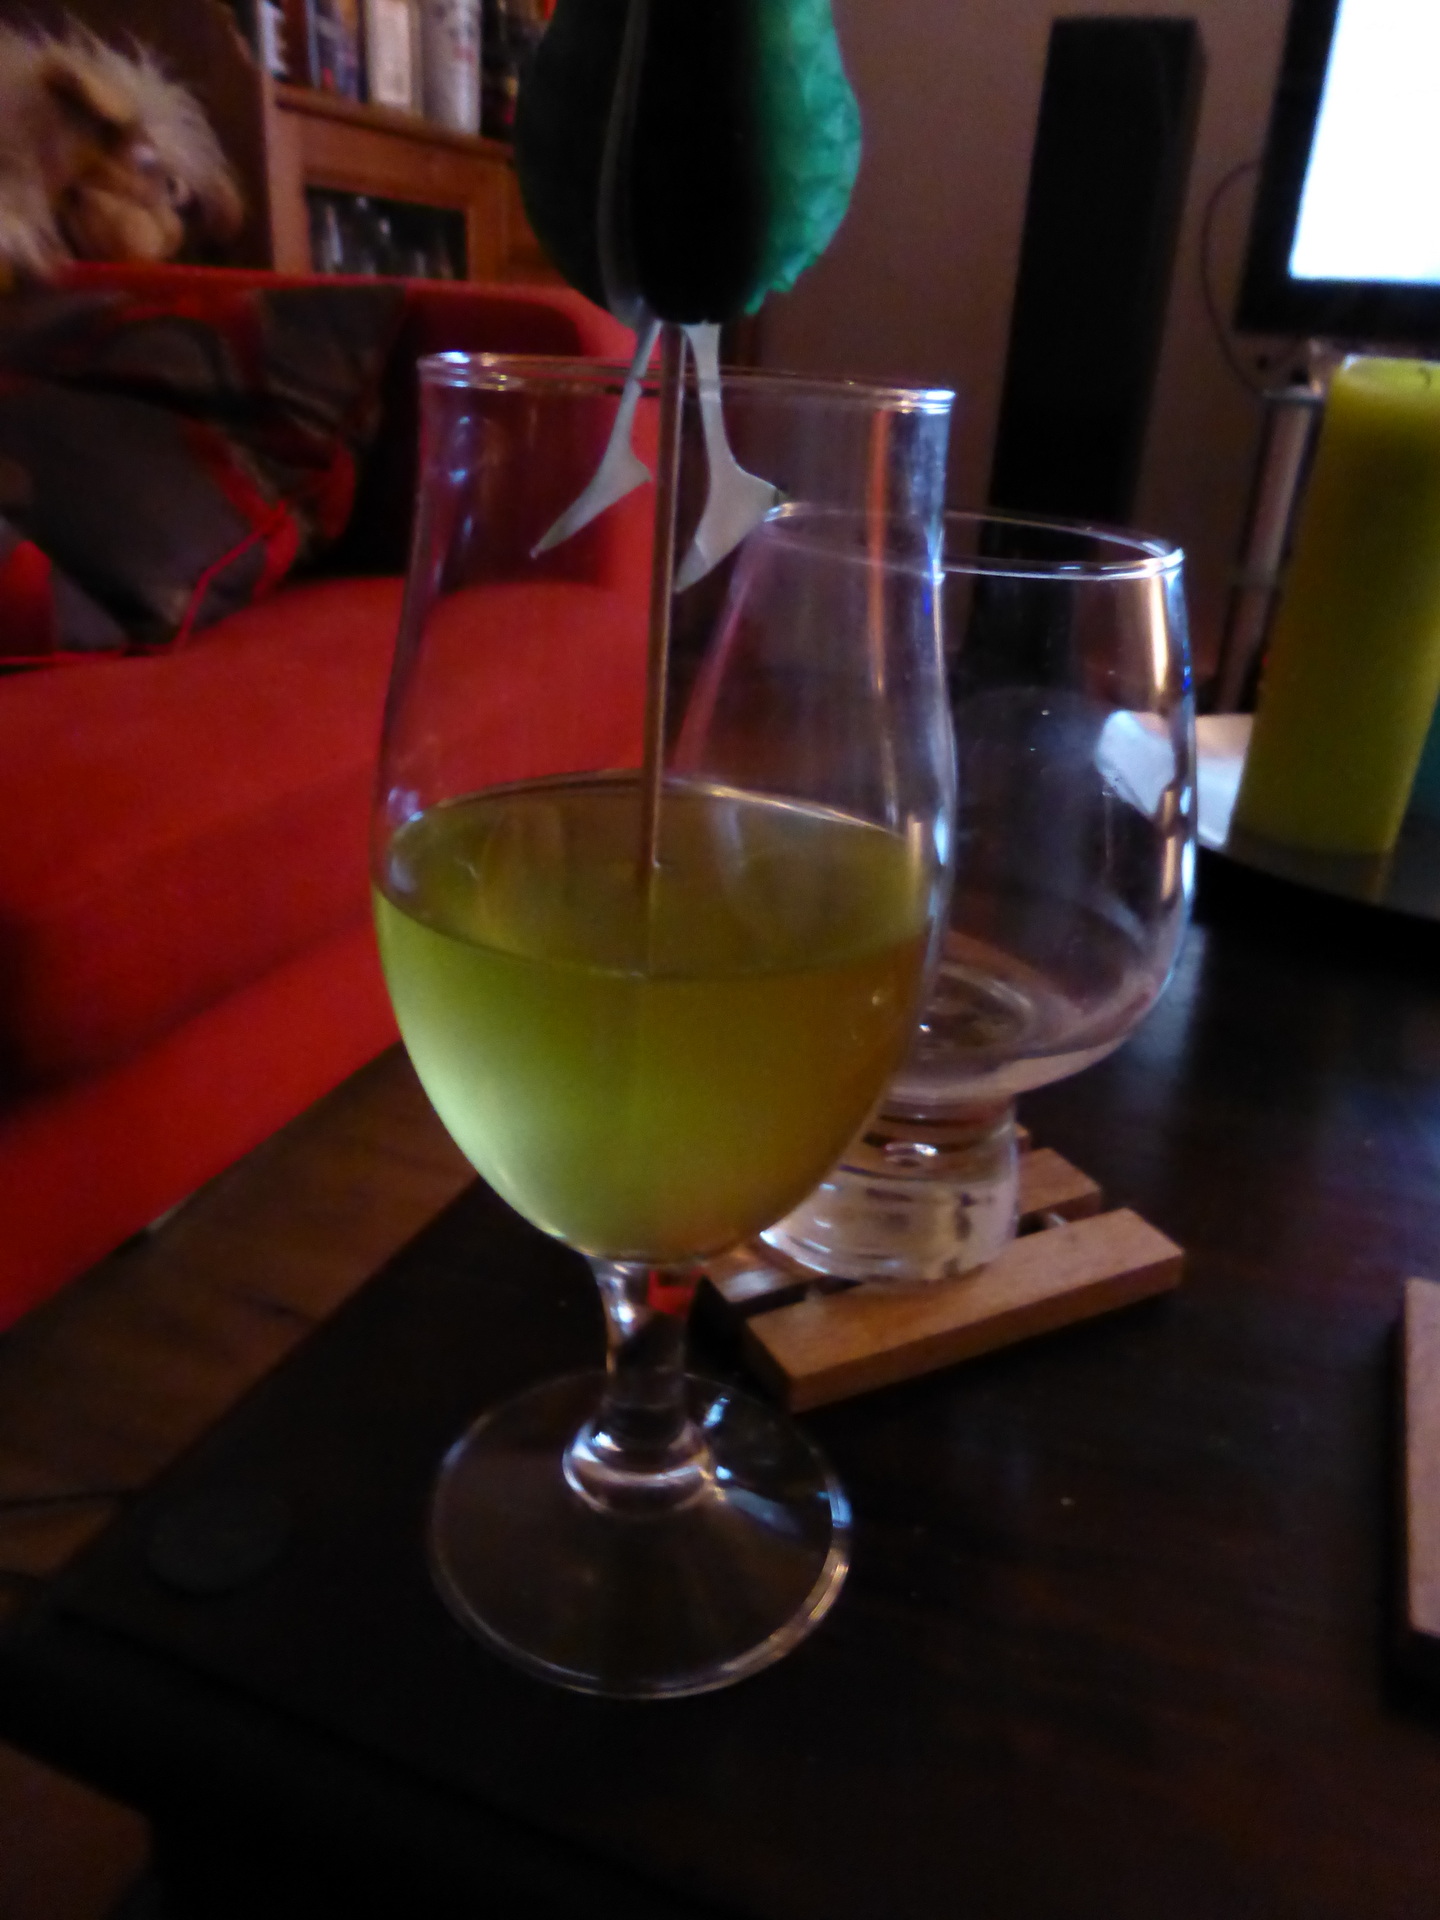
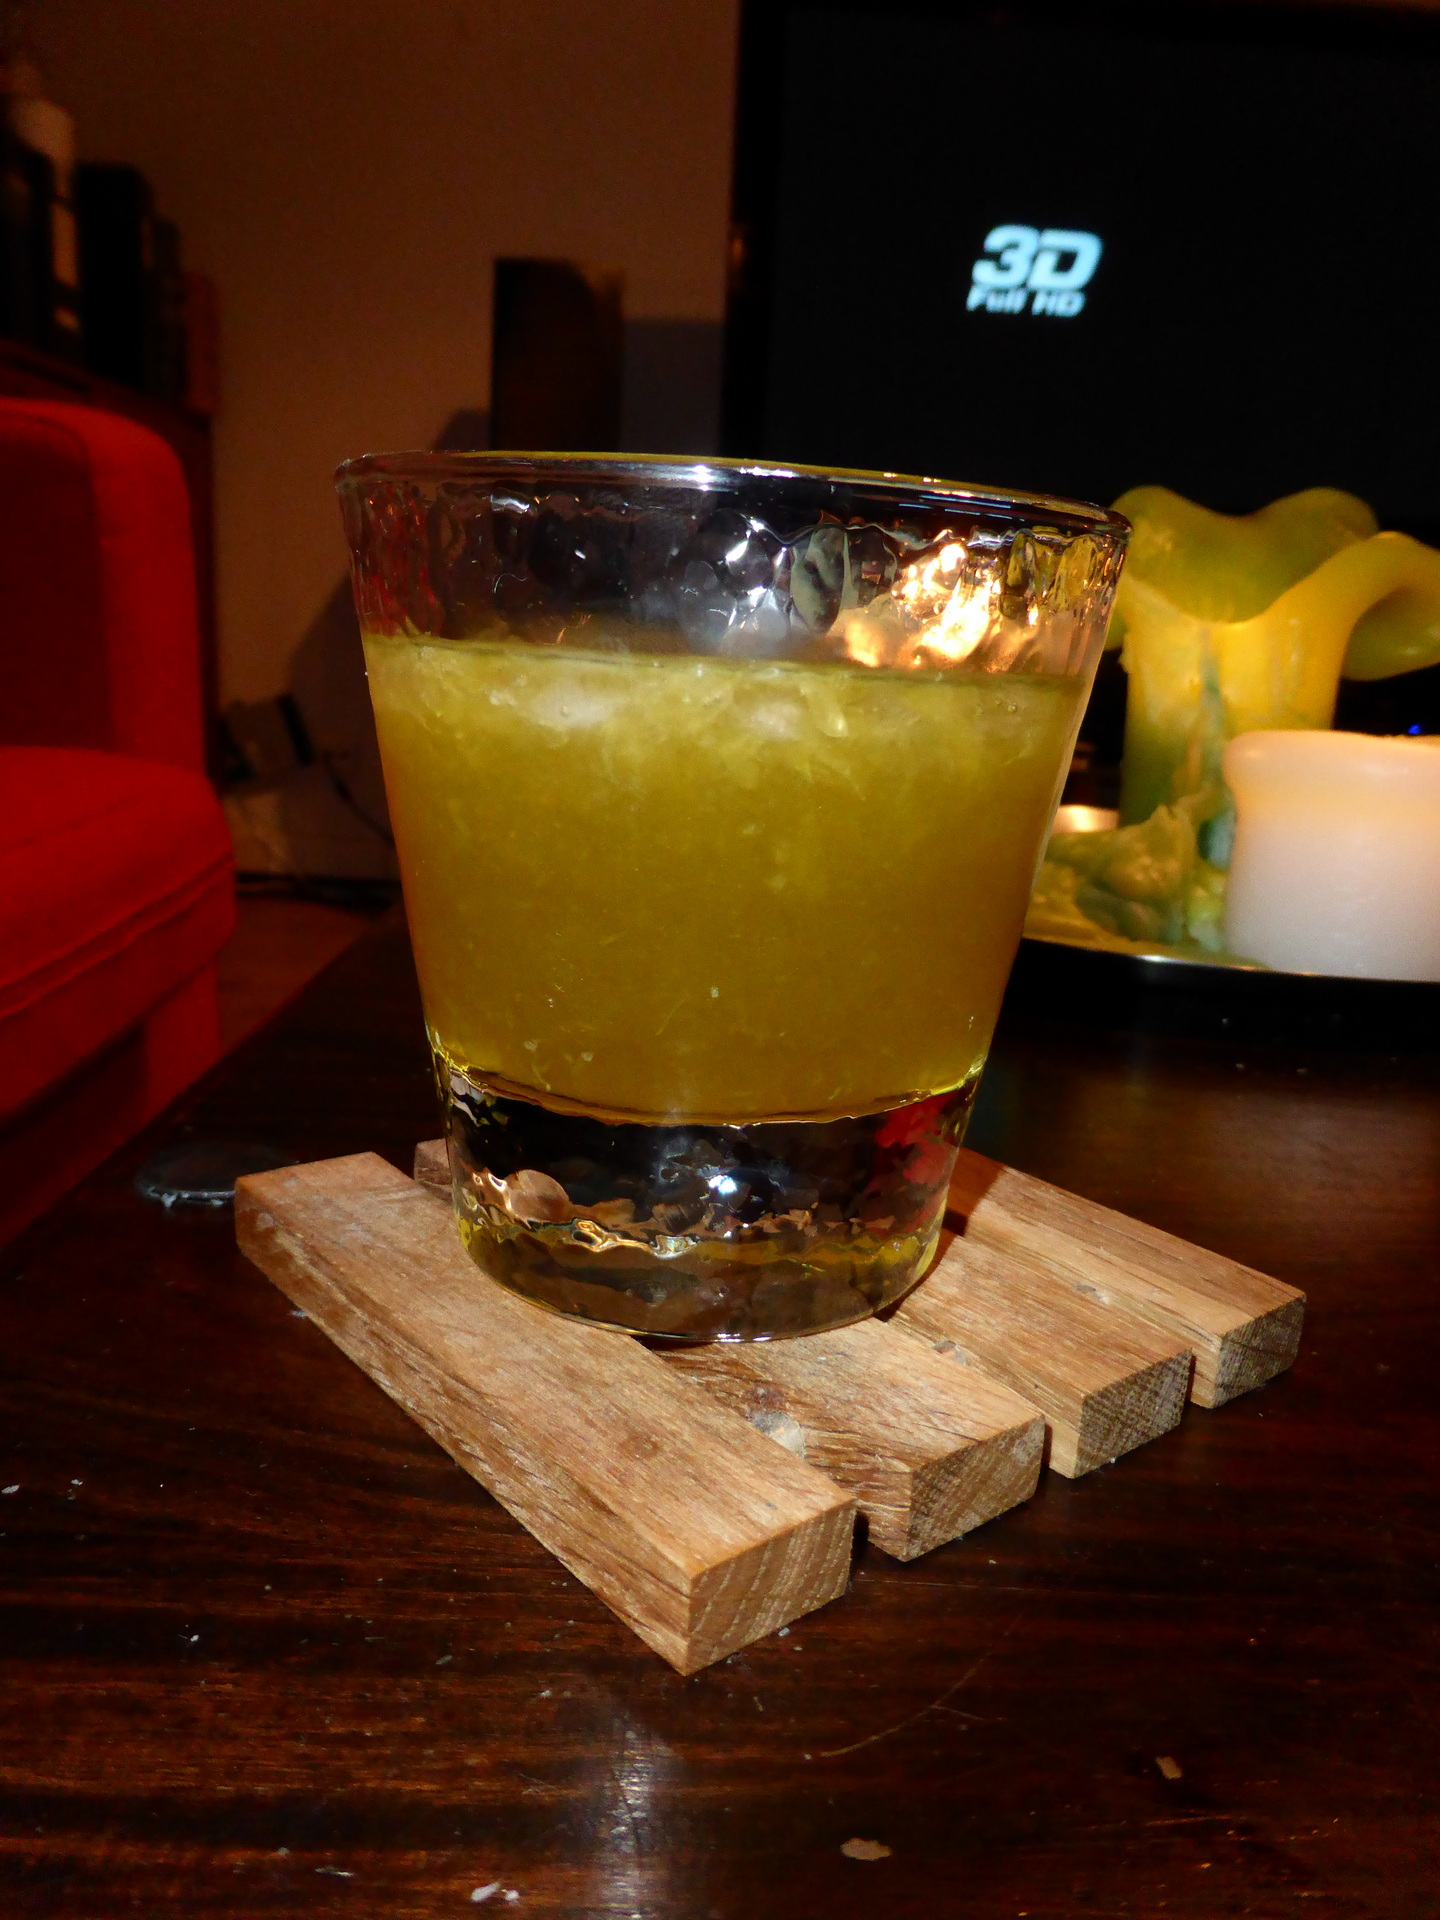
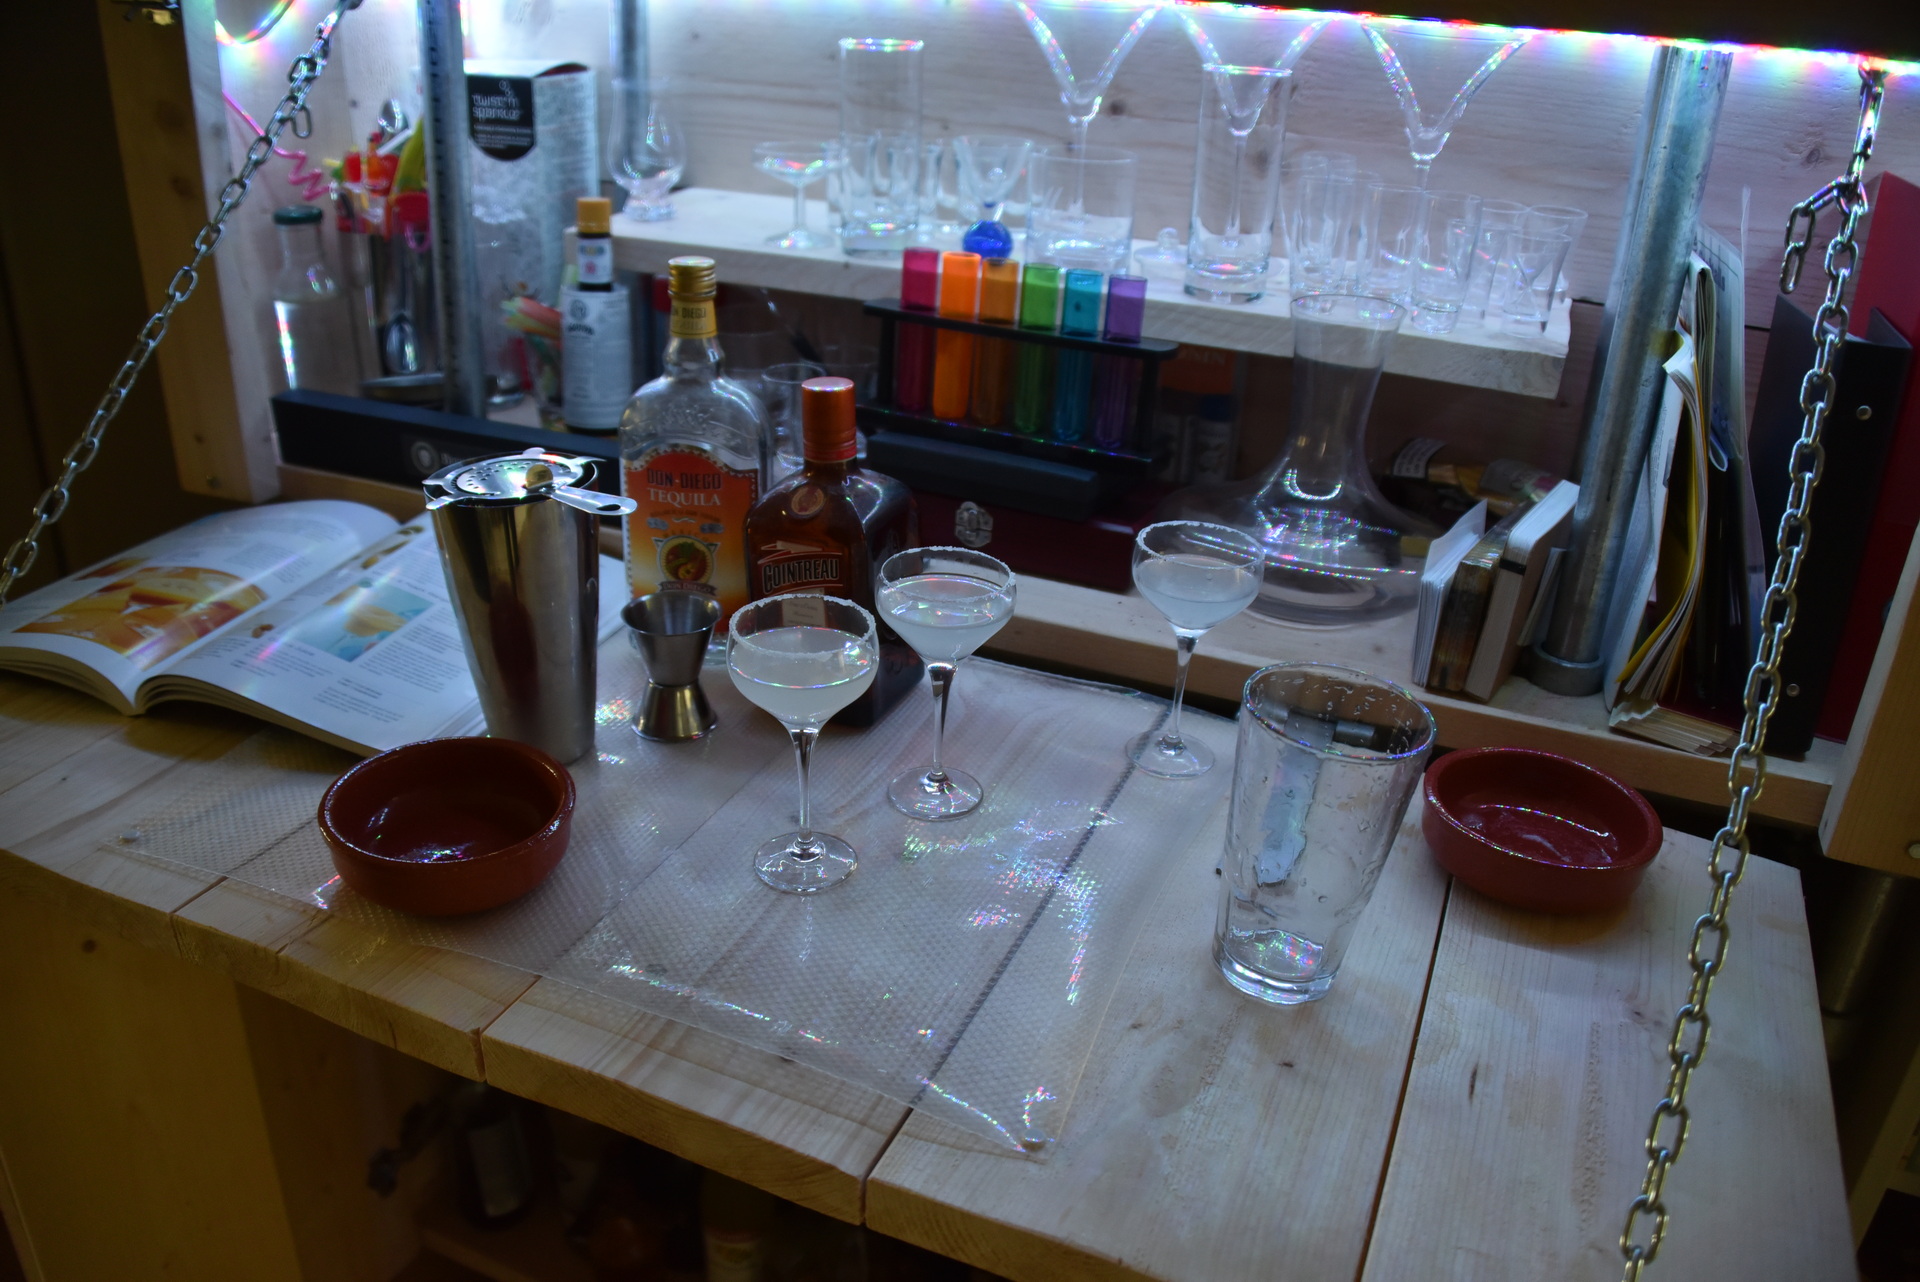
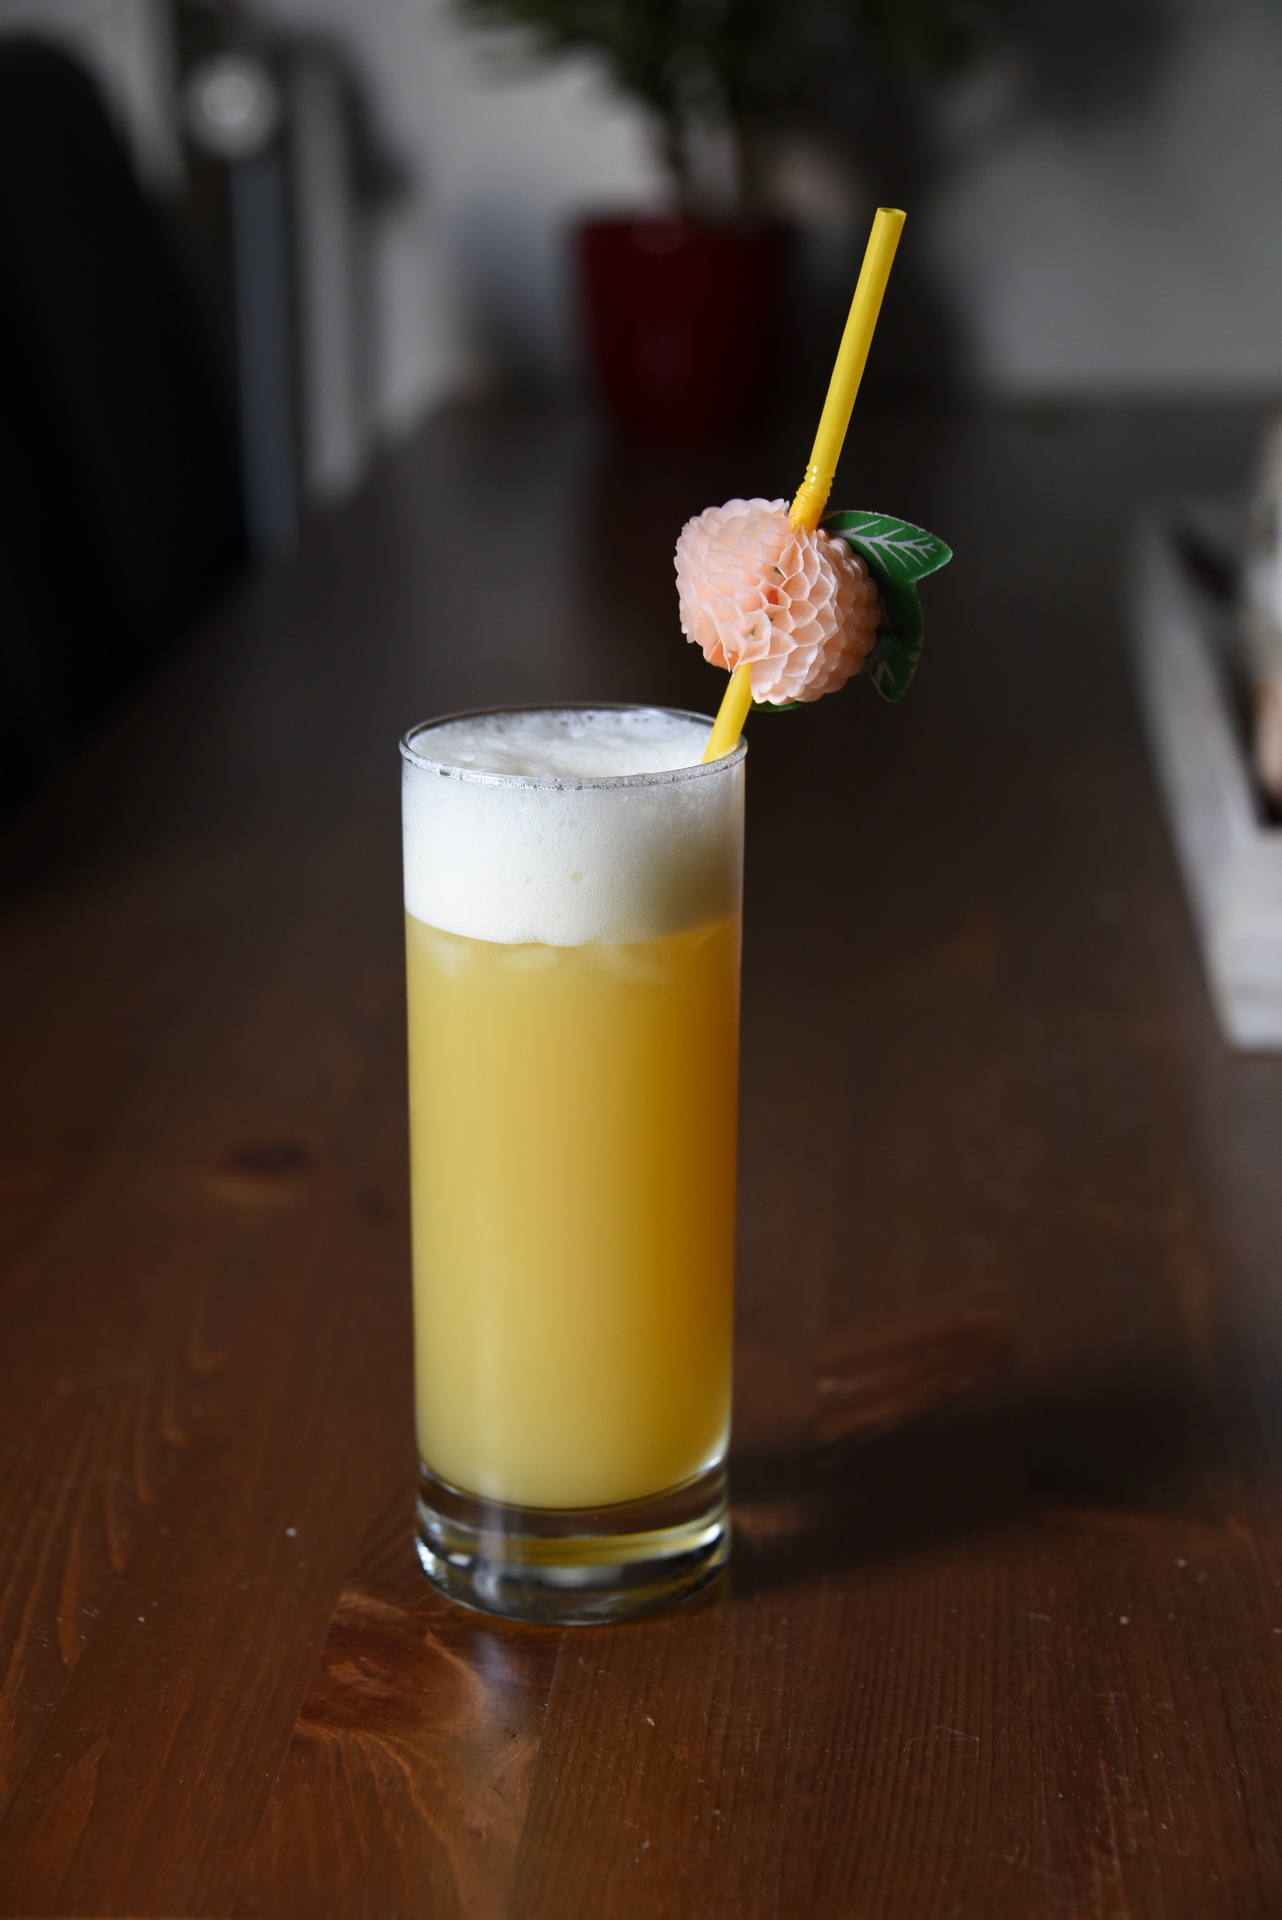
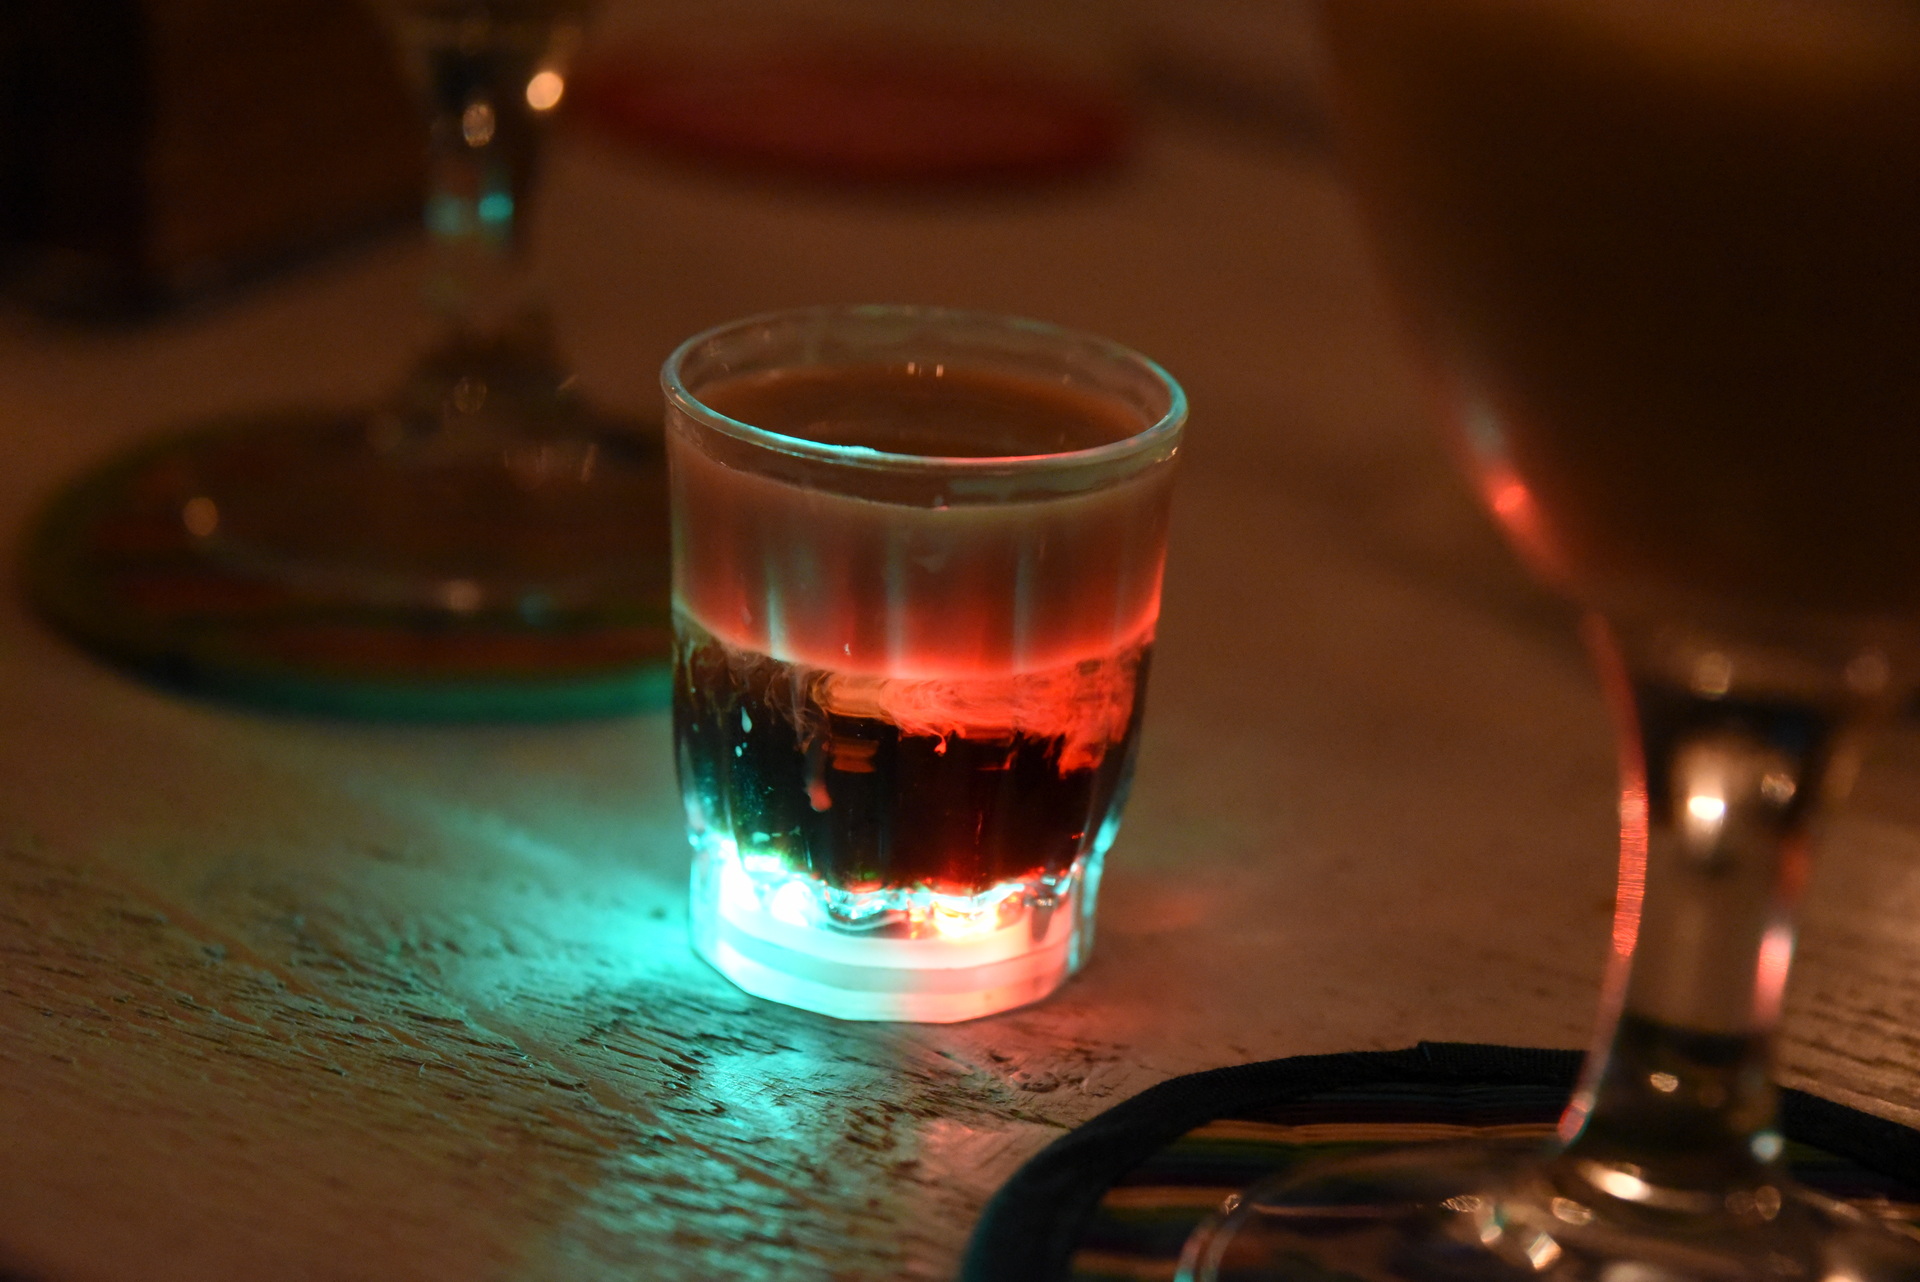
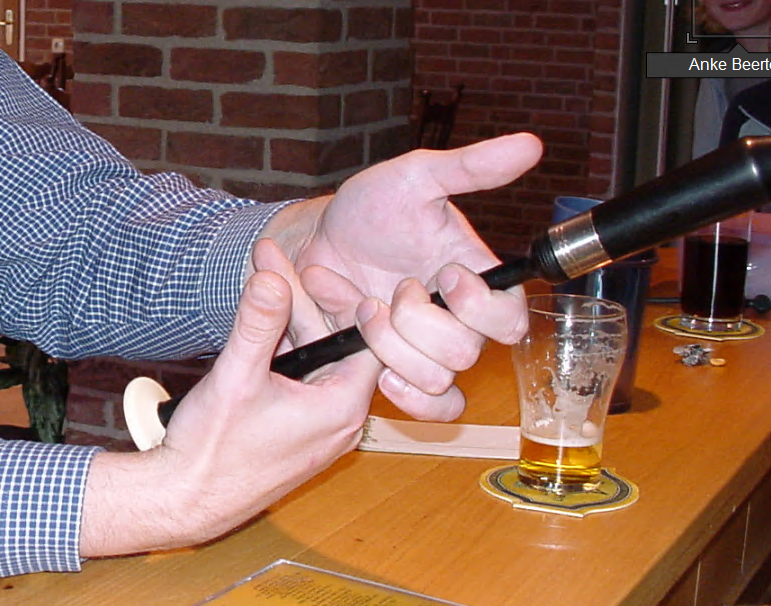
Some pictures of the drinks i’ve made, in the last years.
Most are in my notebook, i can perfect the drink now individually for a person.
I really have to put the names of the drinks on this page. (And the tasting notes!)
Nice effect with a lightUsing flower holders to present drinksMy little book of drinksOur favorite .. a Satan drink with doritosQueens day .. could not get the red on top due to the gravity of the drinksPart of my new barLights!
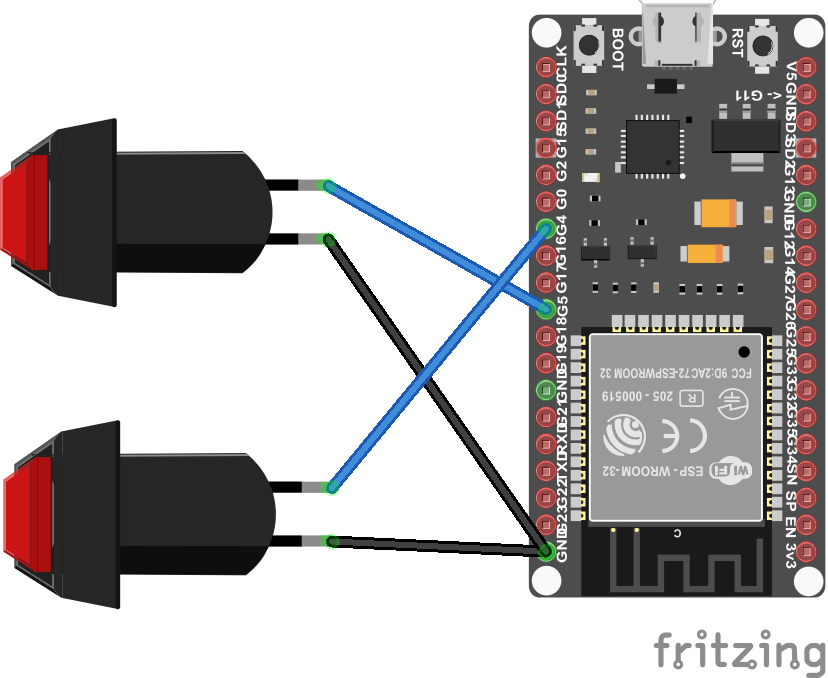
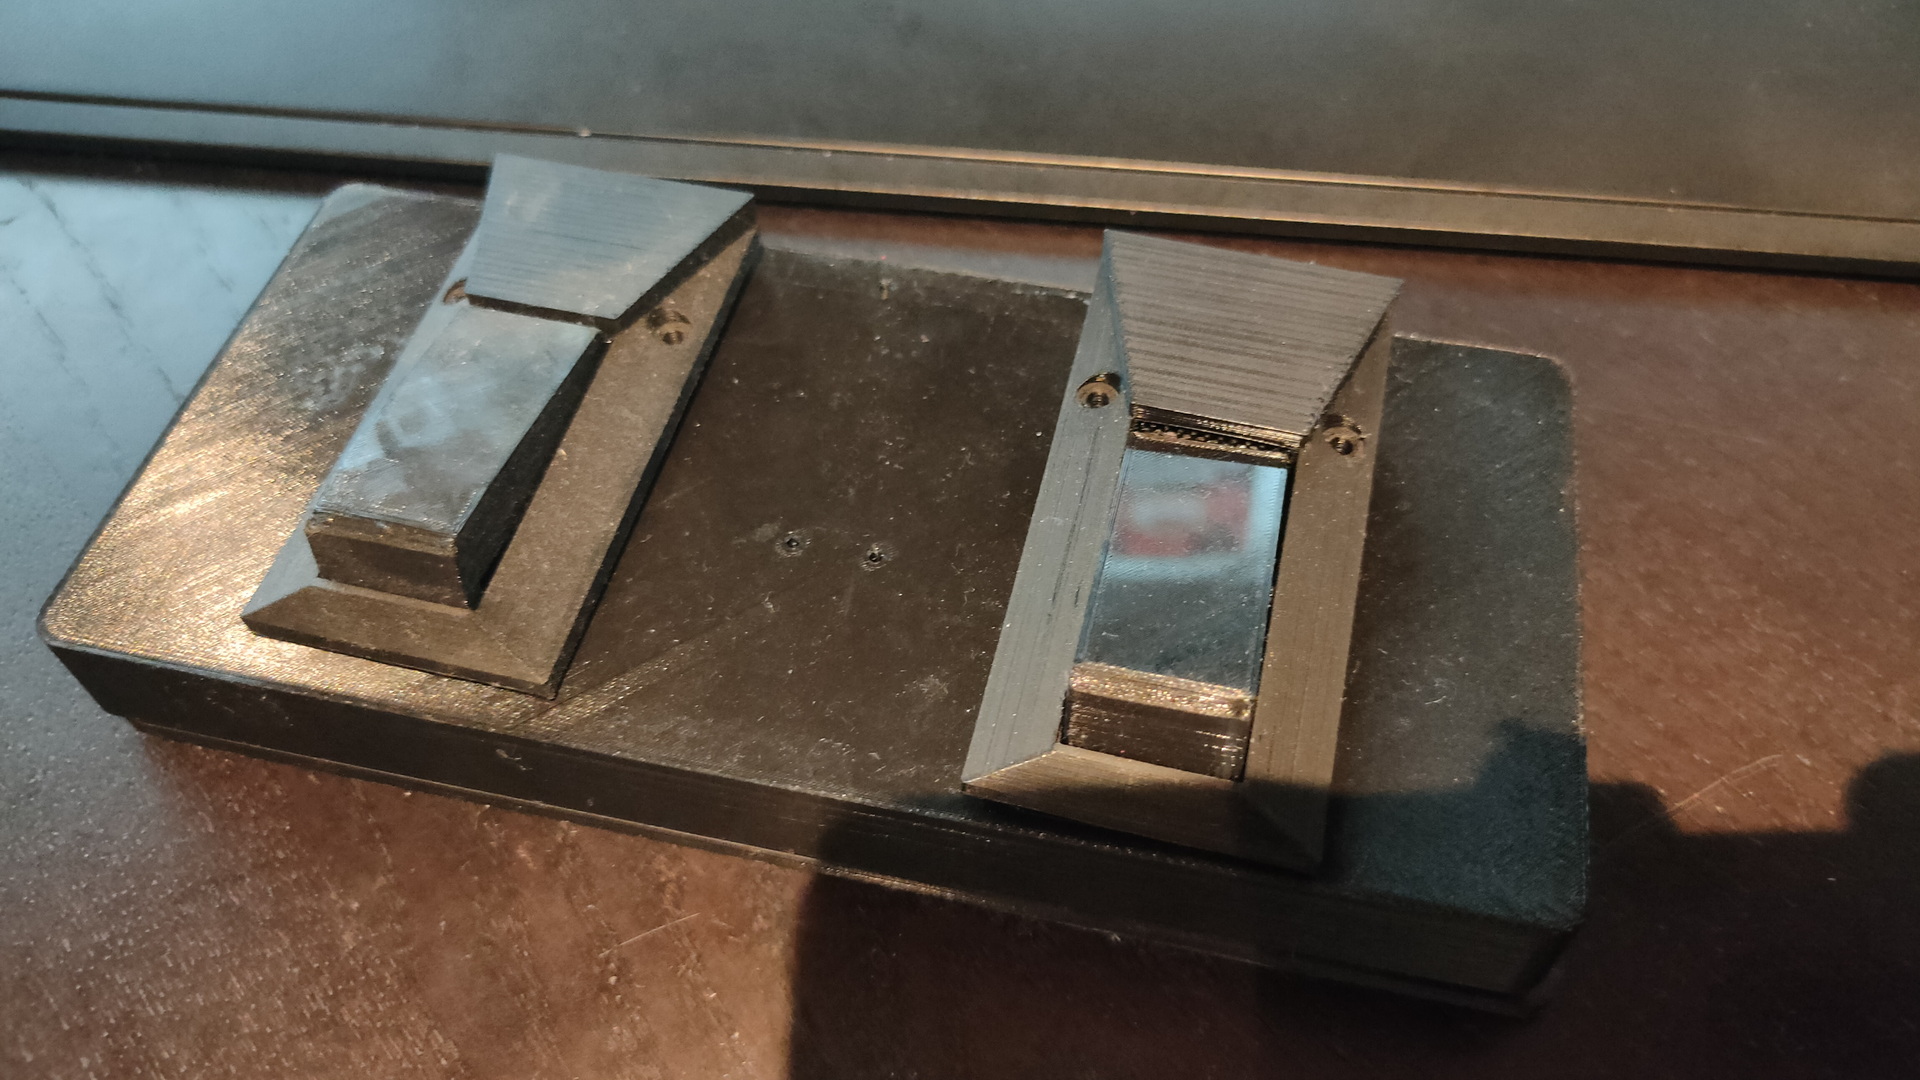
This was made using an Arduino and some buttons. I’m using Fbreader and Ebookdroid on the tablet.
Code:
Note: Volume buttons work for both apps, if you want to use other keys, you need to put a keymap.xml file in your fbreader books directory on your android device to remap those!
I want to know whats on my network, and be informed when a alien device connects. This also helps me gathering all devices and macaddresses for a cmdb.
I’ve got below in my crontab
5 * * * * root /usr/local/bin/arpscanner
And the script:
#!/bin/bash
# Using a scanner on a specific vlan/interface
arp-scan -l -g  -I p1p1.10 | grep ^10 | grep -vi packets > /var/log/arpscanner
cat /var/log/arpscanner | awk '{ print $2 }'| while read ; do
grep $REPLY /var/local/arpscanner.lst >/dev/null || echo $REPLY | mail -s arpscanner henri@henriaanstoot.nl
done
New and checked devices i put in the file mentioned above: /var/local/arpscanner.lst
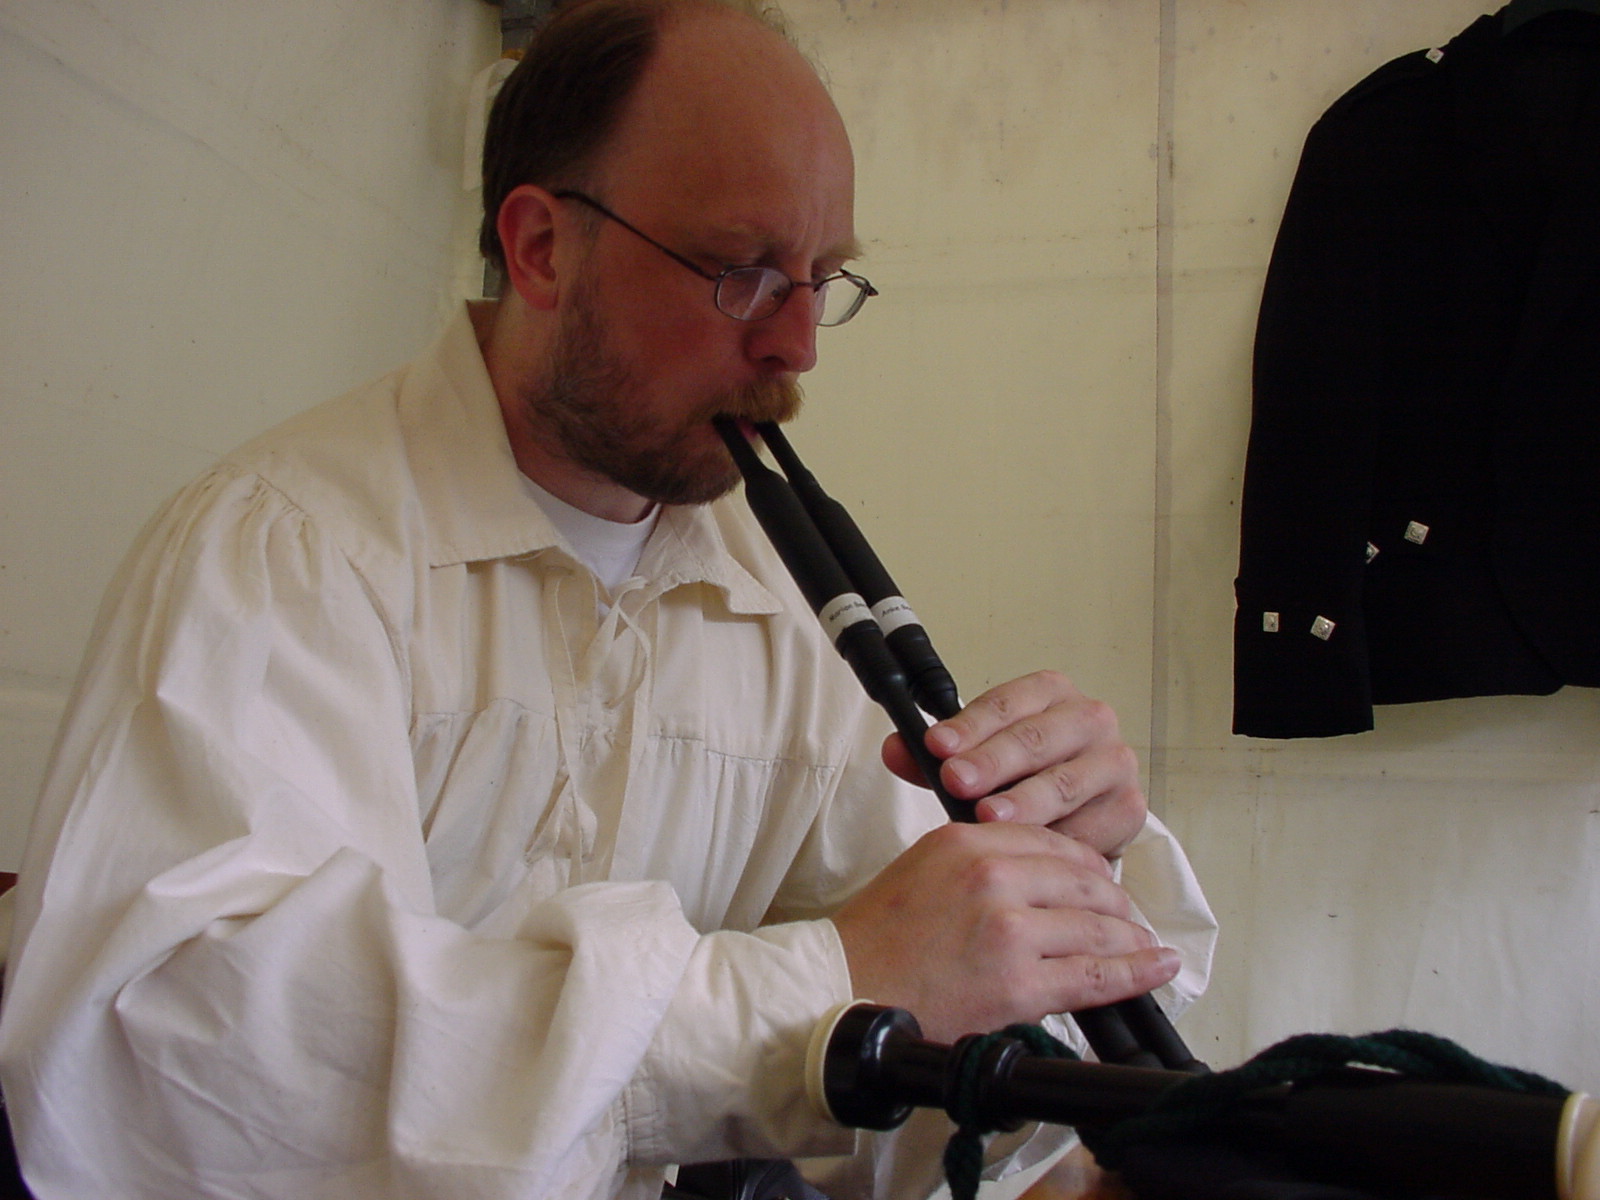
I think it was Burns Night 2005. We took one pipebag, took the drones out. And added one blowpipe and three chanters. We were struggling to play the damn beast with 4 people.
A picture should exist somewhere, add it when found.
Smallpipe adaptor for two chanters.
Xmas tree lights in the drones
I’ve seen some do this, but never with xmas balls also.
Playing the THX sound
Alternative playing
Above in the movie with two chanter you can see tape. You can tape other notes, for accidentals.
I’ve started a set with our folkband with my hands reversed. (Left on the bottom part of the chanter, right hand toppart) After playing amazing grace, I switched hands every few bars.
Playing high A gracenote with tophand index finger.
Play a tune and slide bottomhand over your top hand down.
Tape or block the bottom sound holes.
A old old movie (2005?), when we lift our knees we close the bottom sound hole on the side of the chanter.
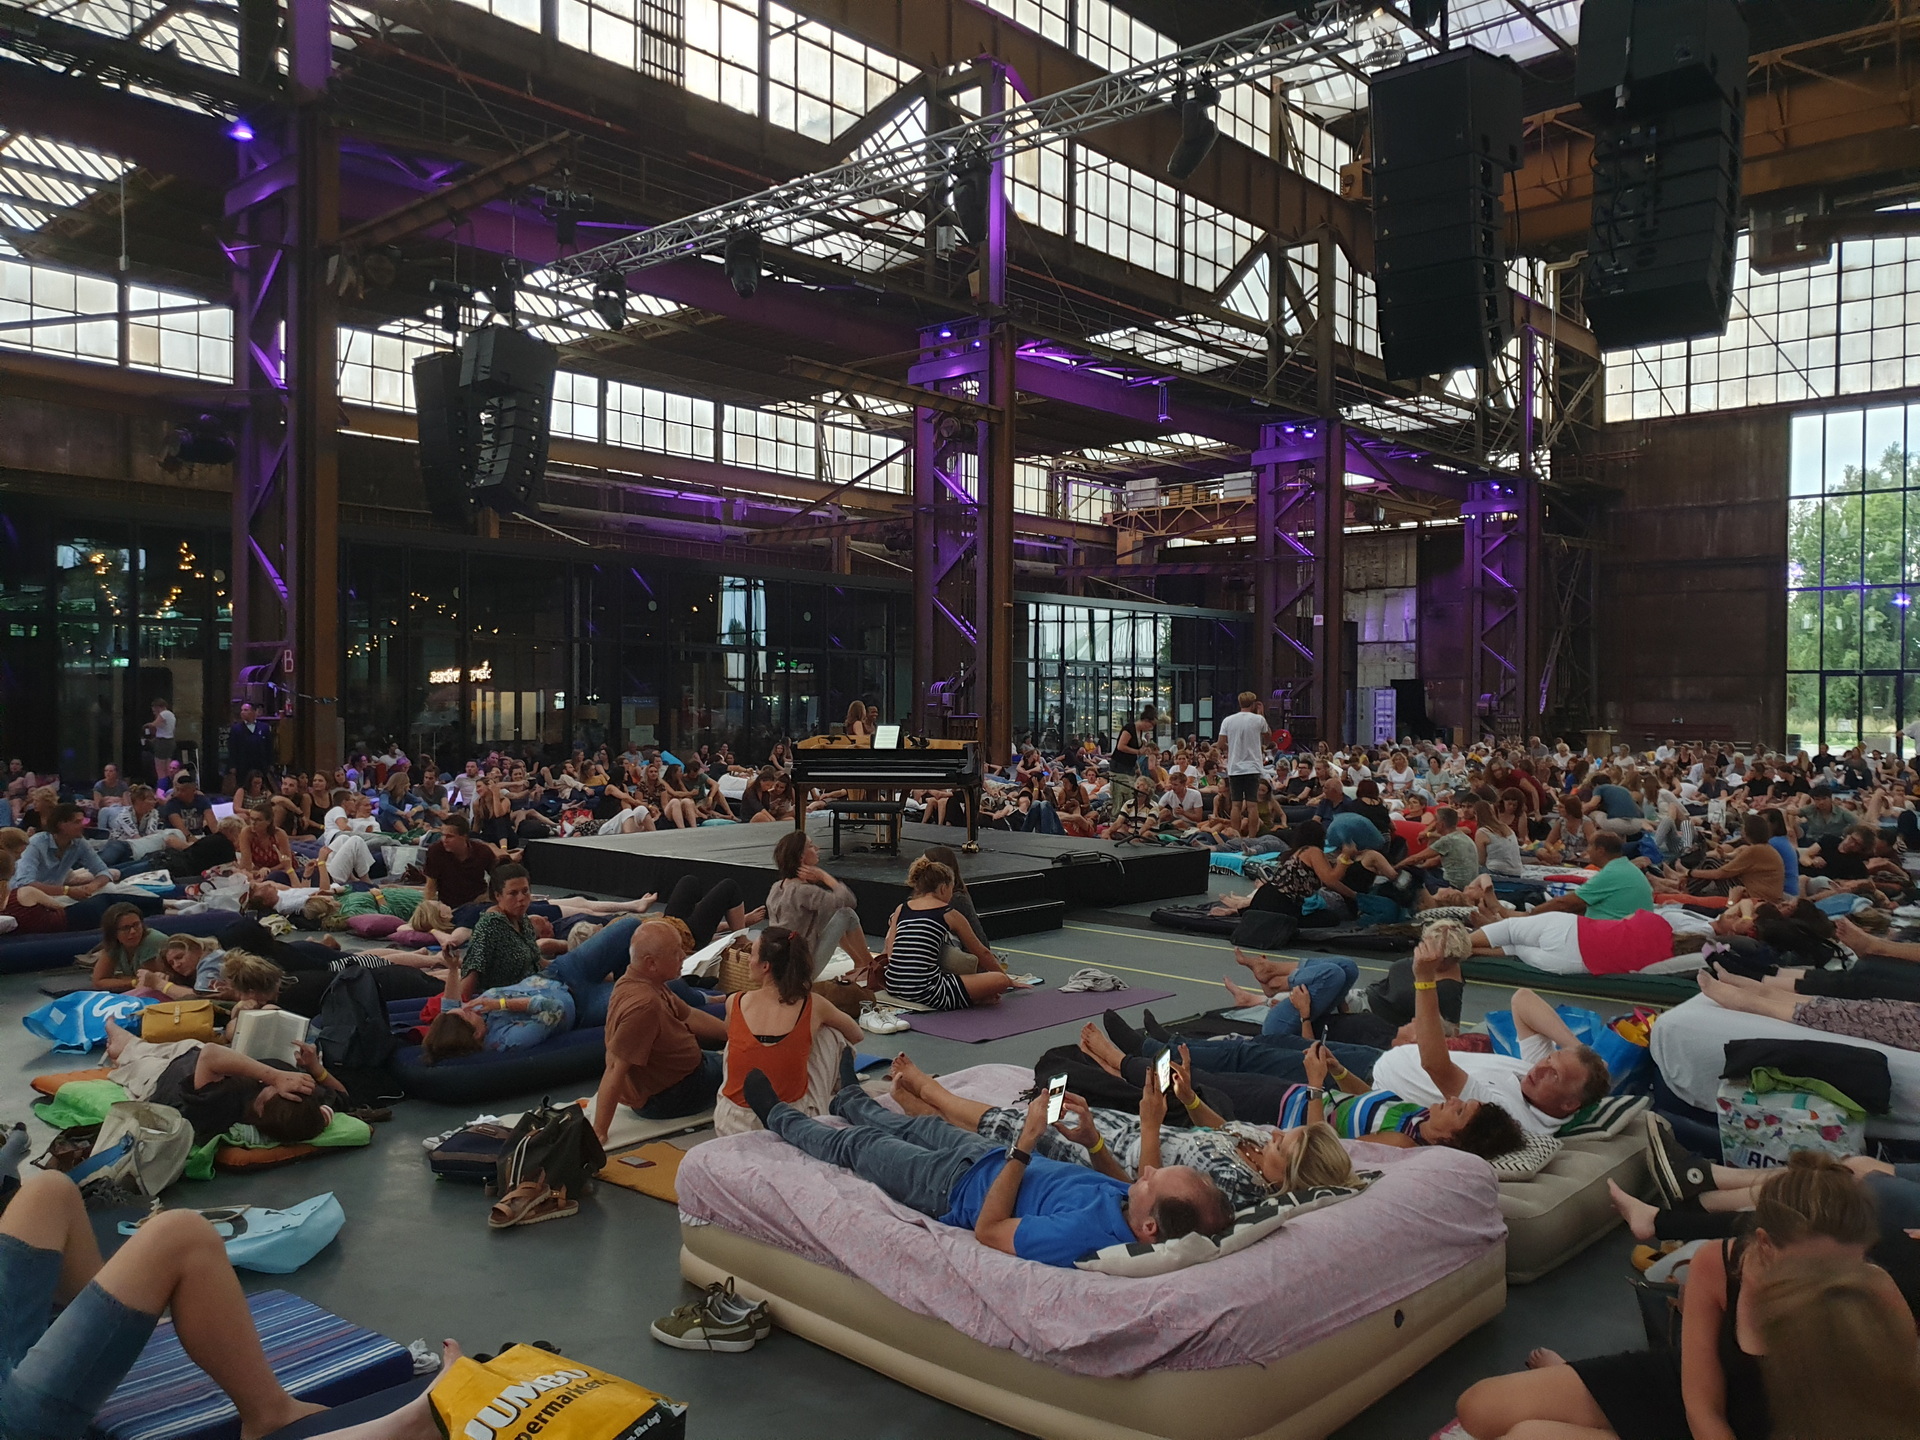
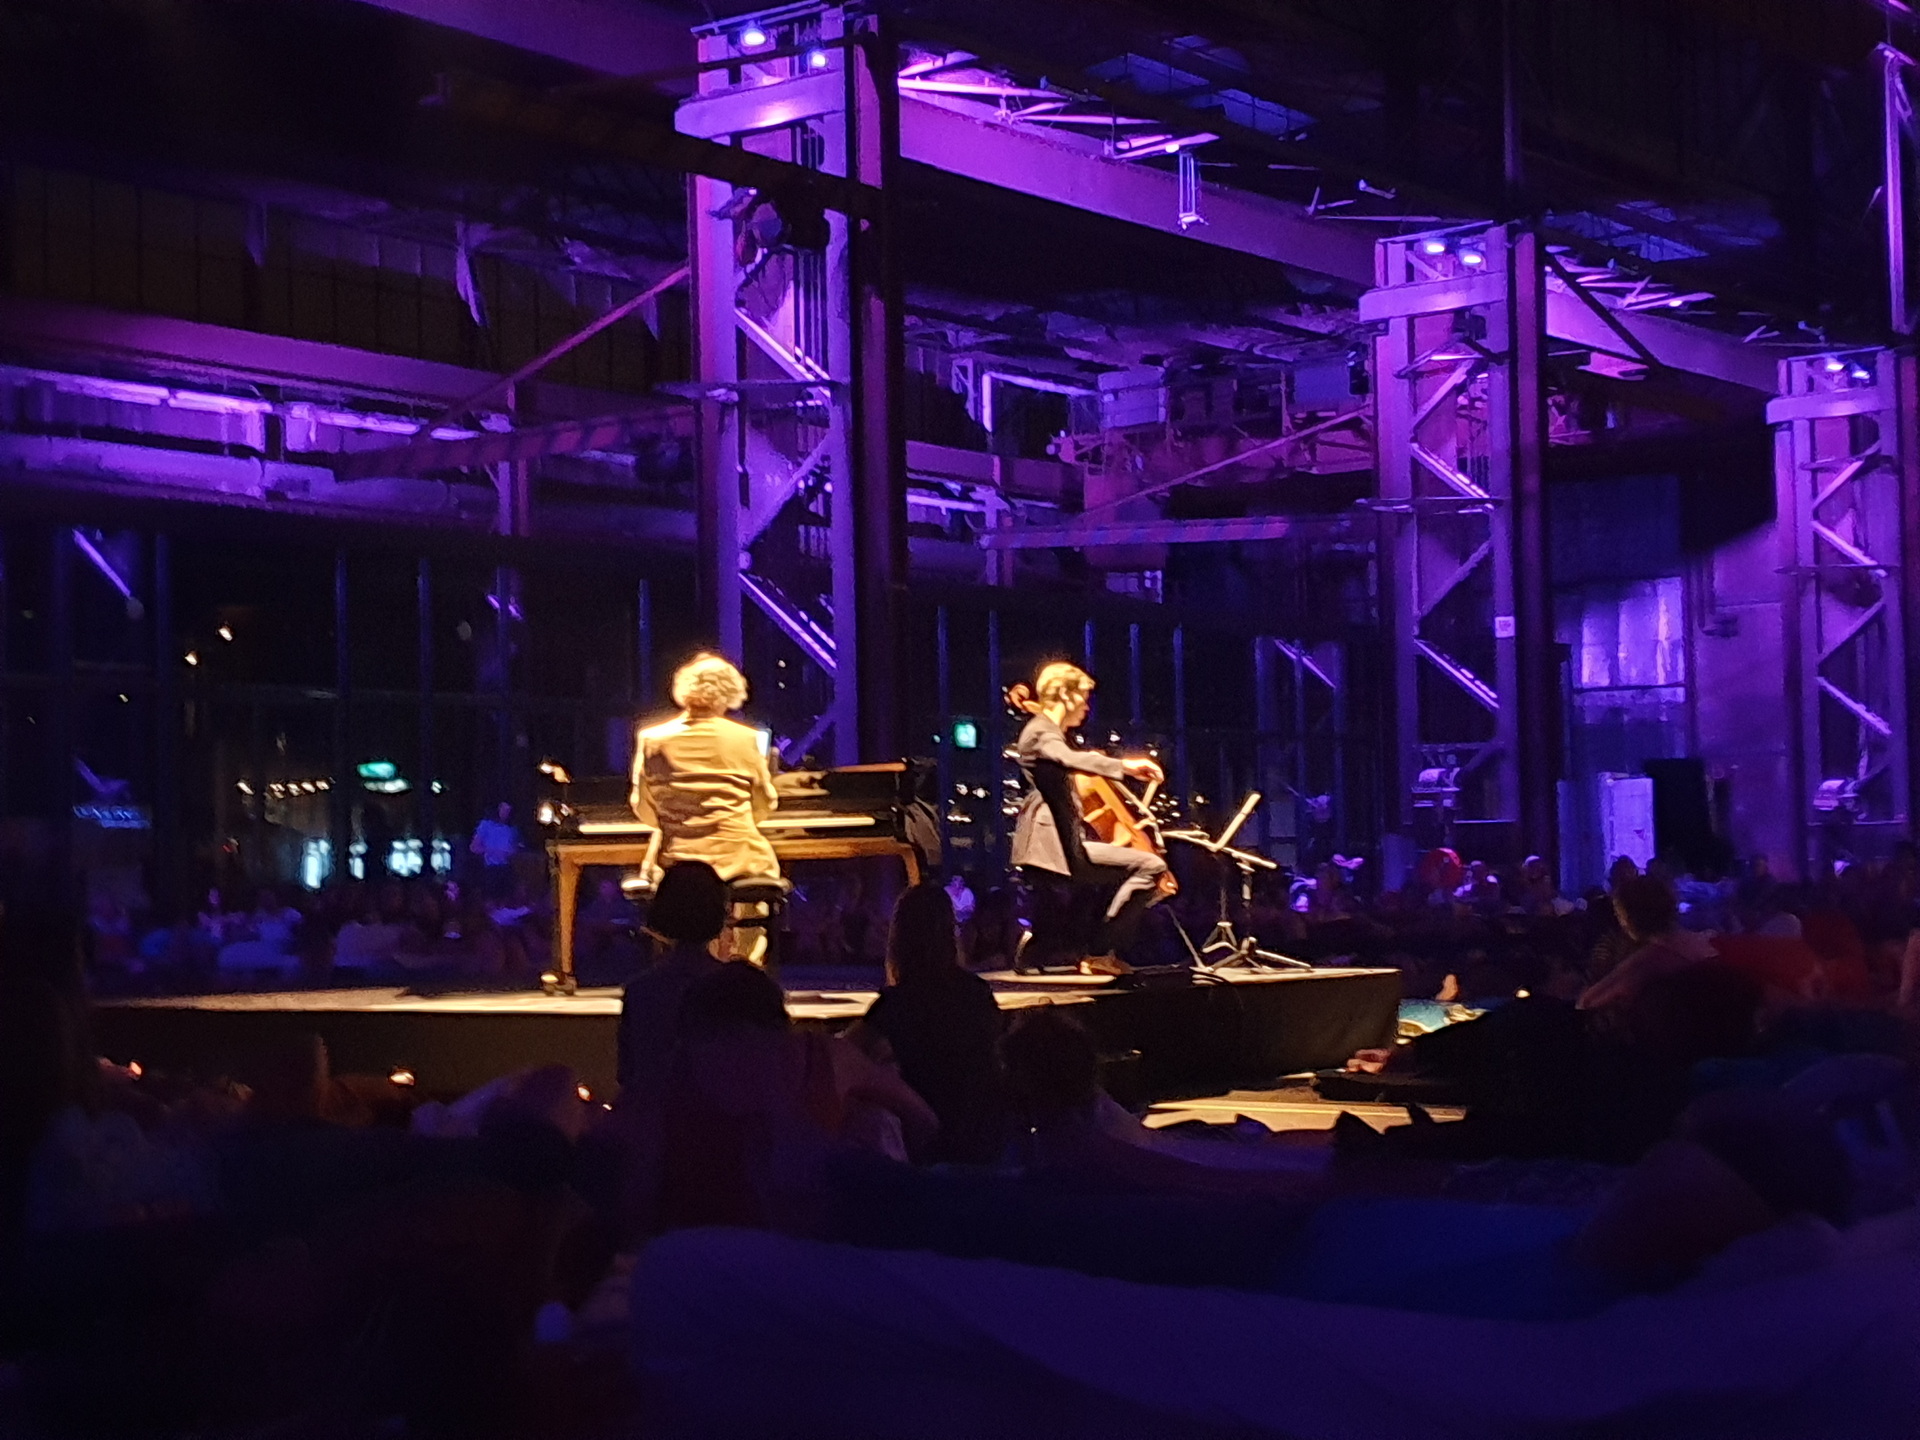
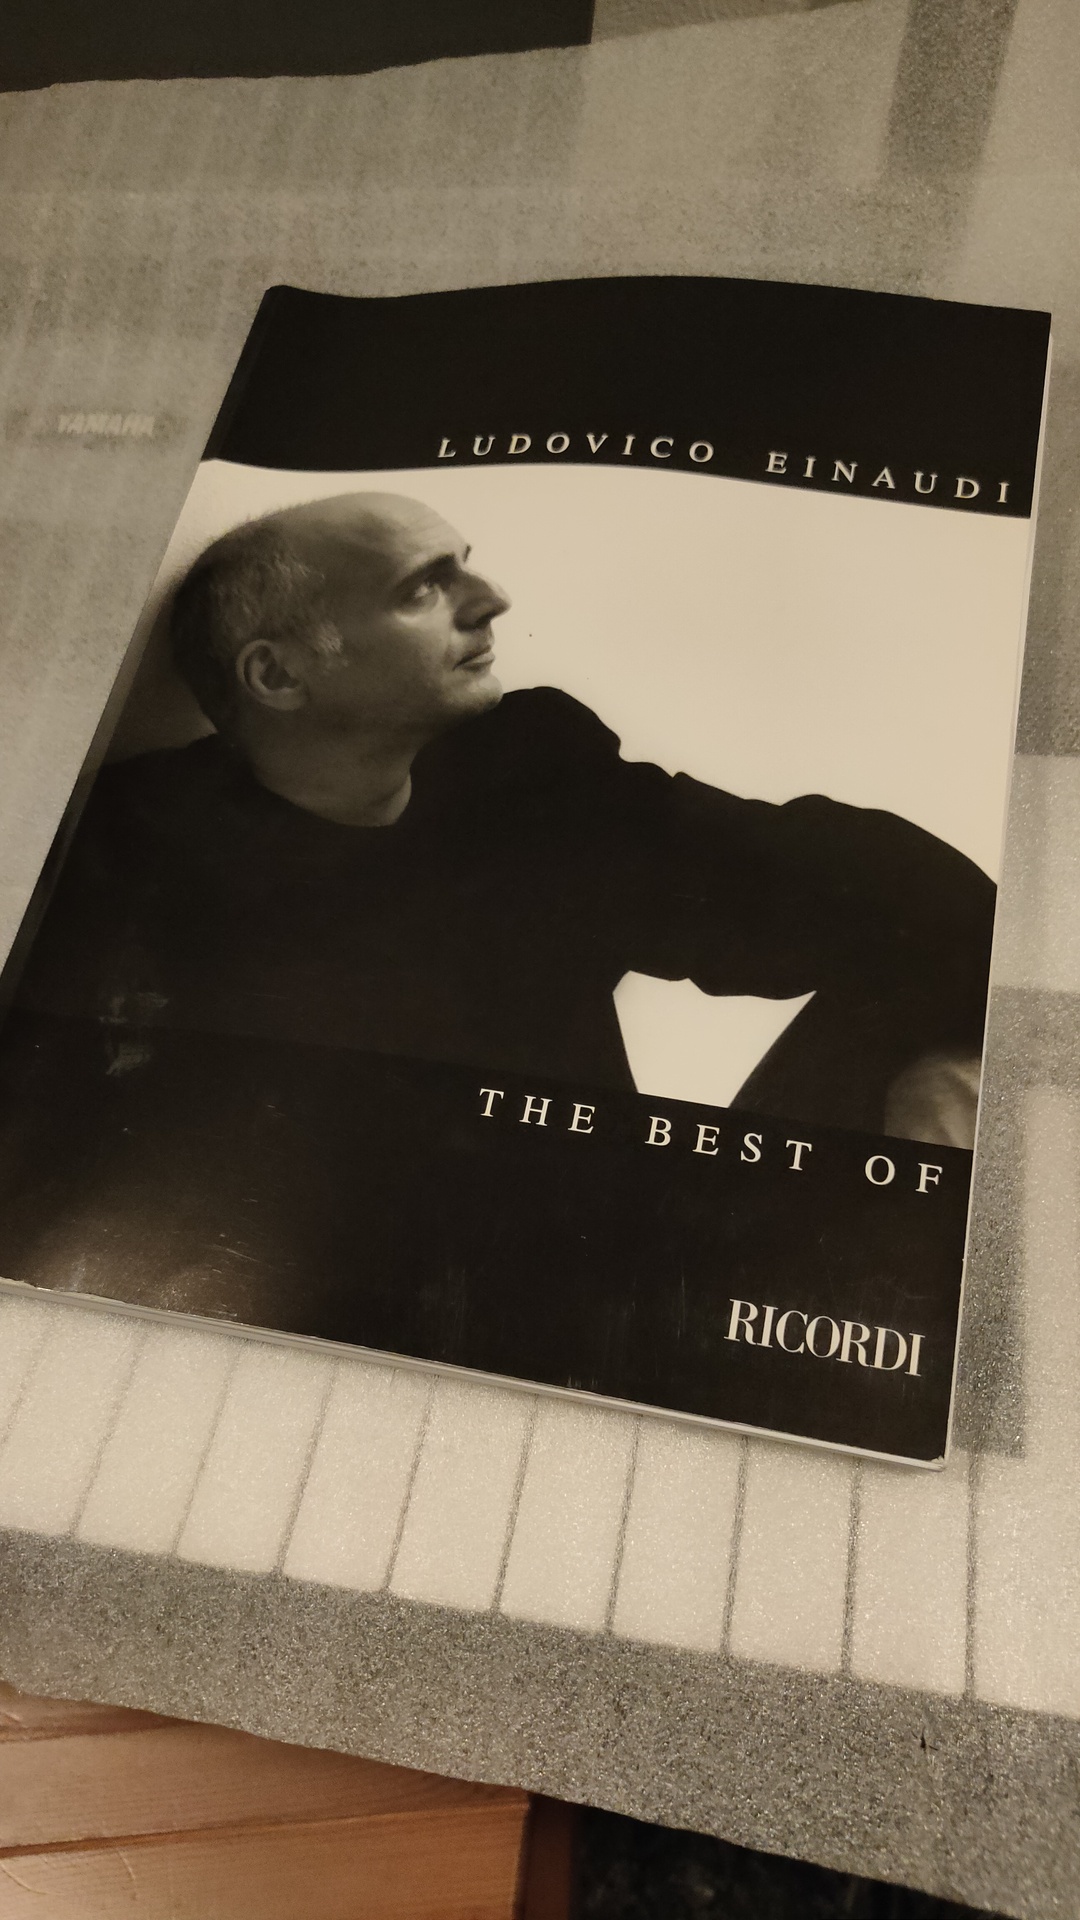
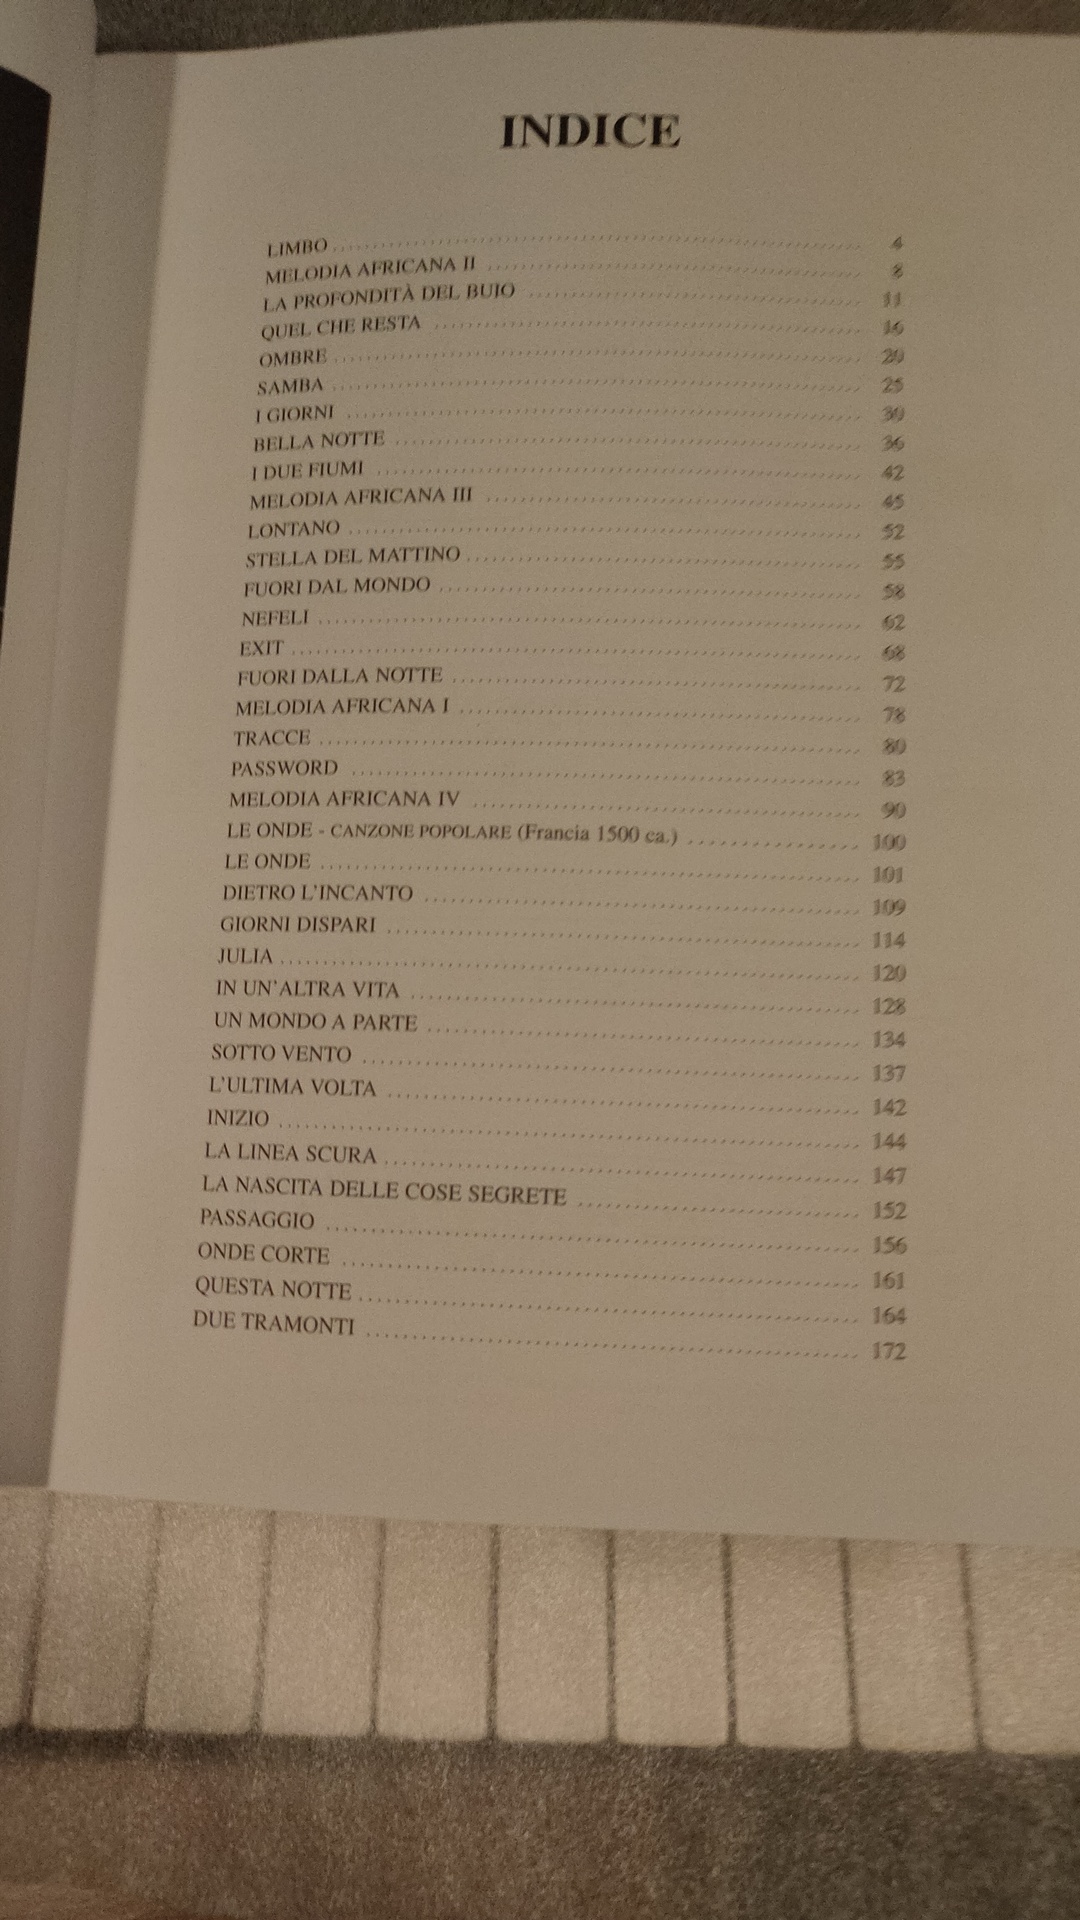
Music by Ludovico Einaudi, pianist Jeroen van Veen. And you could lie down in the big “Werkspoorkathedraal” in Utrecht.
Ludovico Maria Enrico Einaudi (Italian: born 23 November 1955) is an Italian pianist and composer. Trained at the Conservatorio Verdi in Milan, Einaudi began his career as a classical composer, later incorporating other styles and genres such as pop, rock, folk, and world music.
Einaudi has composed the scores for a number of films and television productions, including This Is England, The Intouchables, I’m Still Here, the TV miniseries Doctor Zhivago, and Acquario (1996), Nomadland and The Father.
He has also released a number of solo albums for piano and other instruments, notably I Giorni in 2001, Nightbook in 2009, and In a Time Lapse in 2013.
Coline plays some of Einaudi on keyboard, and we play I Giorni with our Folkband.
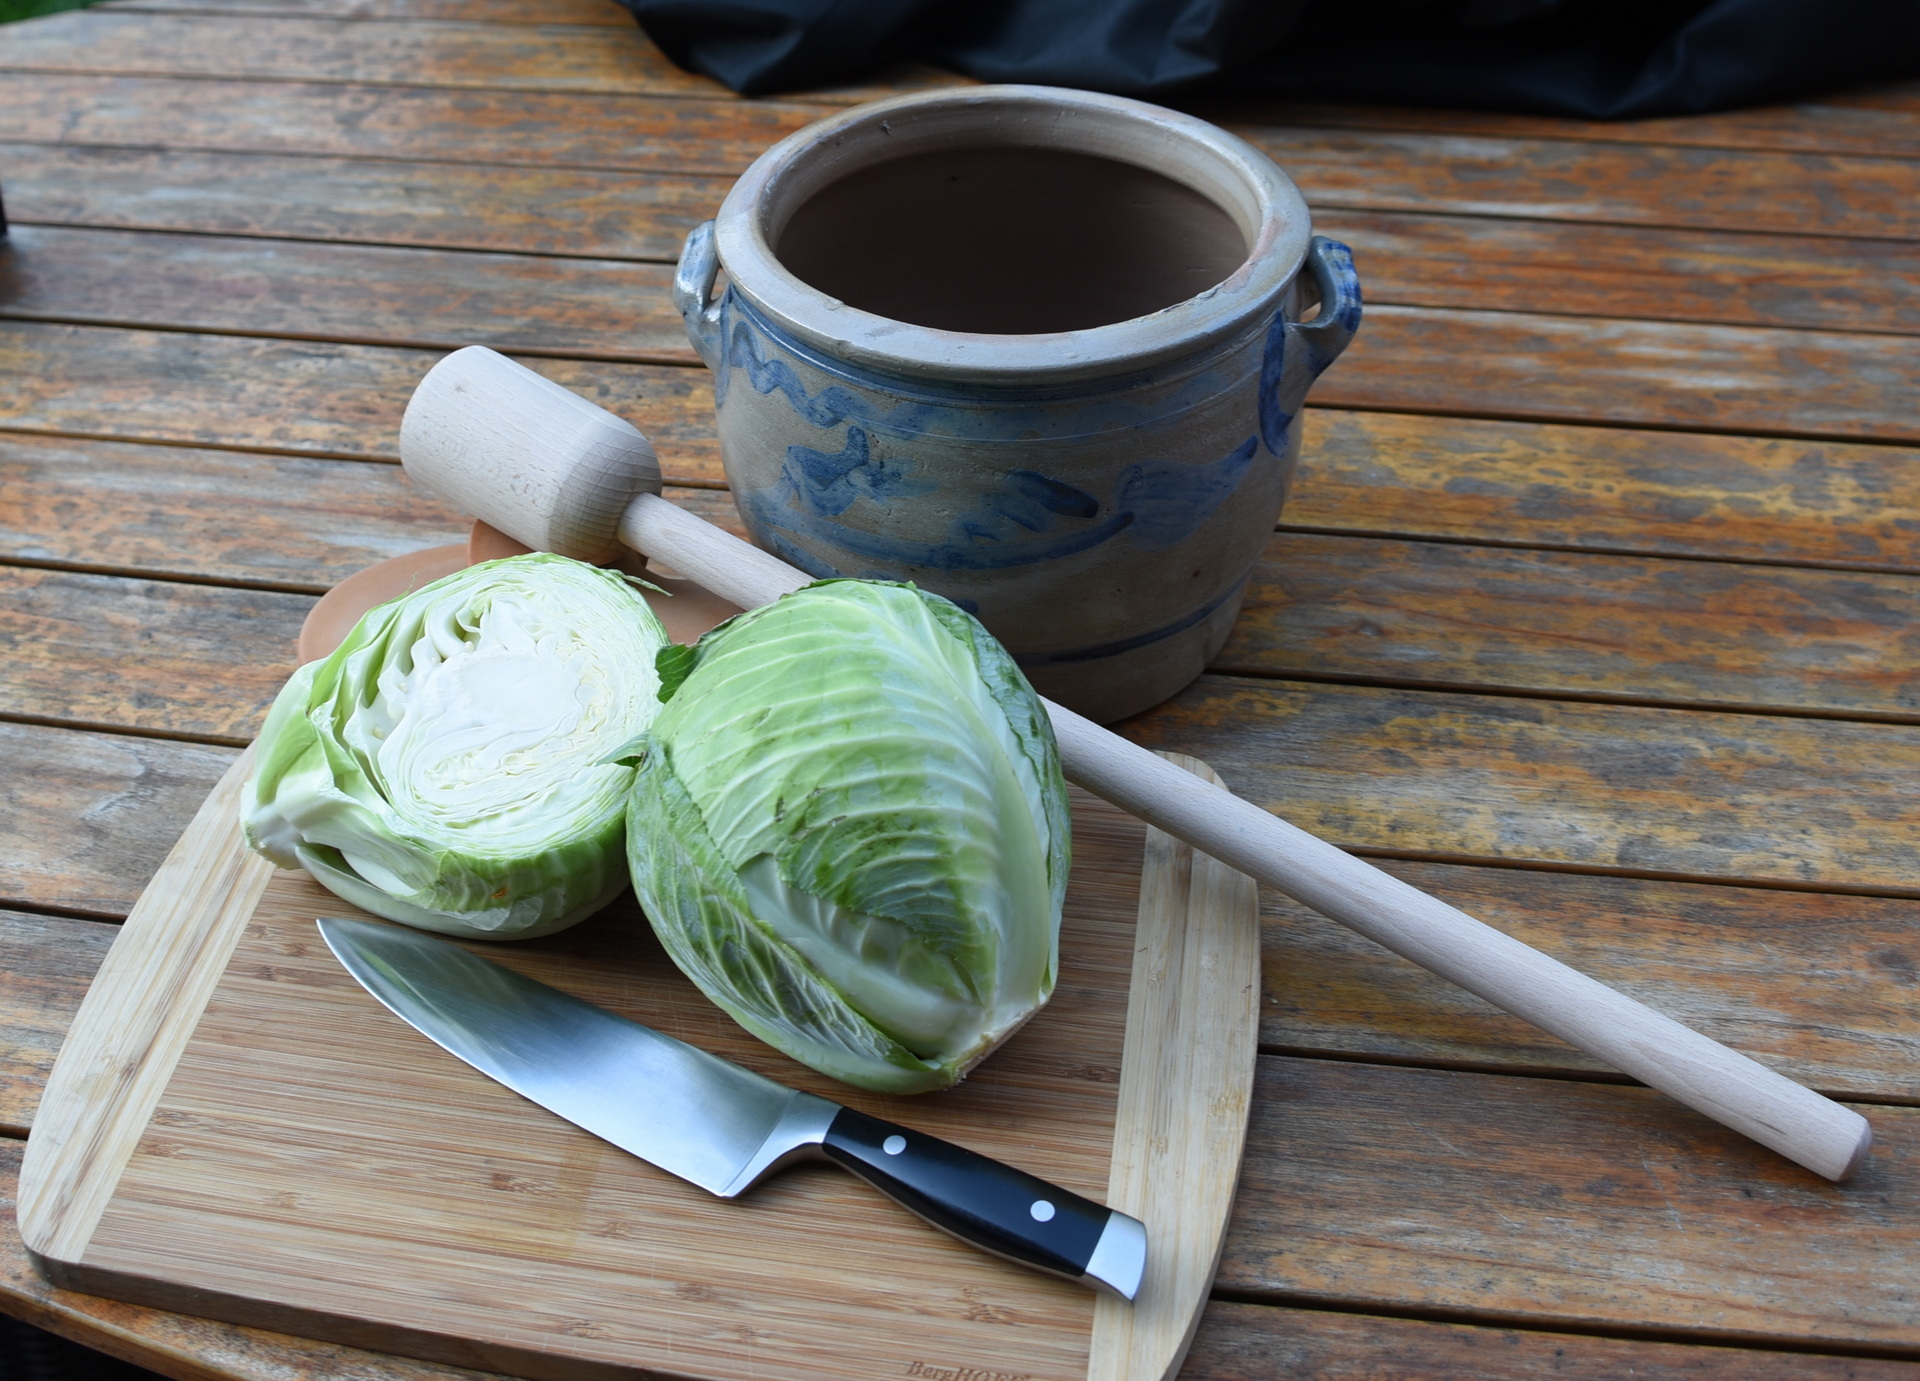
We love fermenting! Sometimes we ferment our own sauerkraut.
Depending on the volume it can take at least 2 weeks up to several months.
Bottom left – Stone Crock pot weights
If you don’t have crock pot weights, use a plastic bag filled with water. (See below)
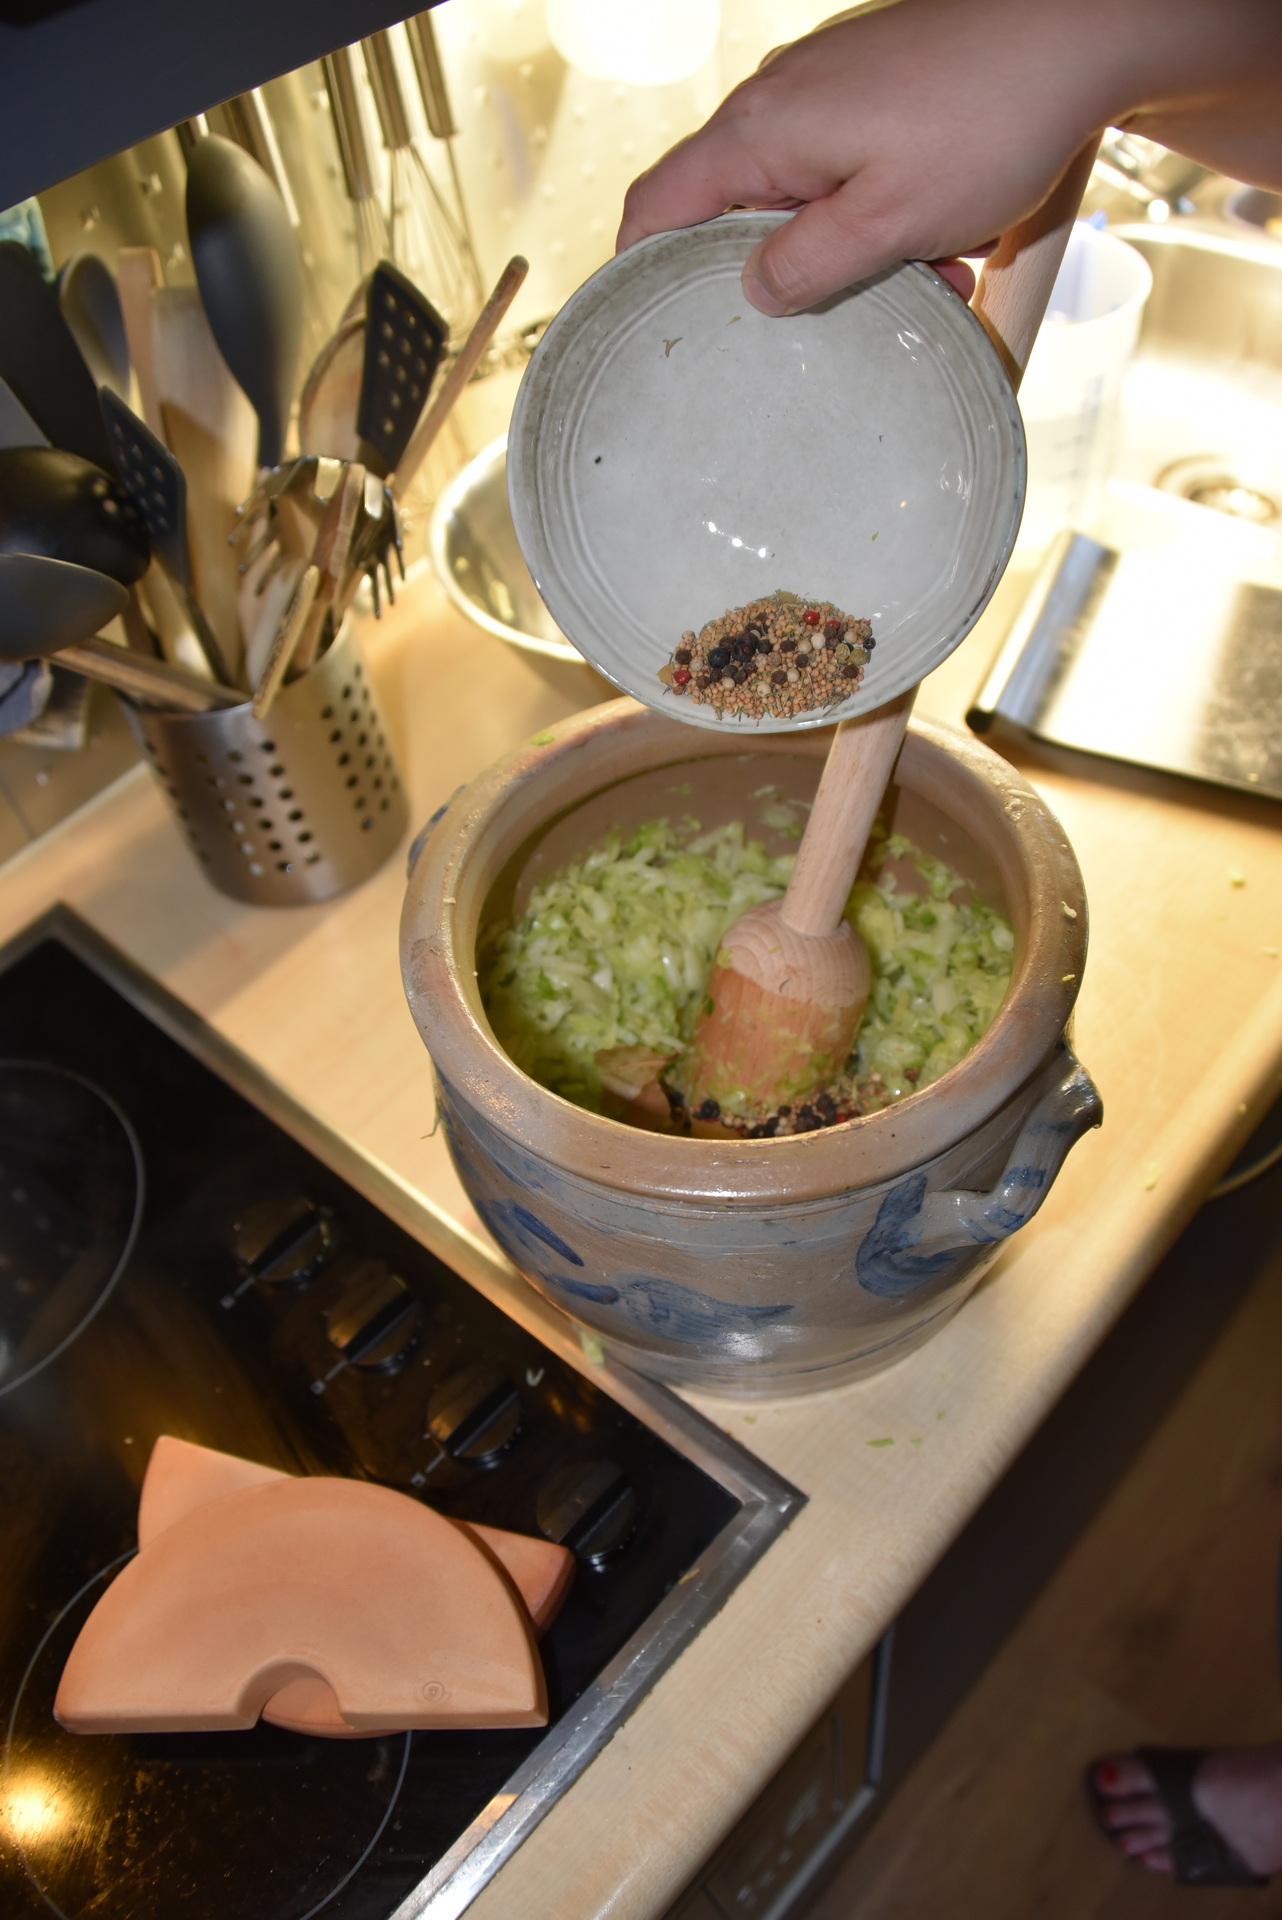
Mixture: Salt, juniper berries, dill, celery seeds and caraway.
Rinse Cabbage and clean. Cut out and discard the hard white center.
Take the largest leaves from one cabbage and lay them out at the bottom of your clean and rinsed out crock pot.
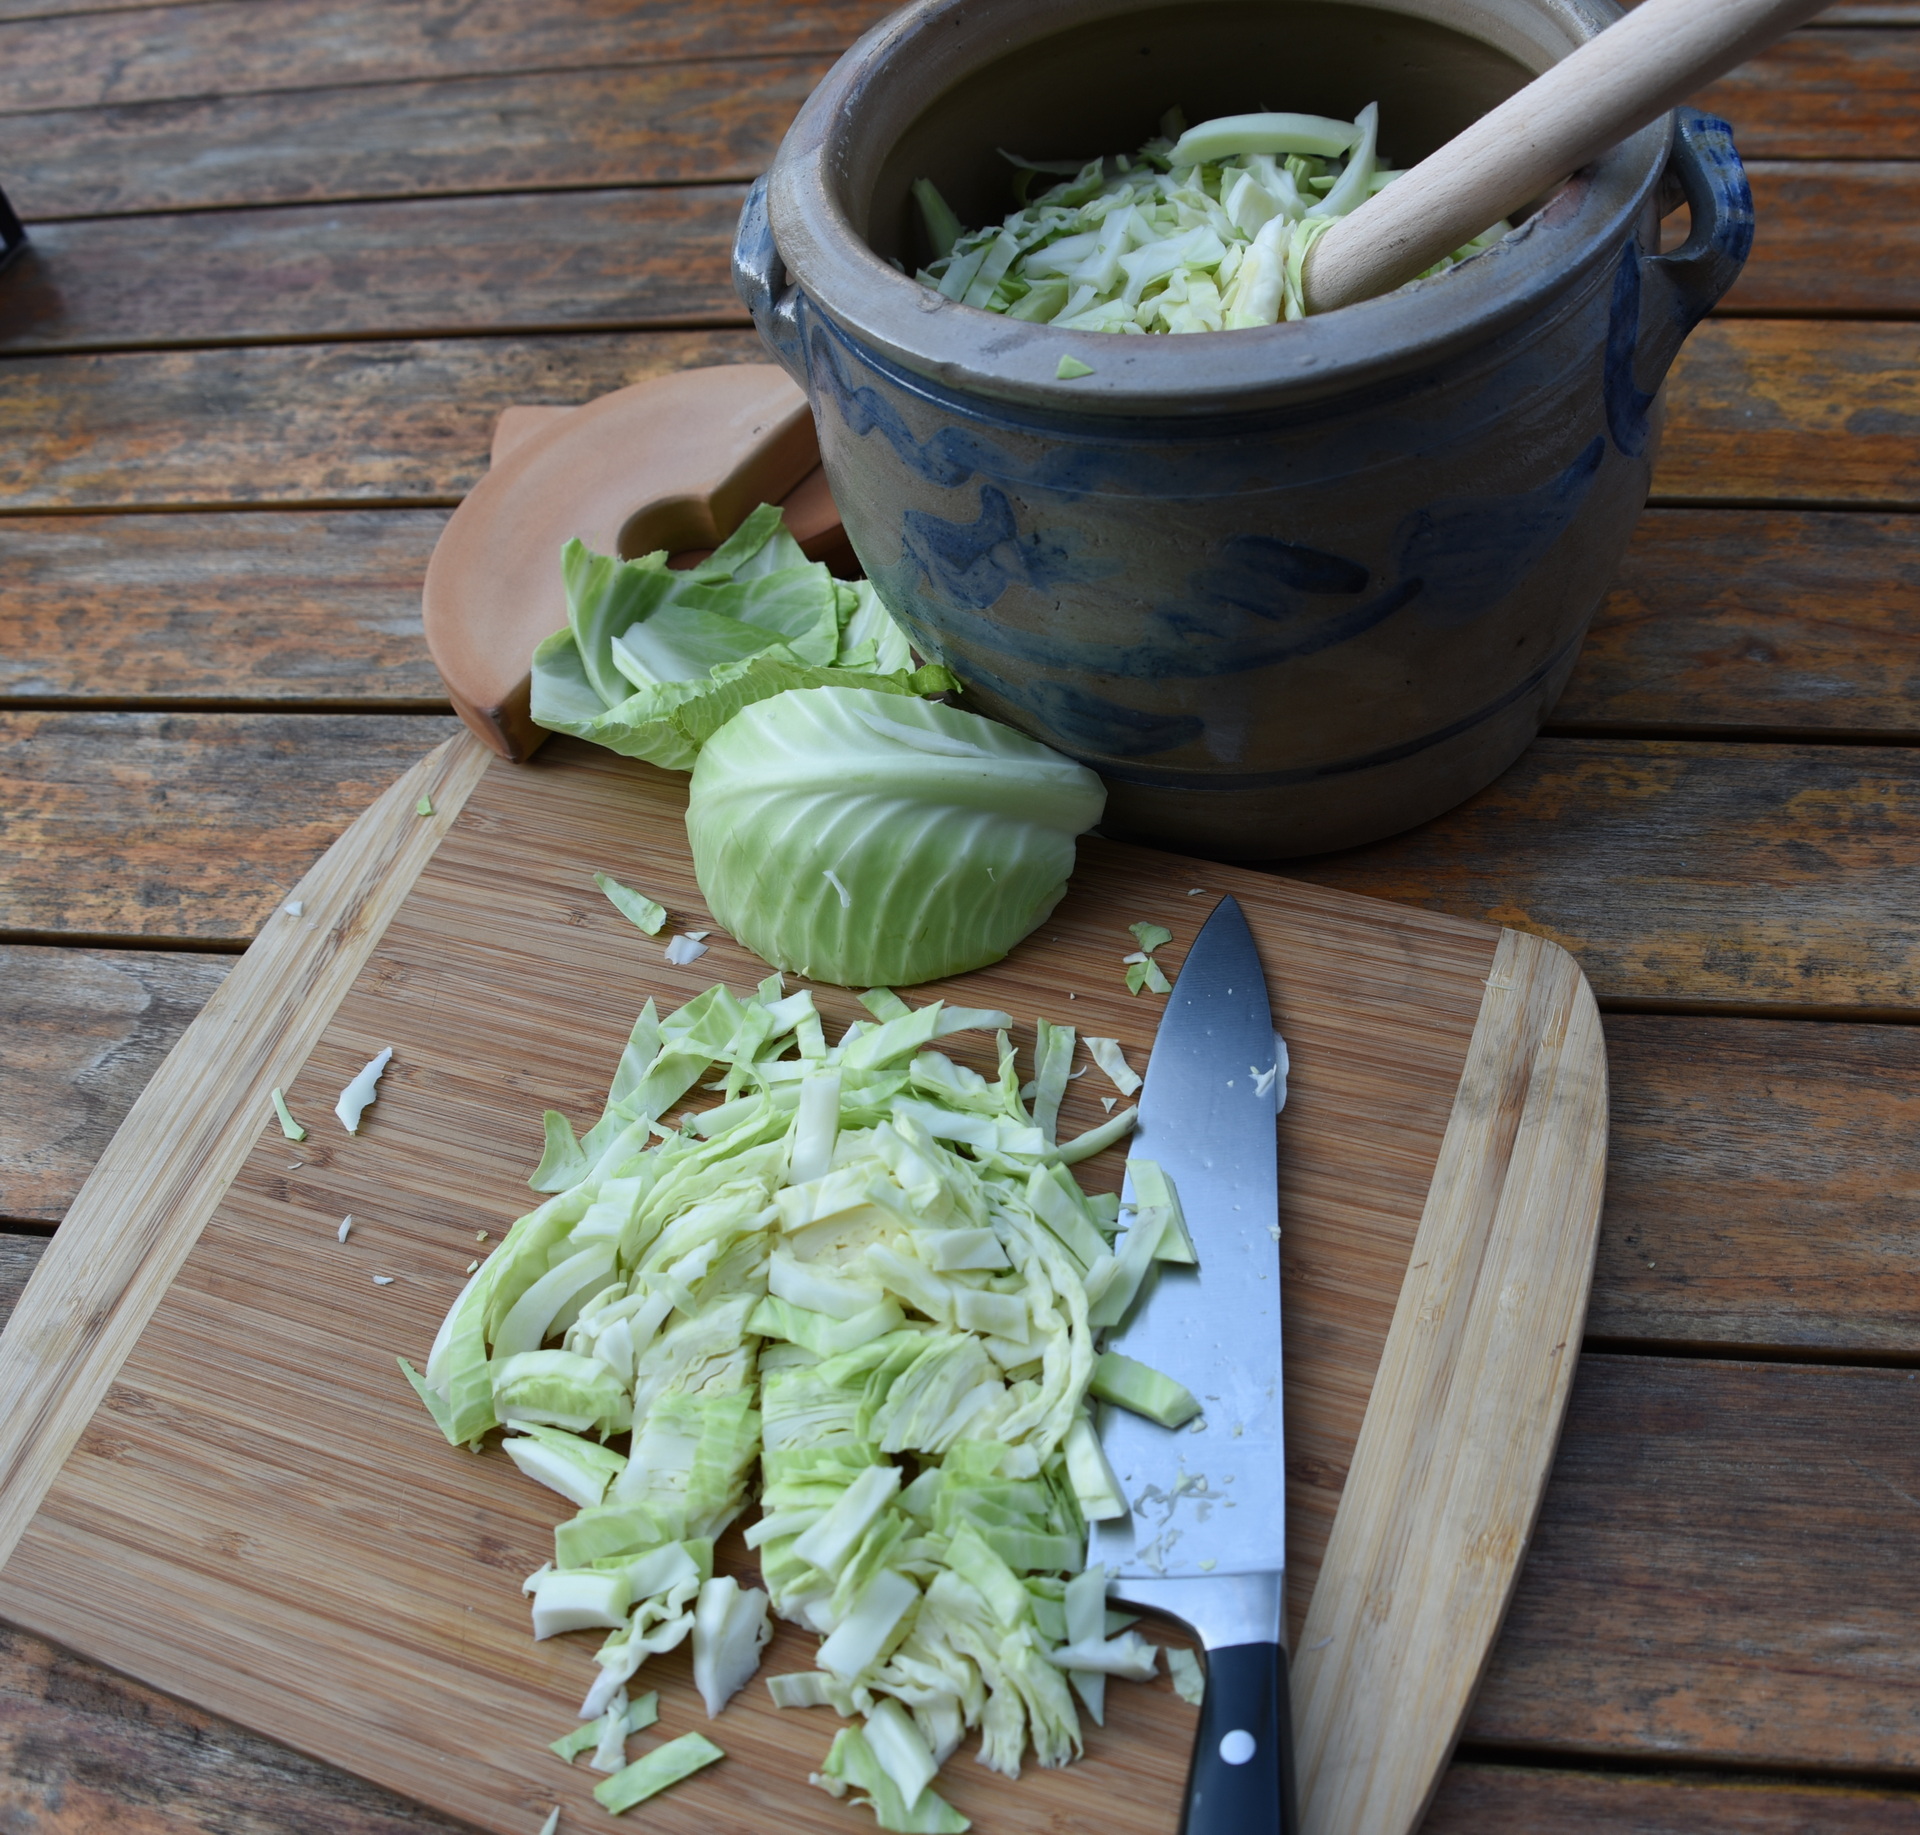
Shred the rest of the cabbage.
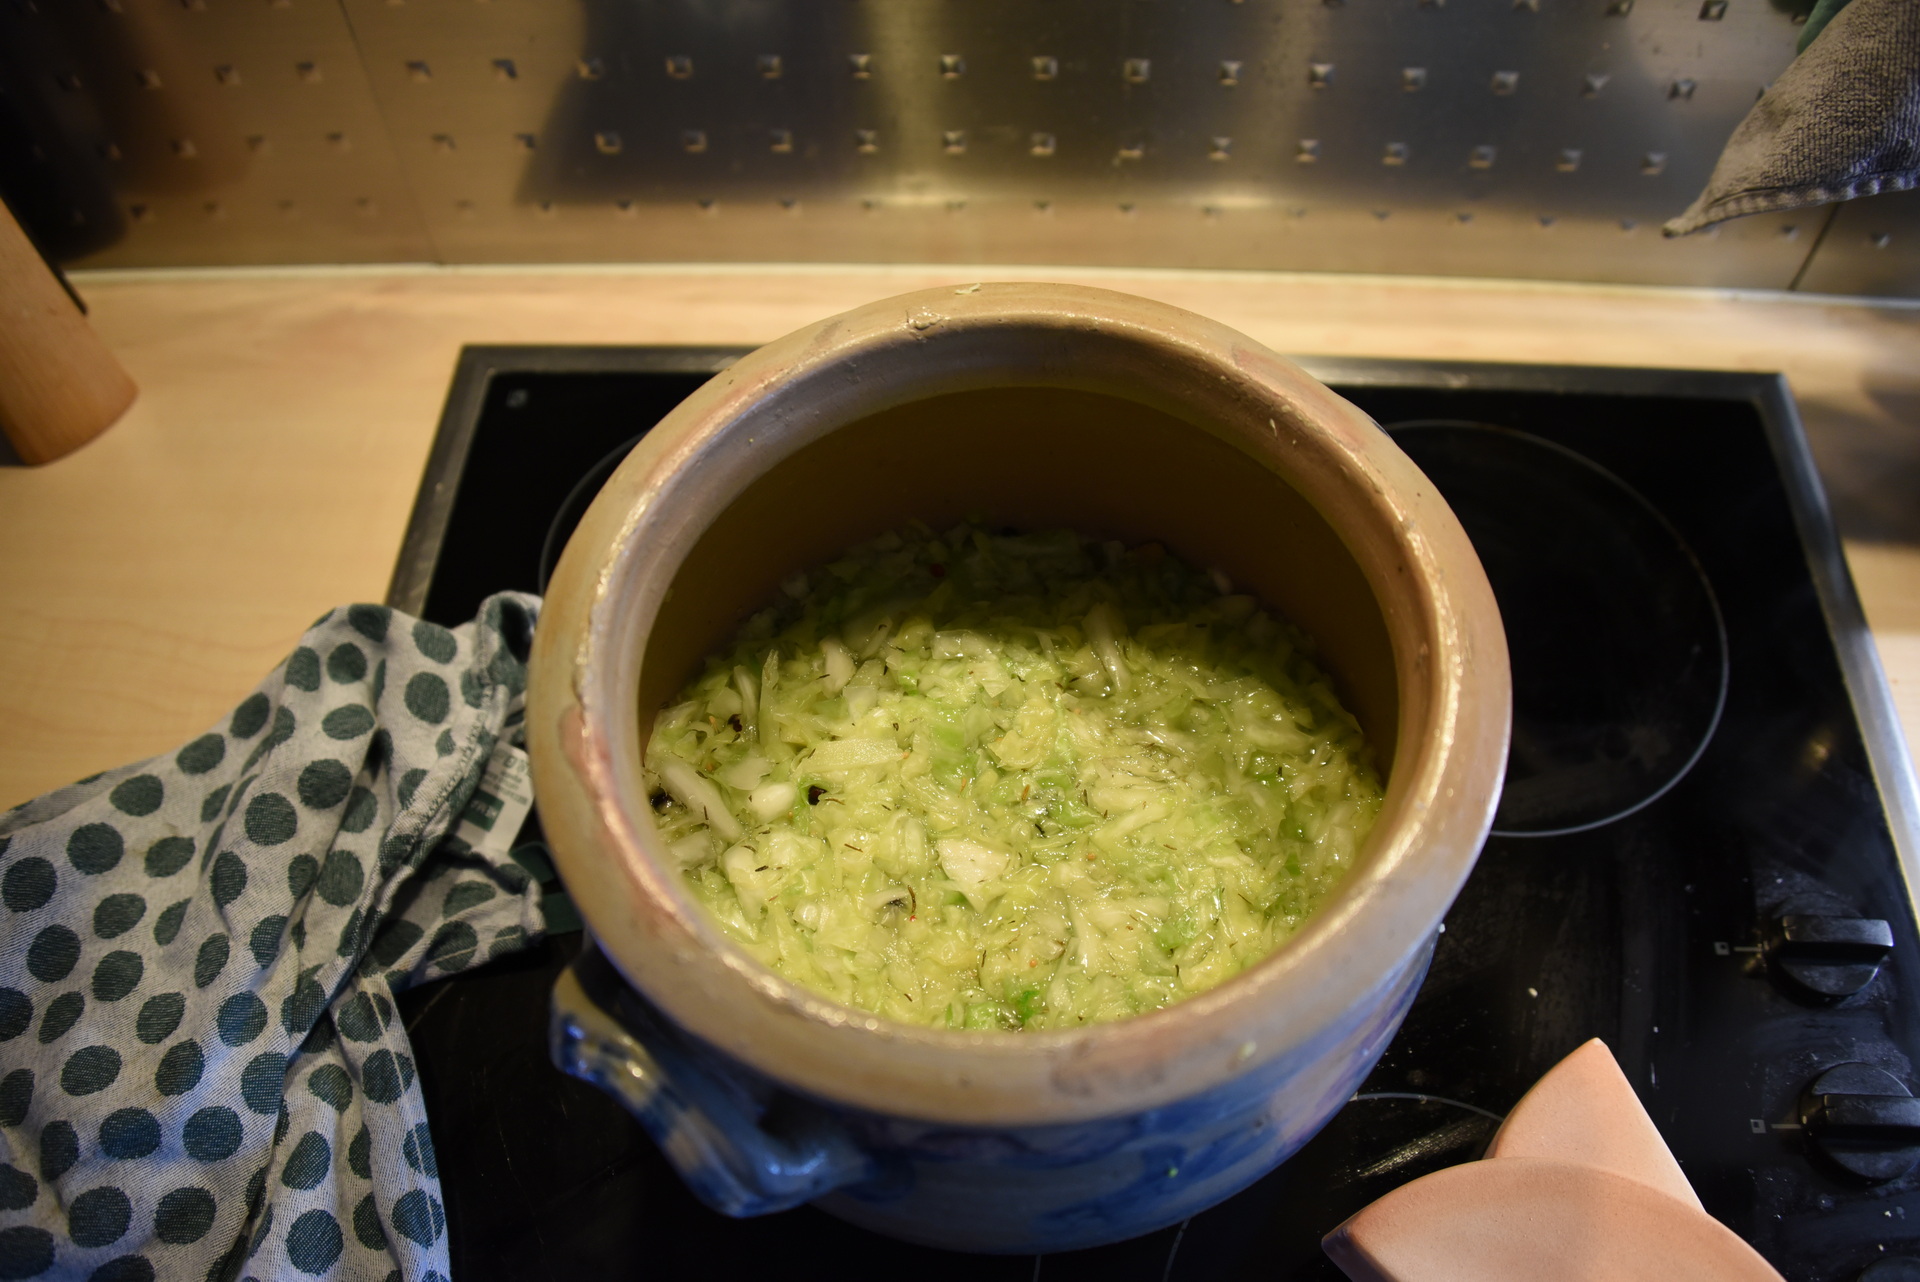
Add a layer of shredded cabbage over the laid out leaves in the crock pot. Sprinkle some of above mixture over this layer. Compress by stomping down with the stomper.
Repeat the layering process until you used up all the cabbage, salt, and juniper berries. After each layer stomp it down.
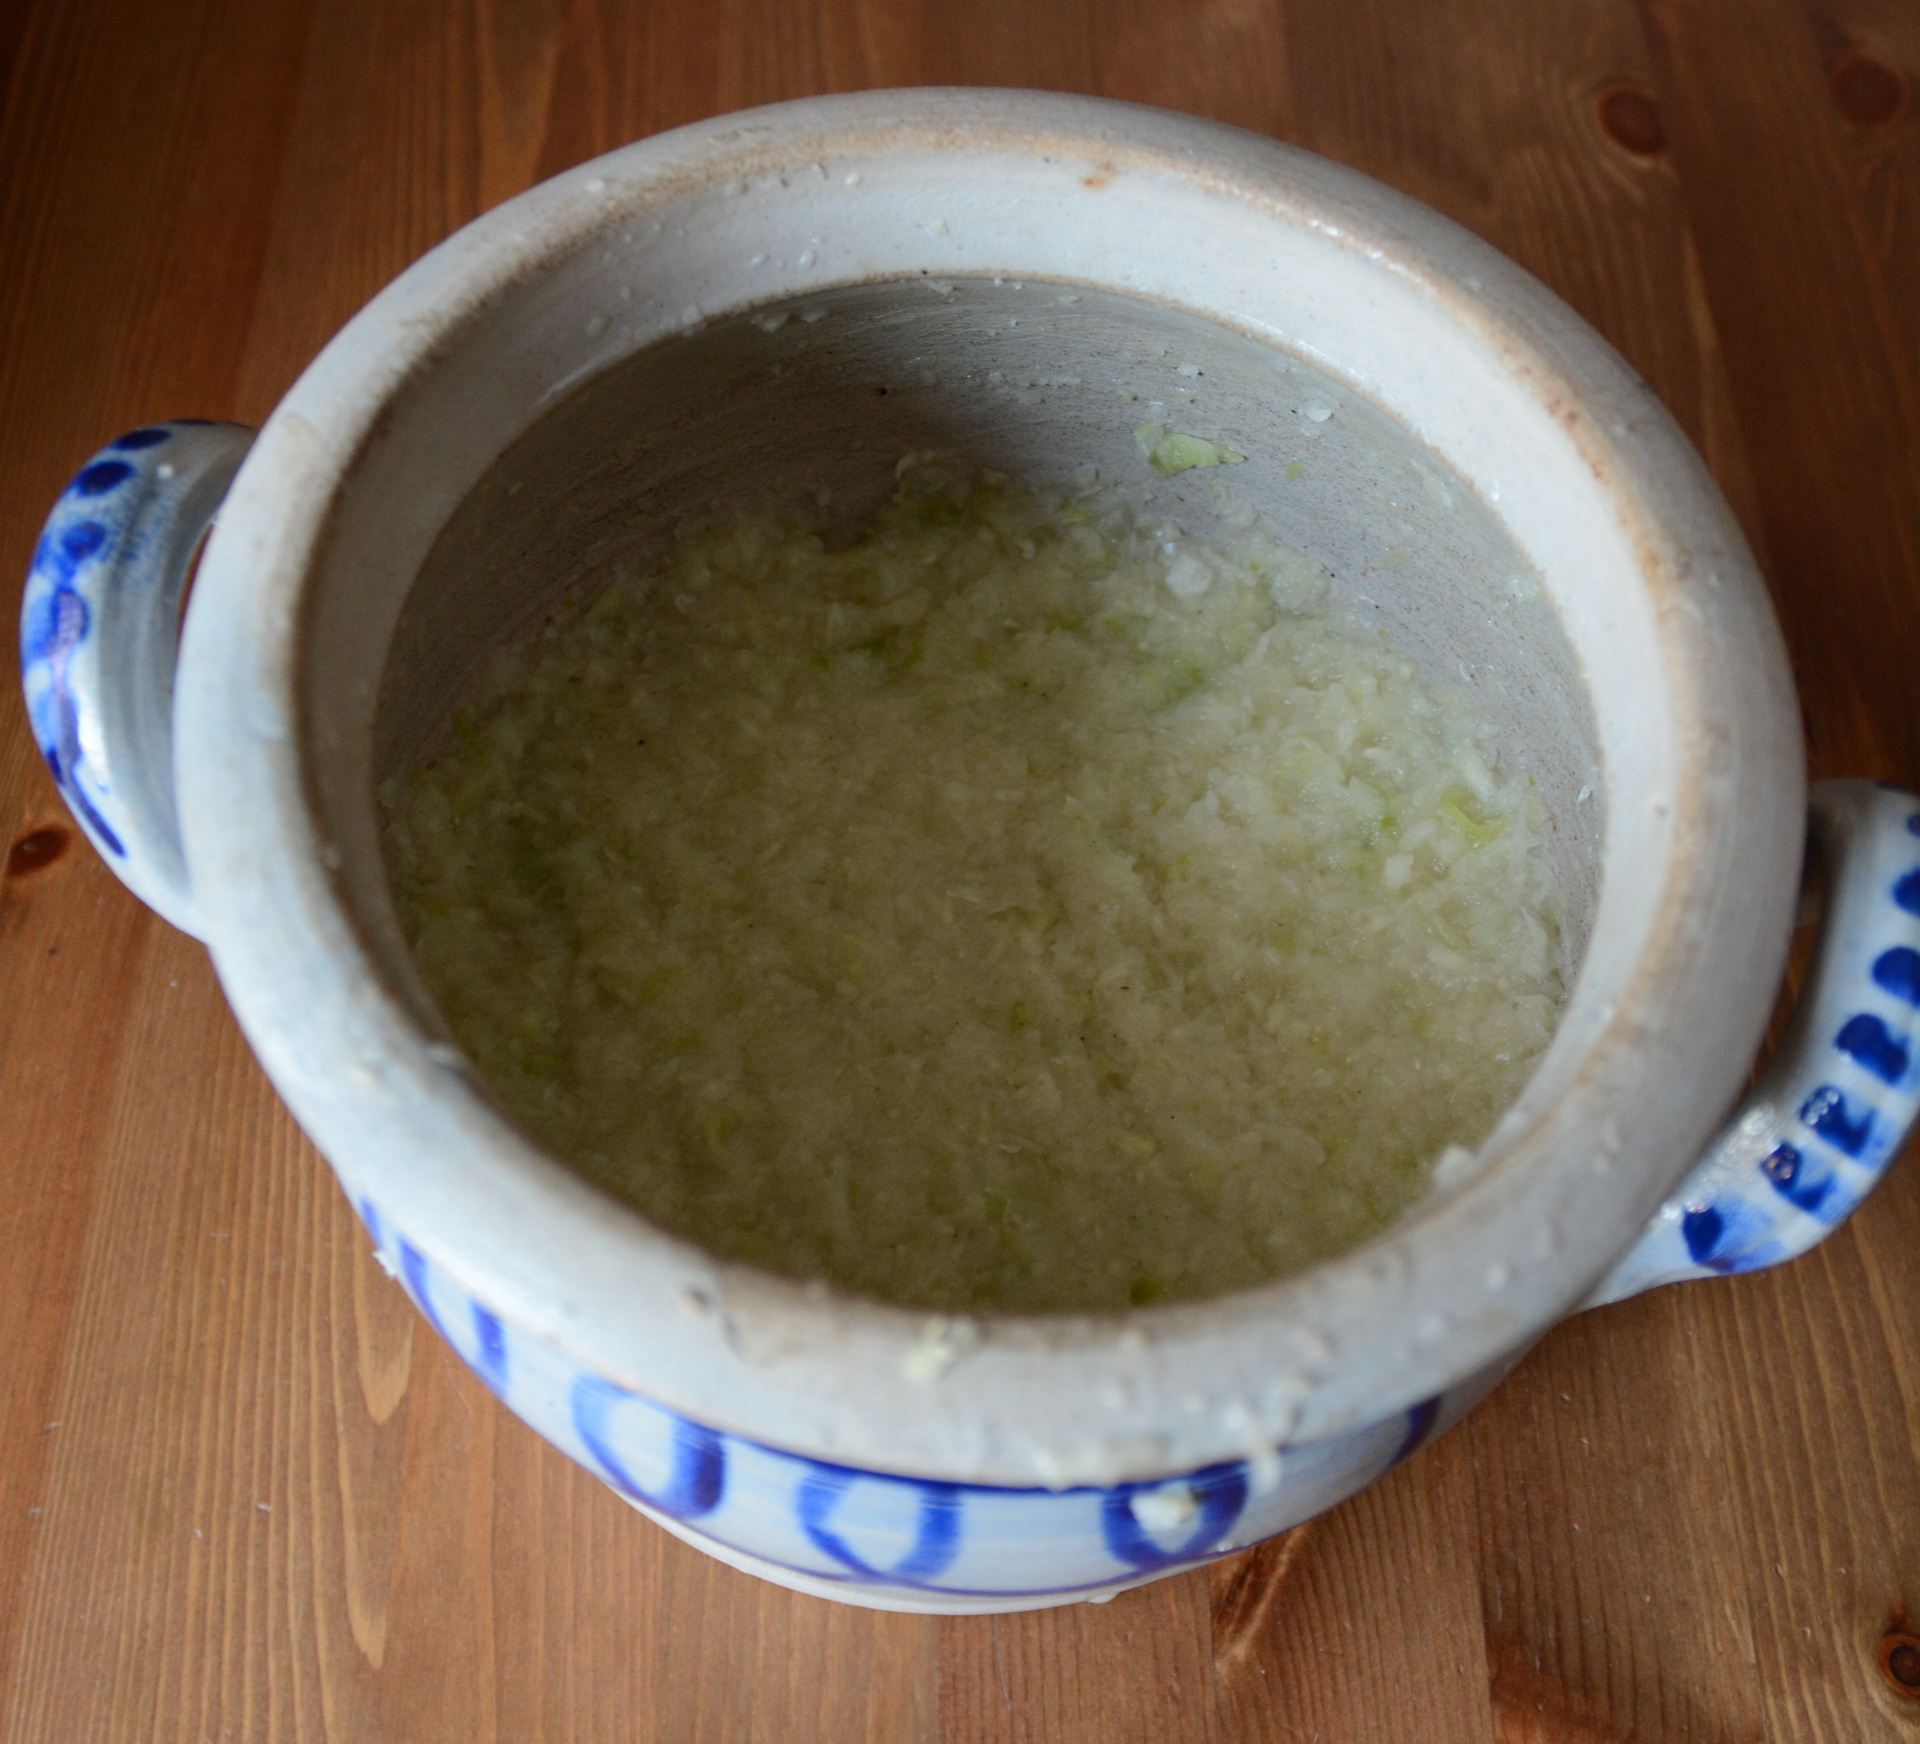
Pour all the luke warm water over the cabbage. That will activate the fermentation process.
Place clean crock pot weights over the cabbage and close the crock pot with the lid. Pour water into the ring of your crock pot and make sure there is always water in that.
Wait several weeks until cabbage is done fermenting into Sauerkraut.
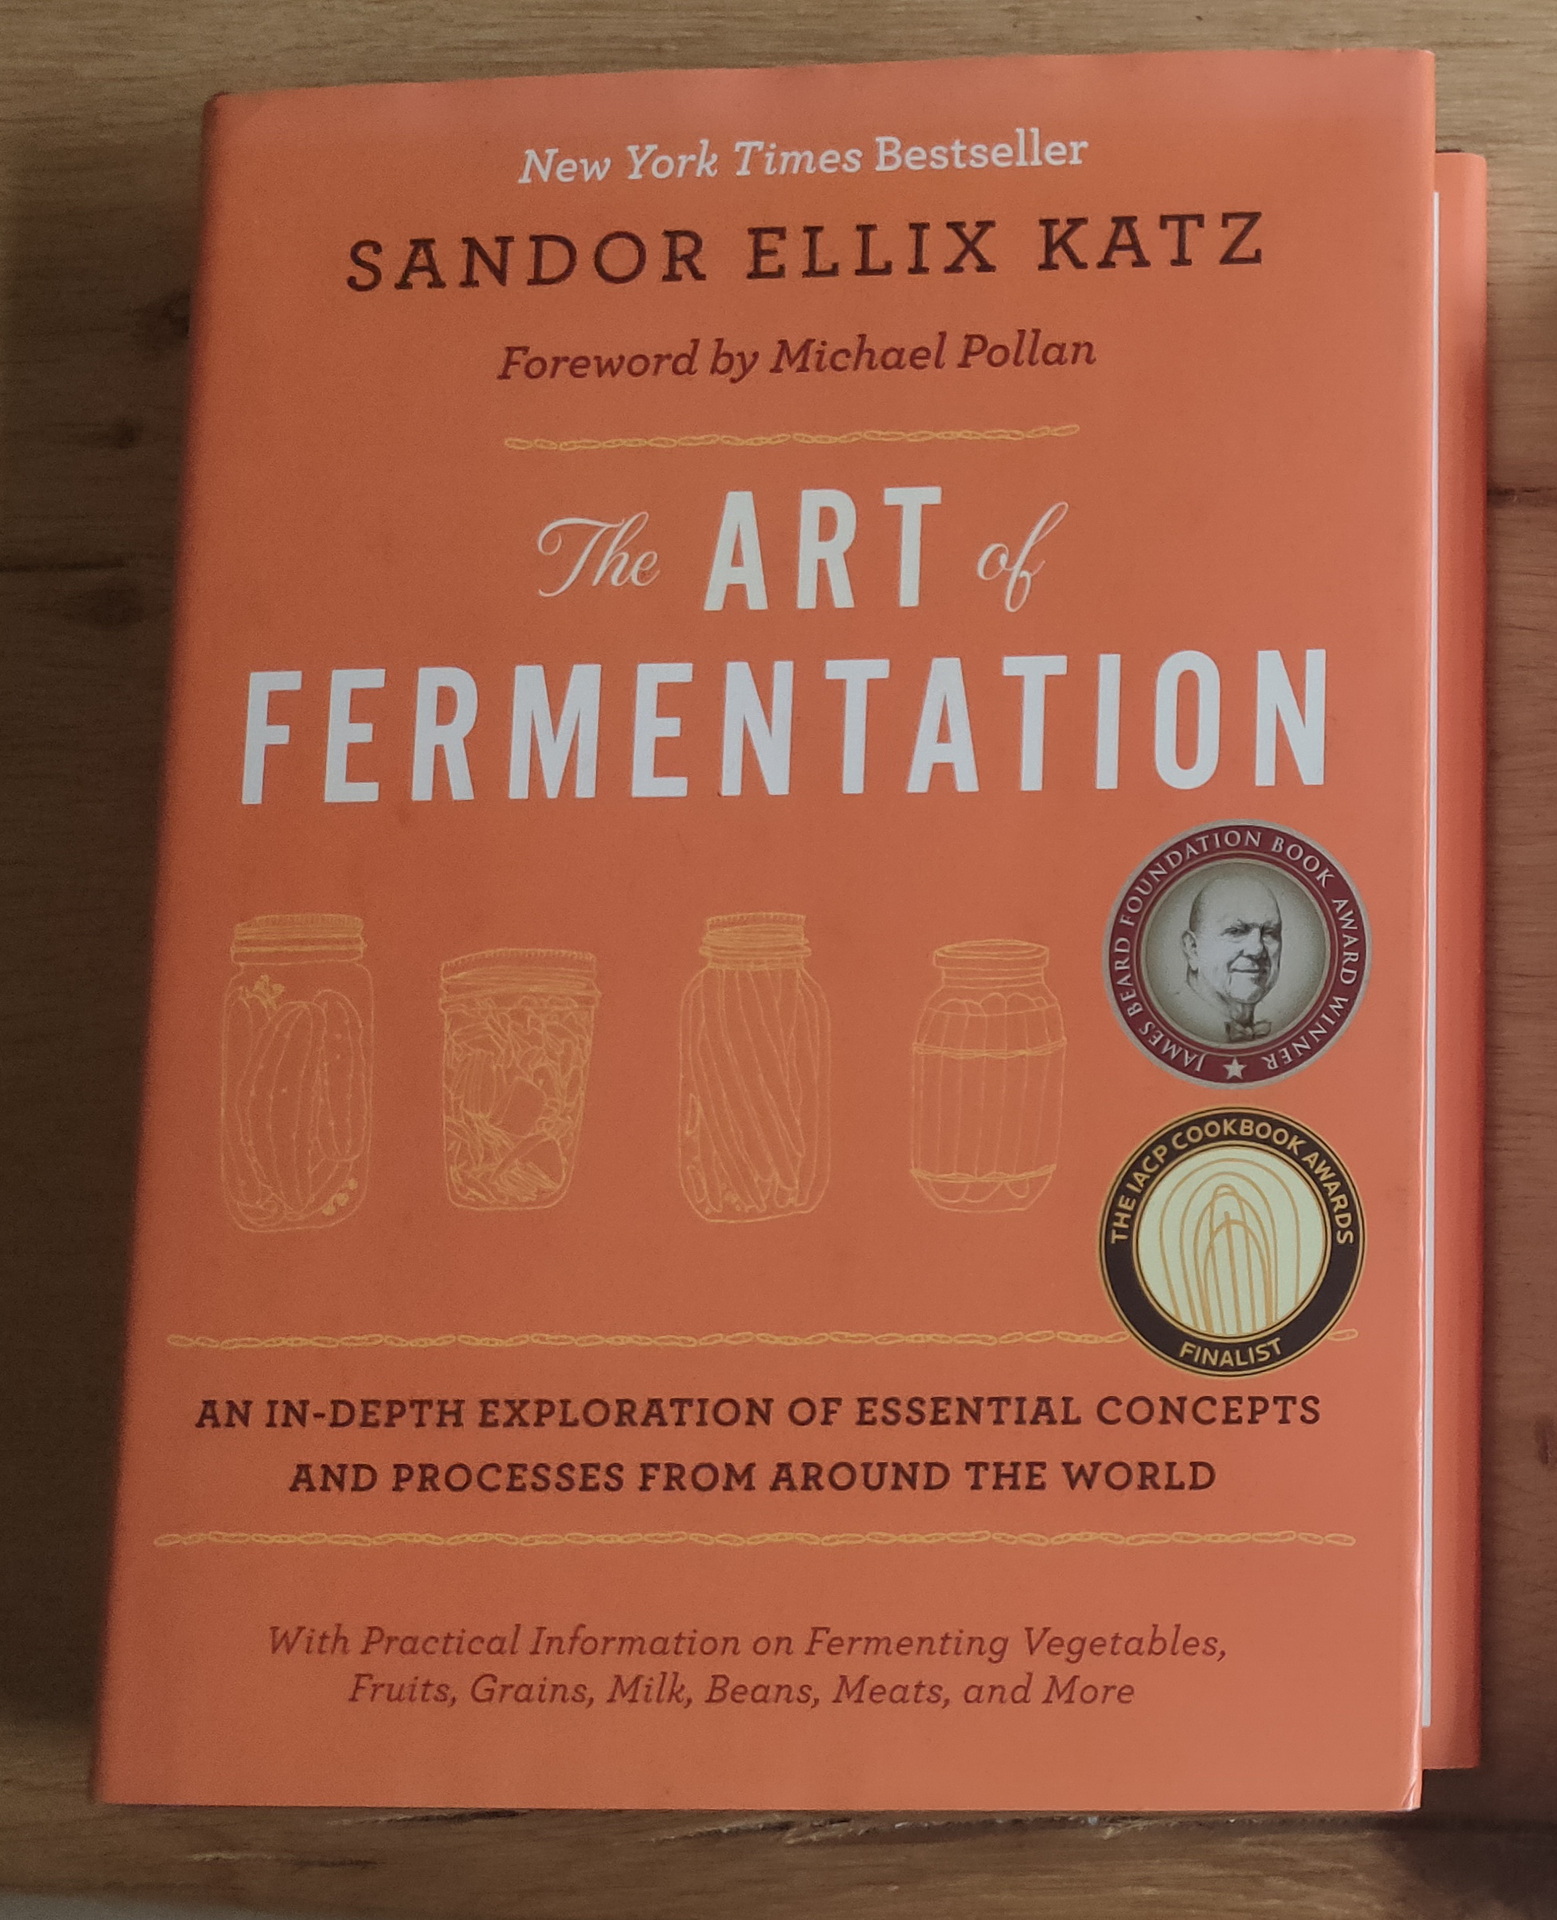
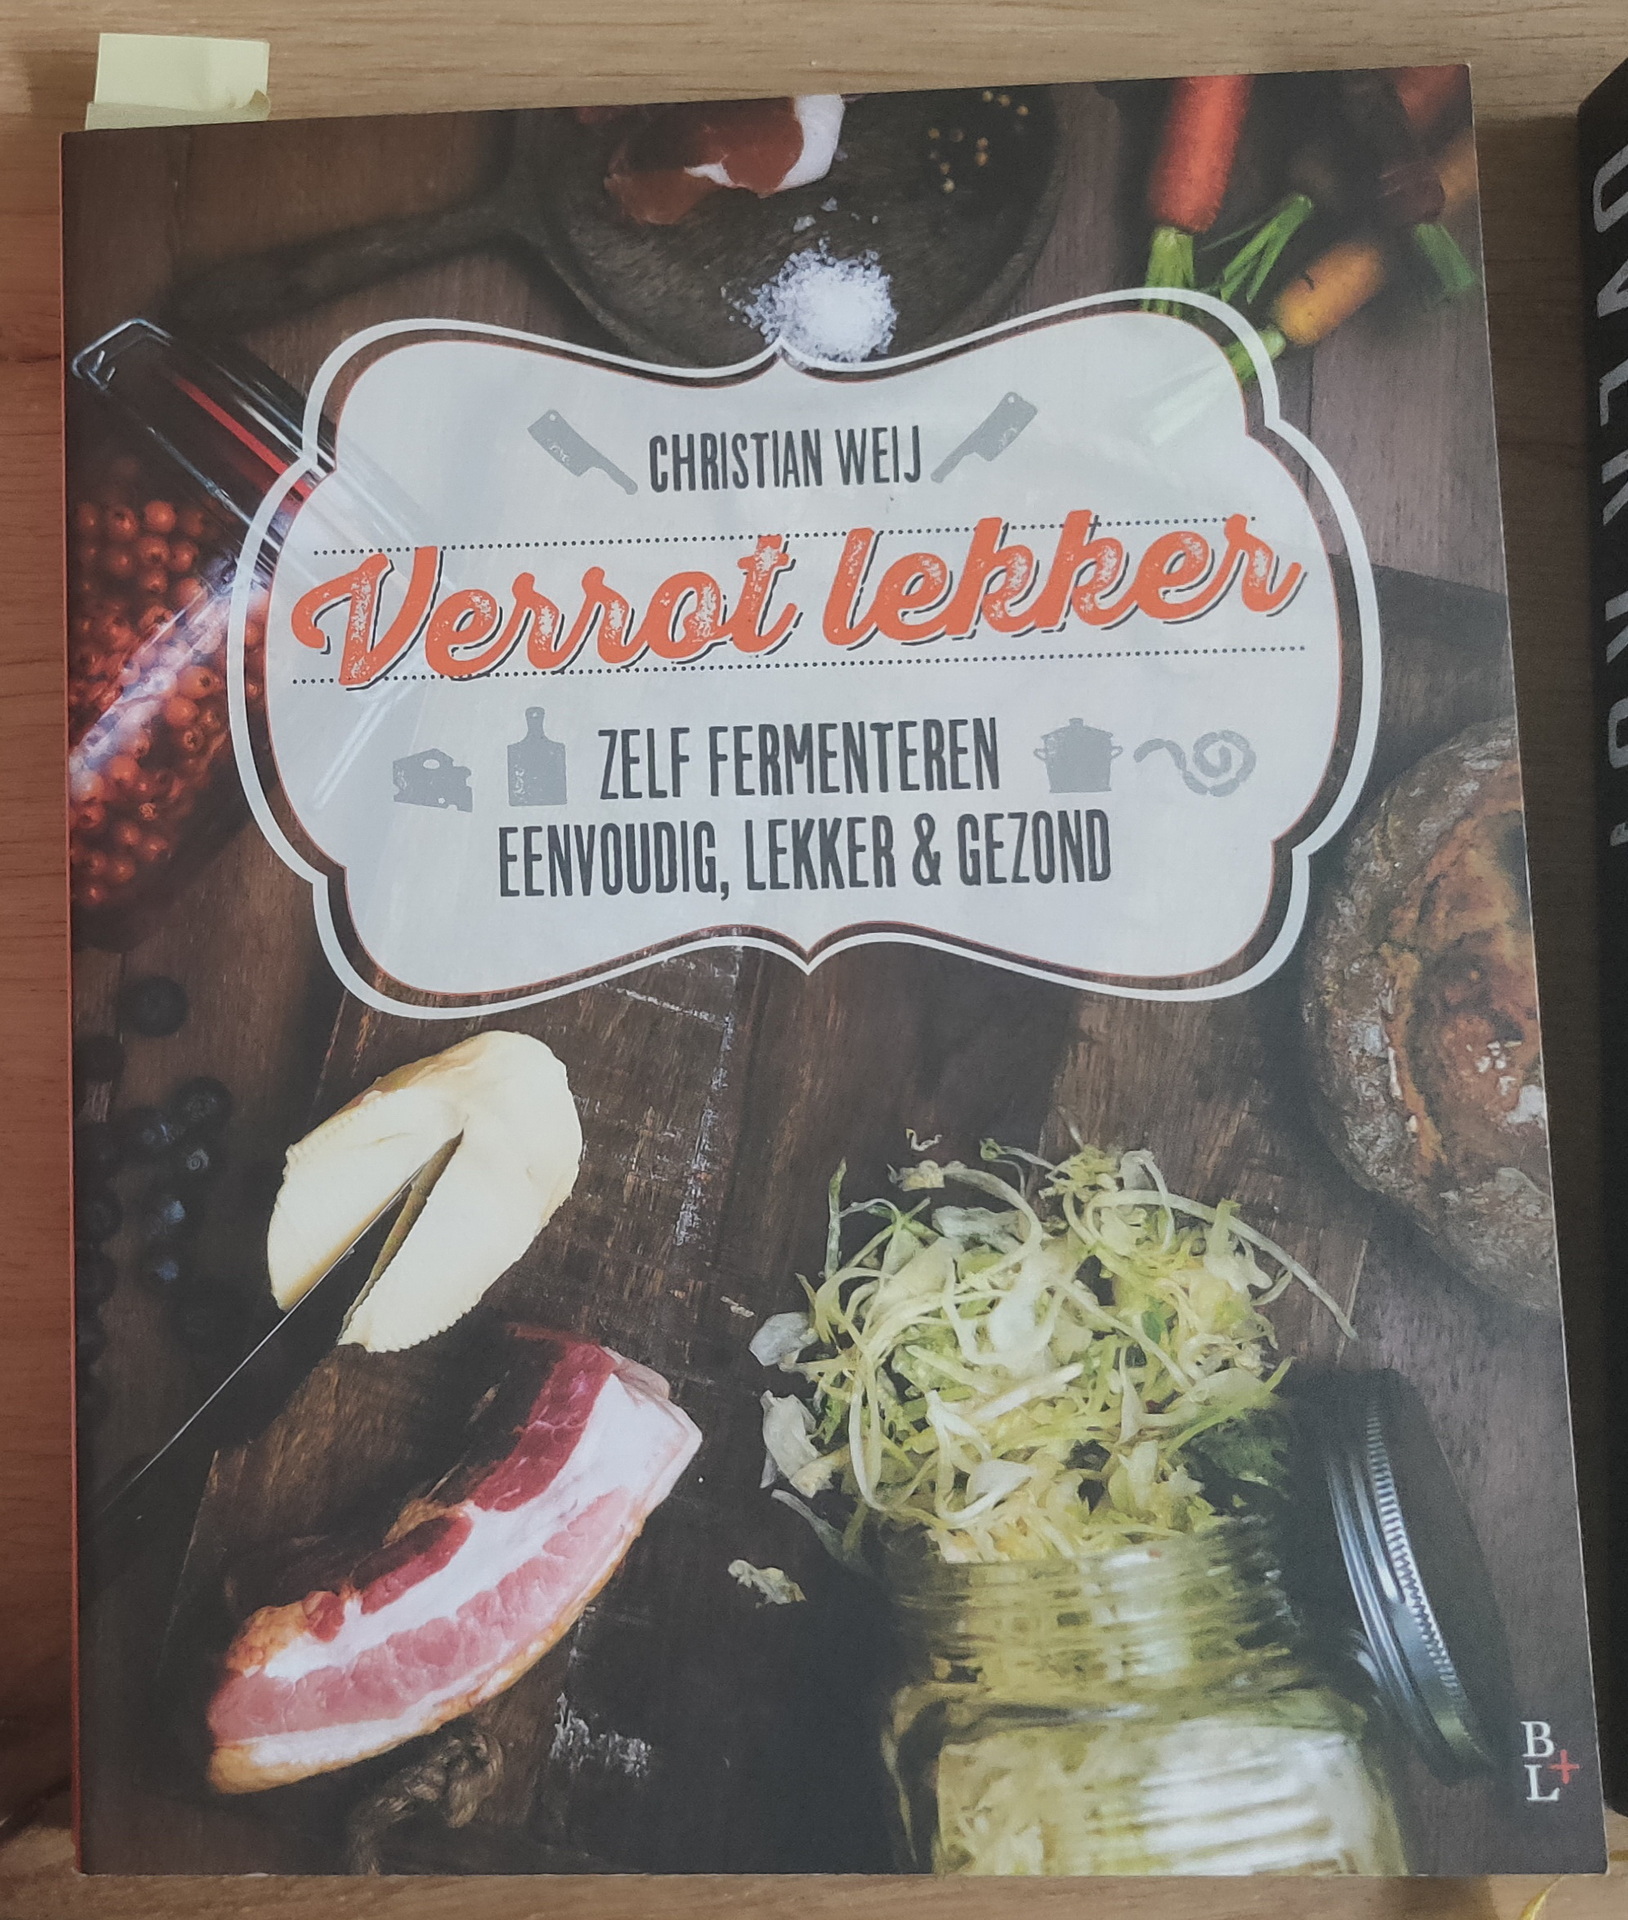
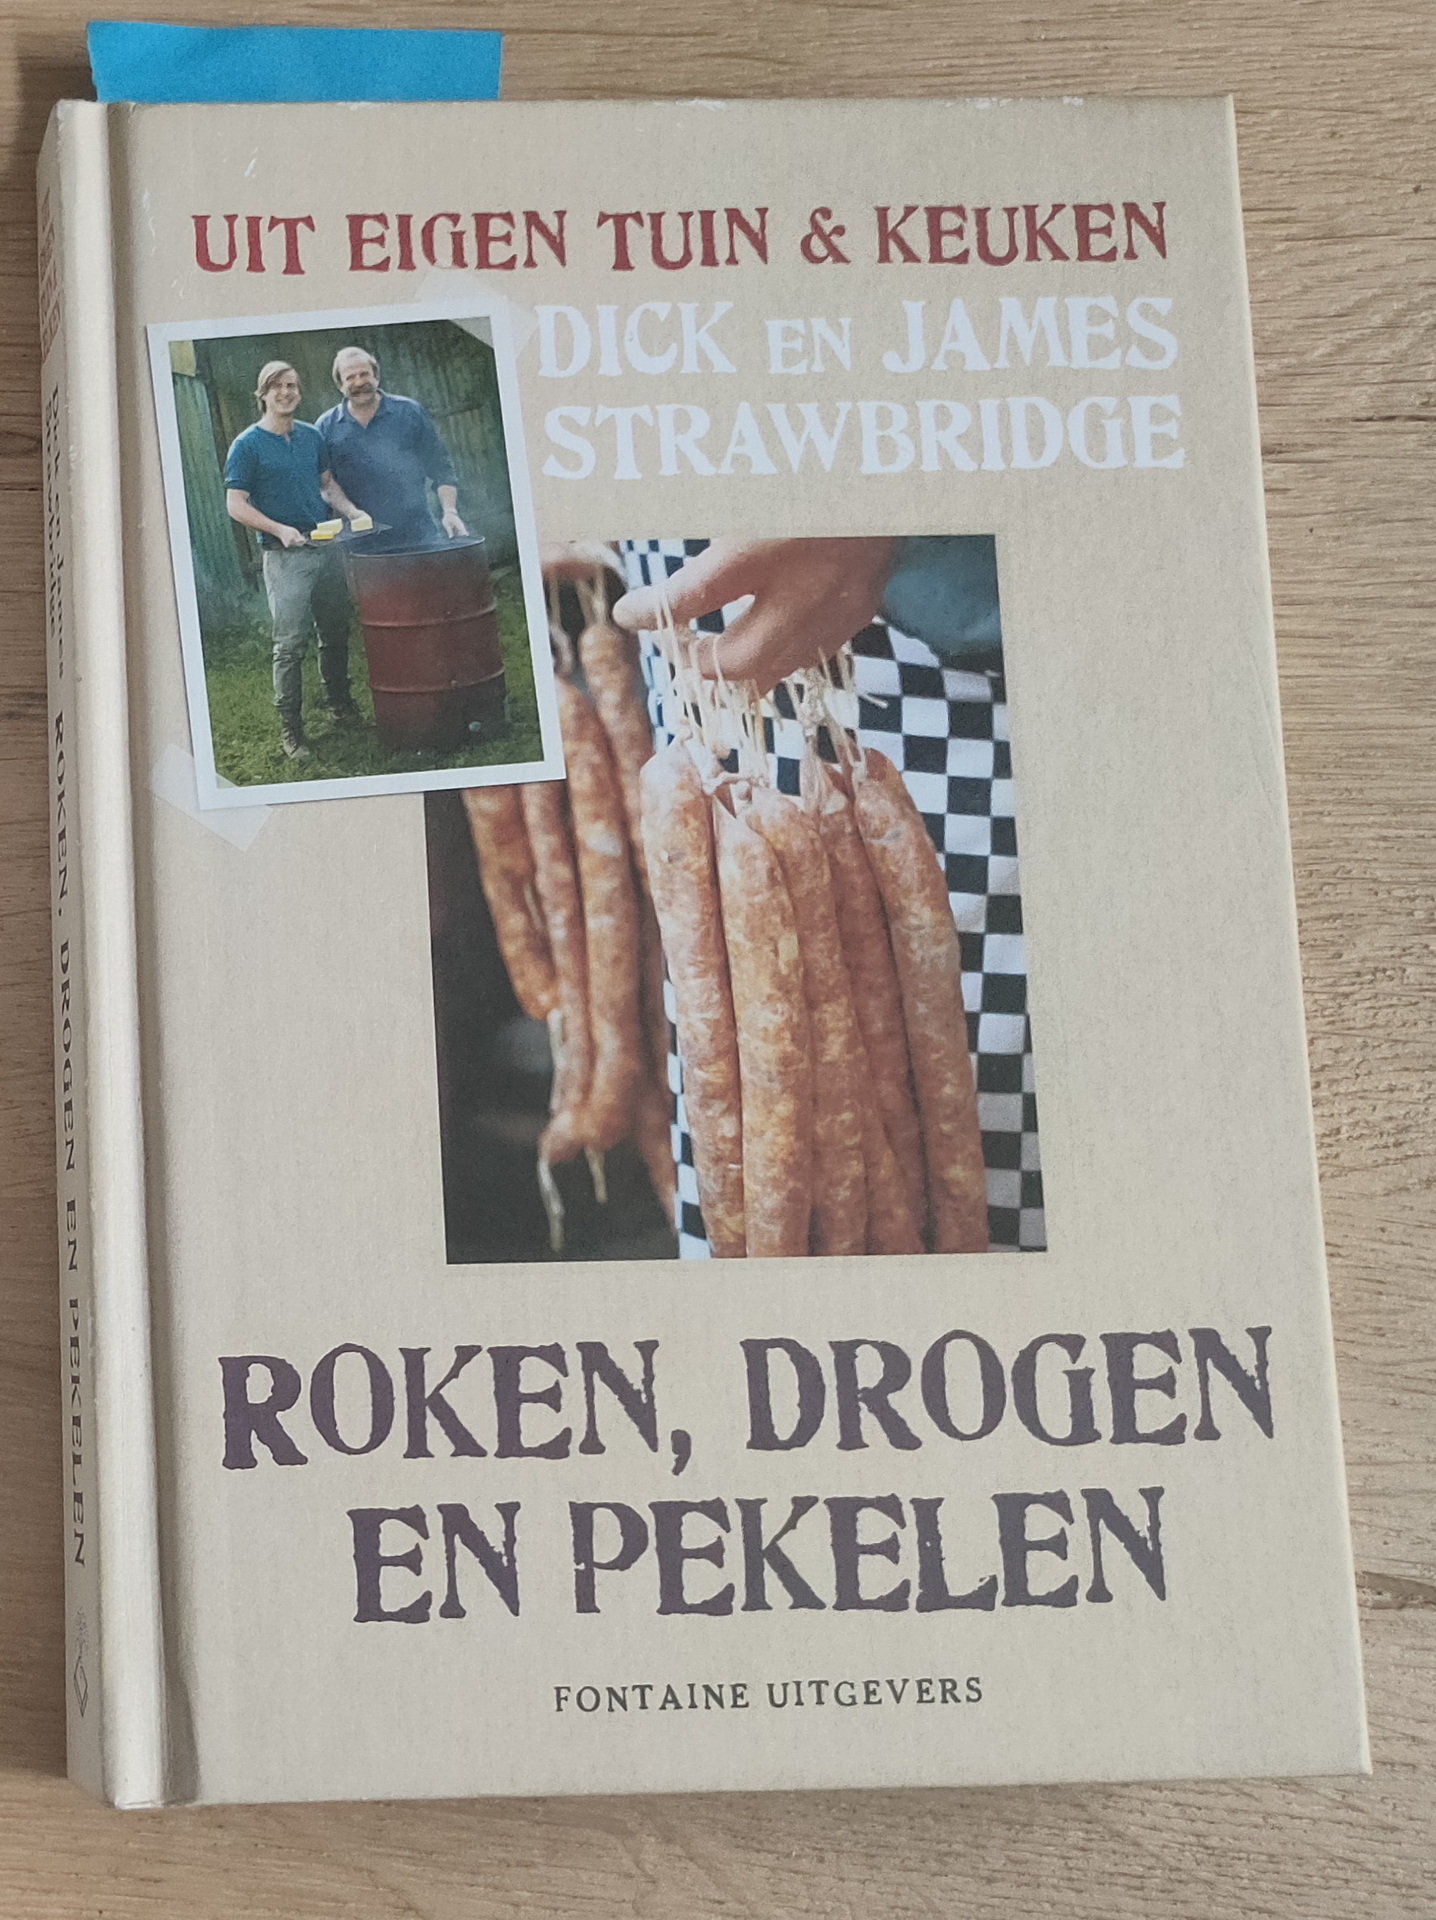
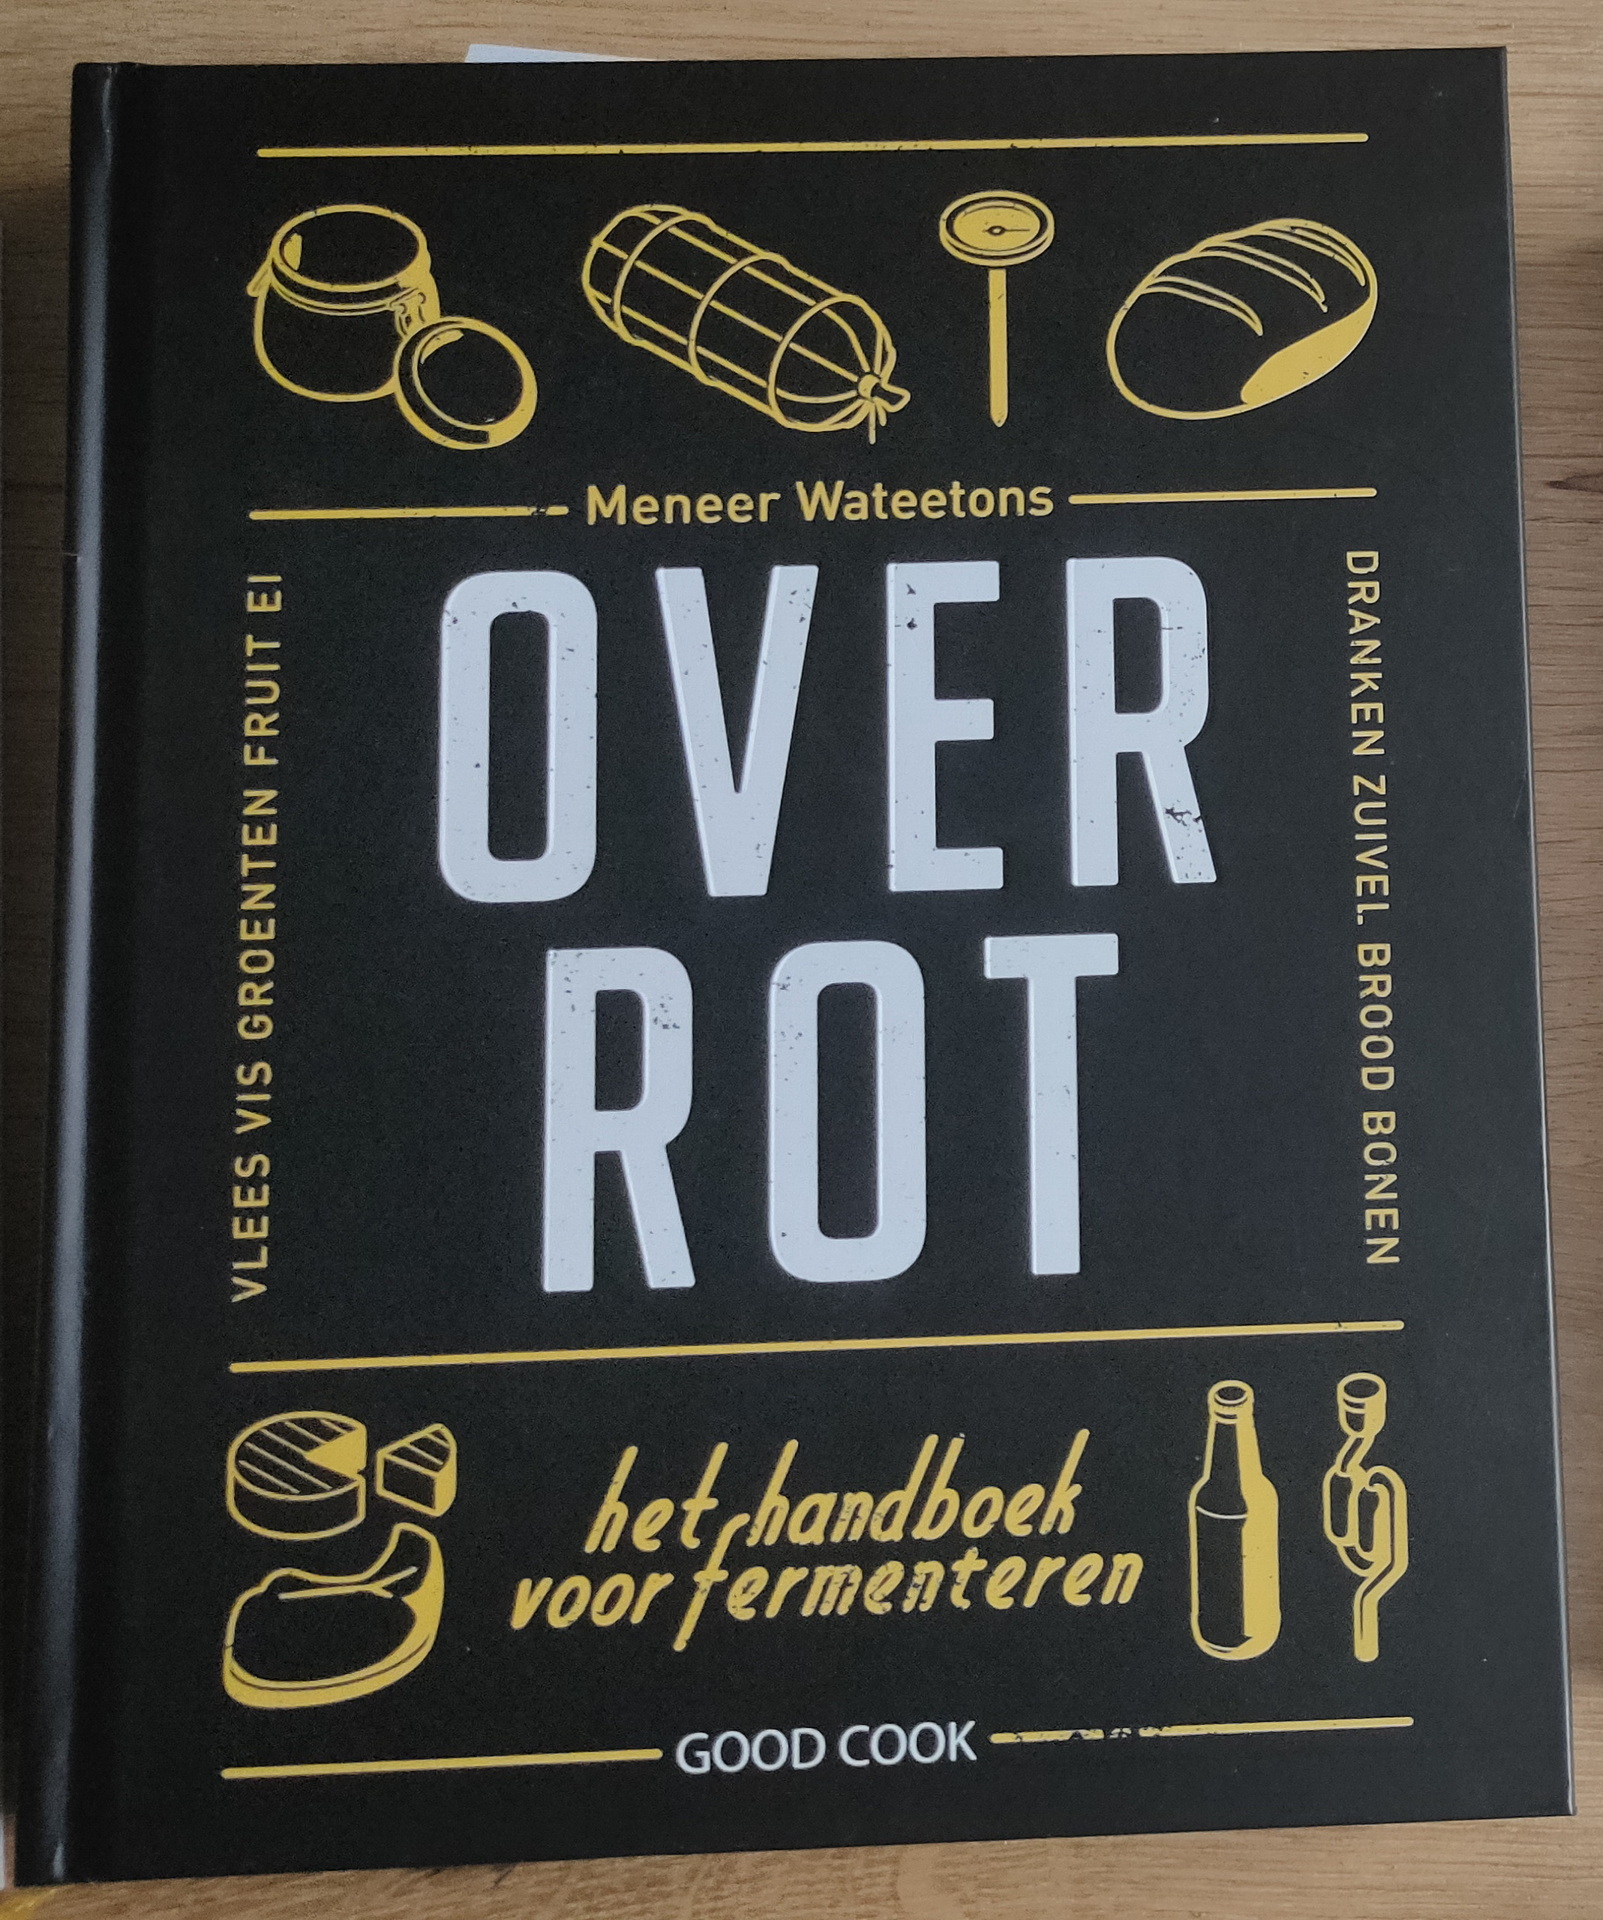
Some books about the subject we own
"If something is worth doing, it's worth overdoing."