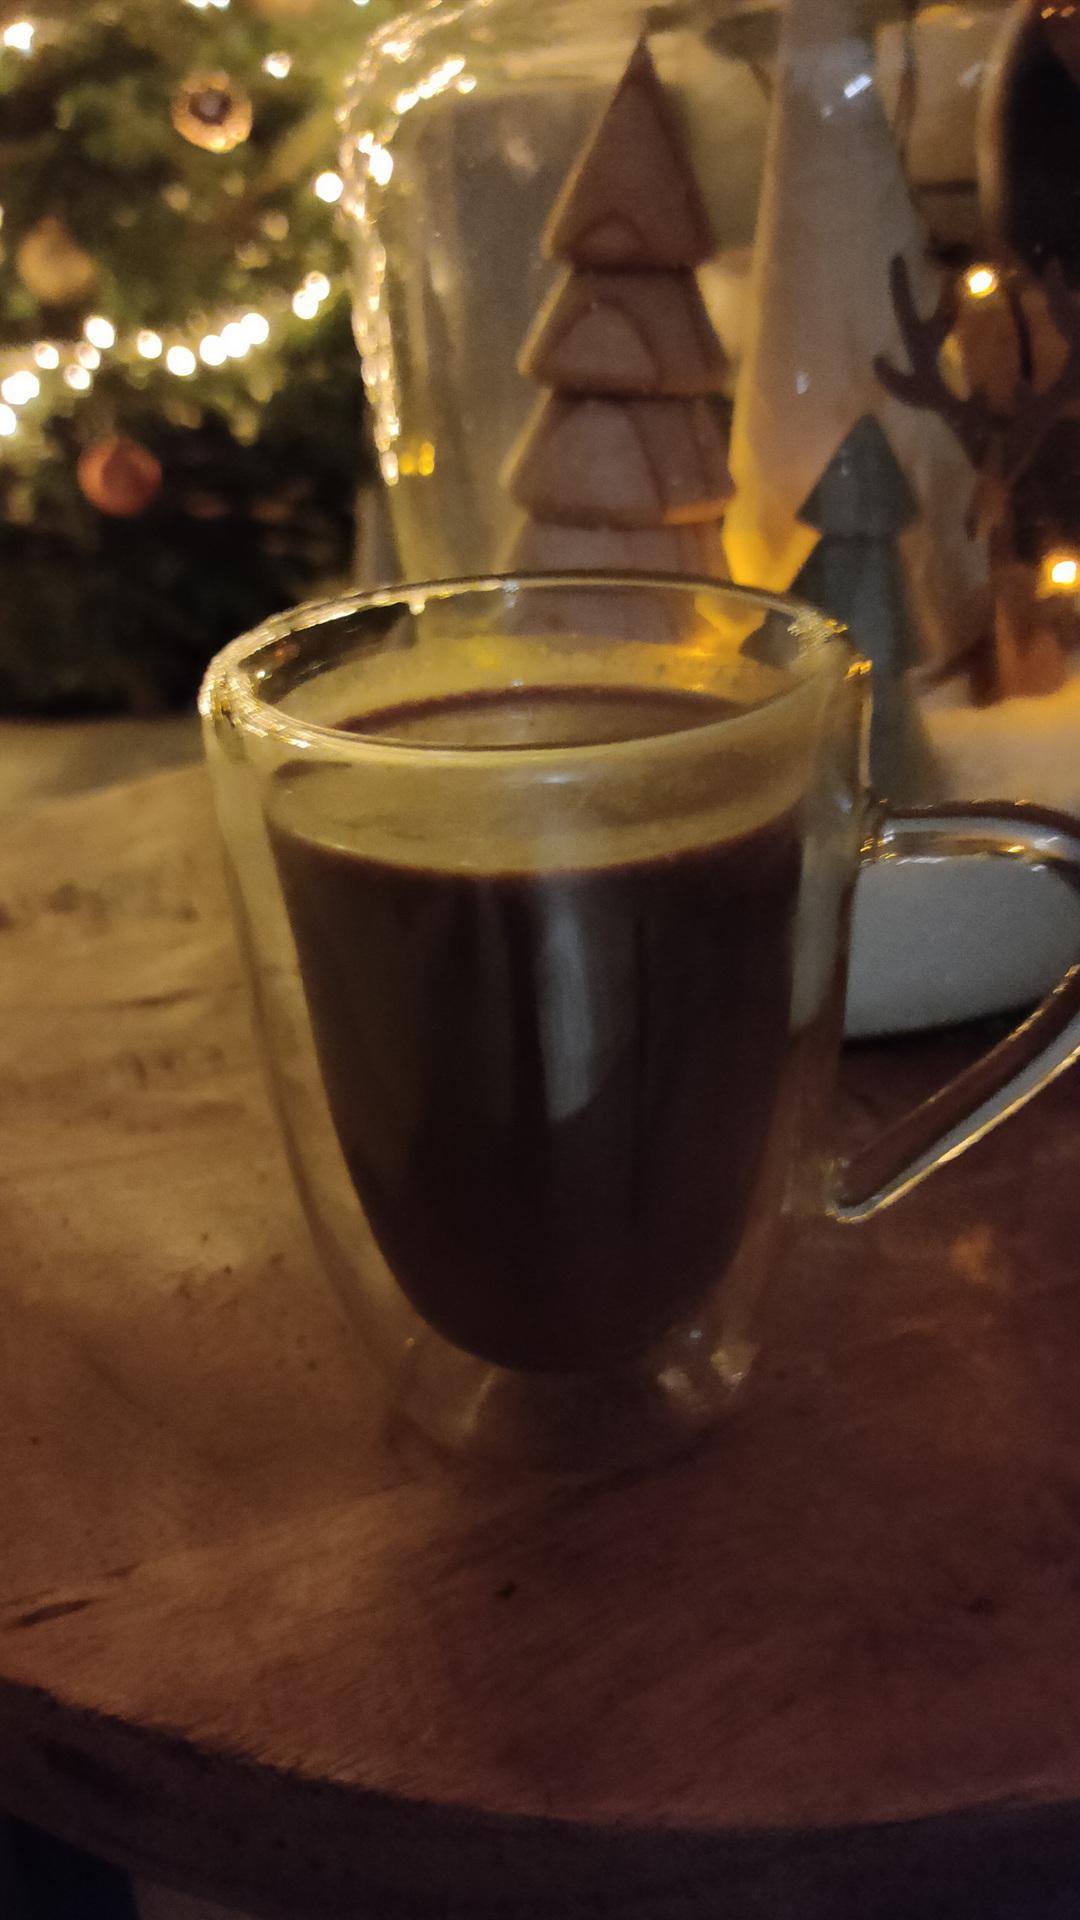
The problem with something so suggestive as taste .. it depends on your mood, time of day, the weather .. Also we started with a few, after that you really should revisit previously tasted coffees. Maybe they are worse, or better than you tasted after that.
Maybe i have a Winter Coffee … or a hangover coffee, who knows.
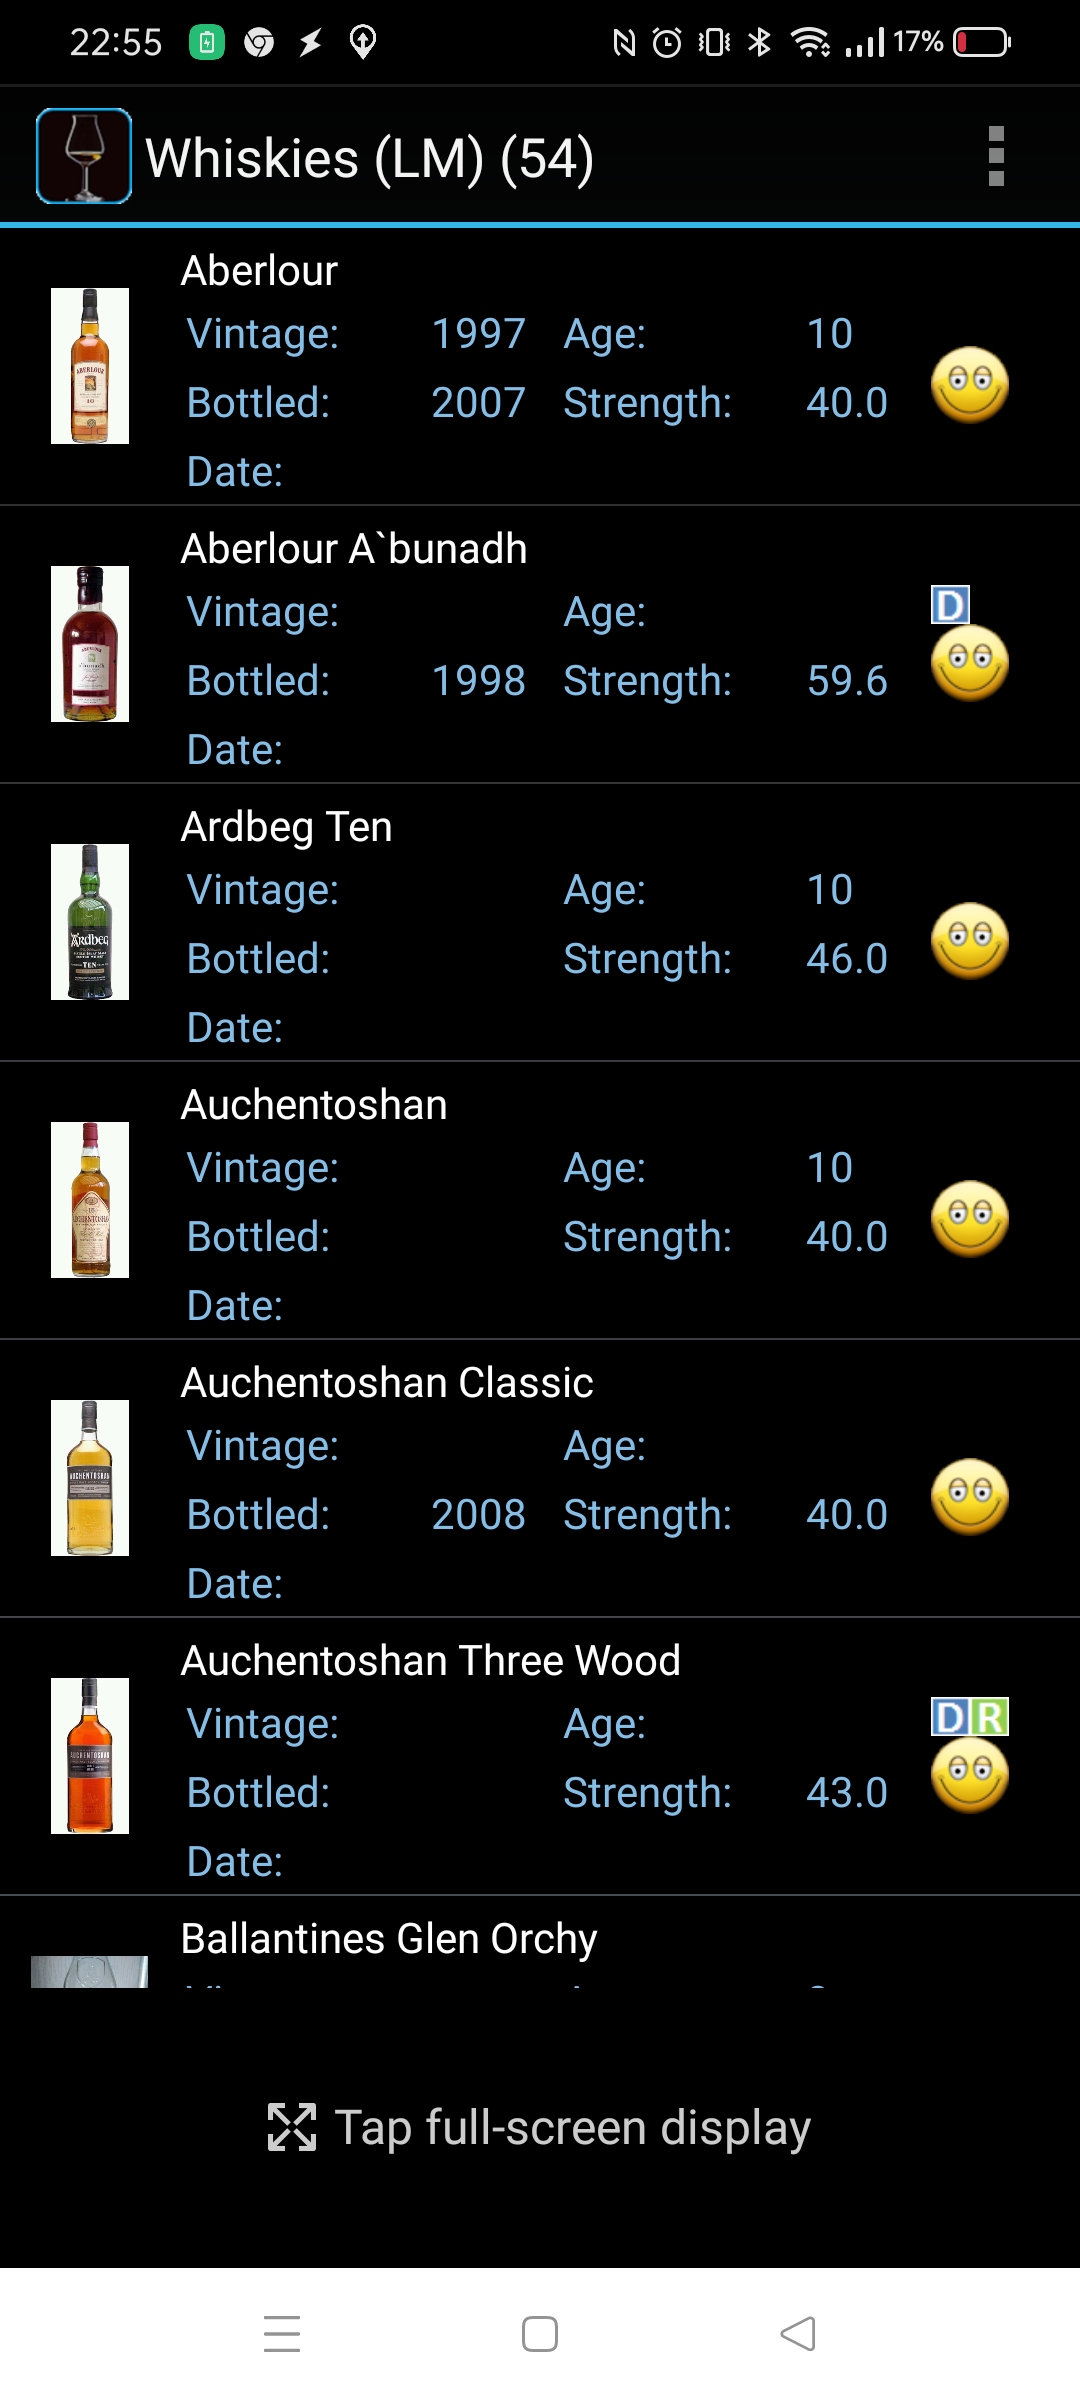
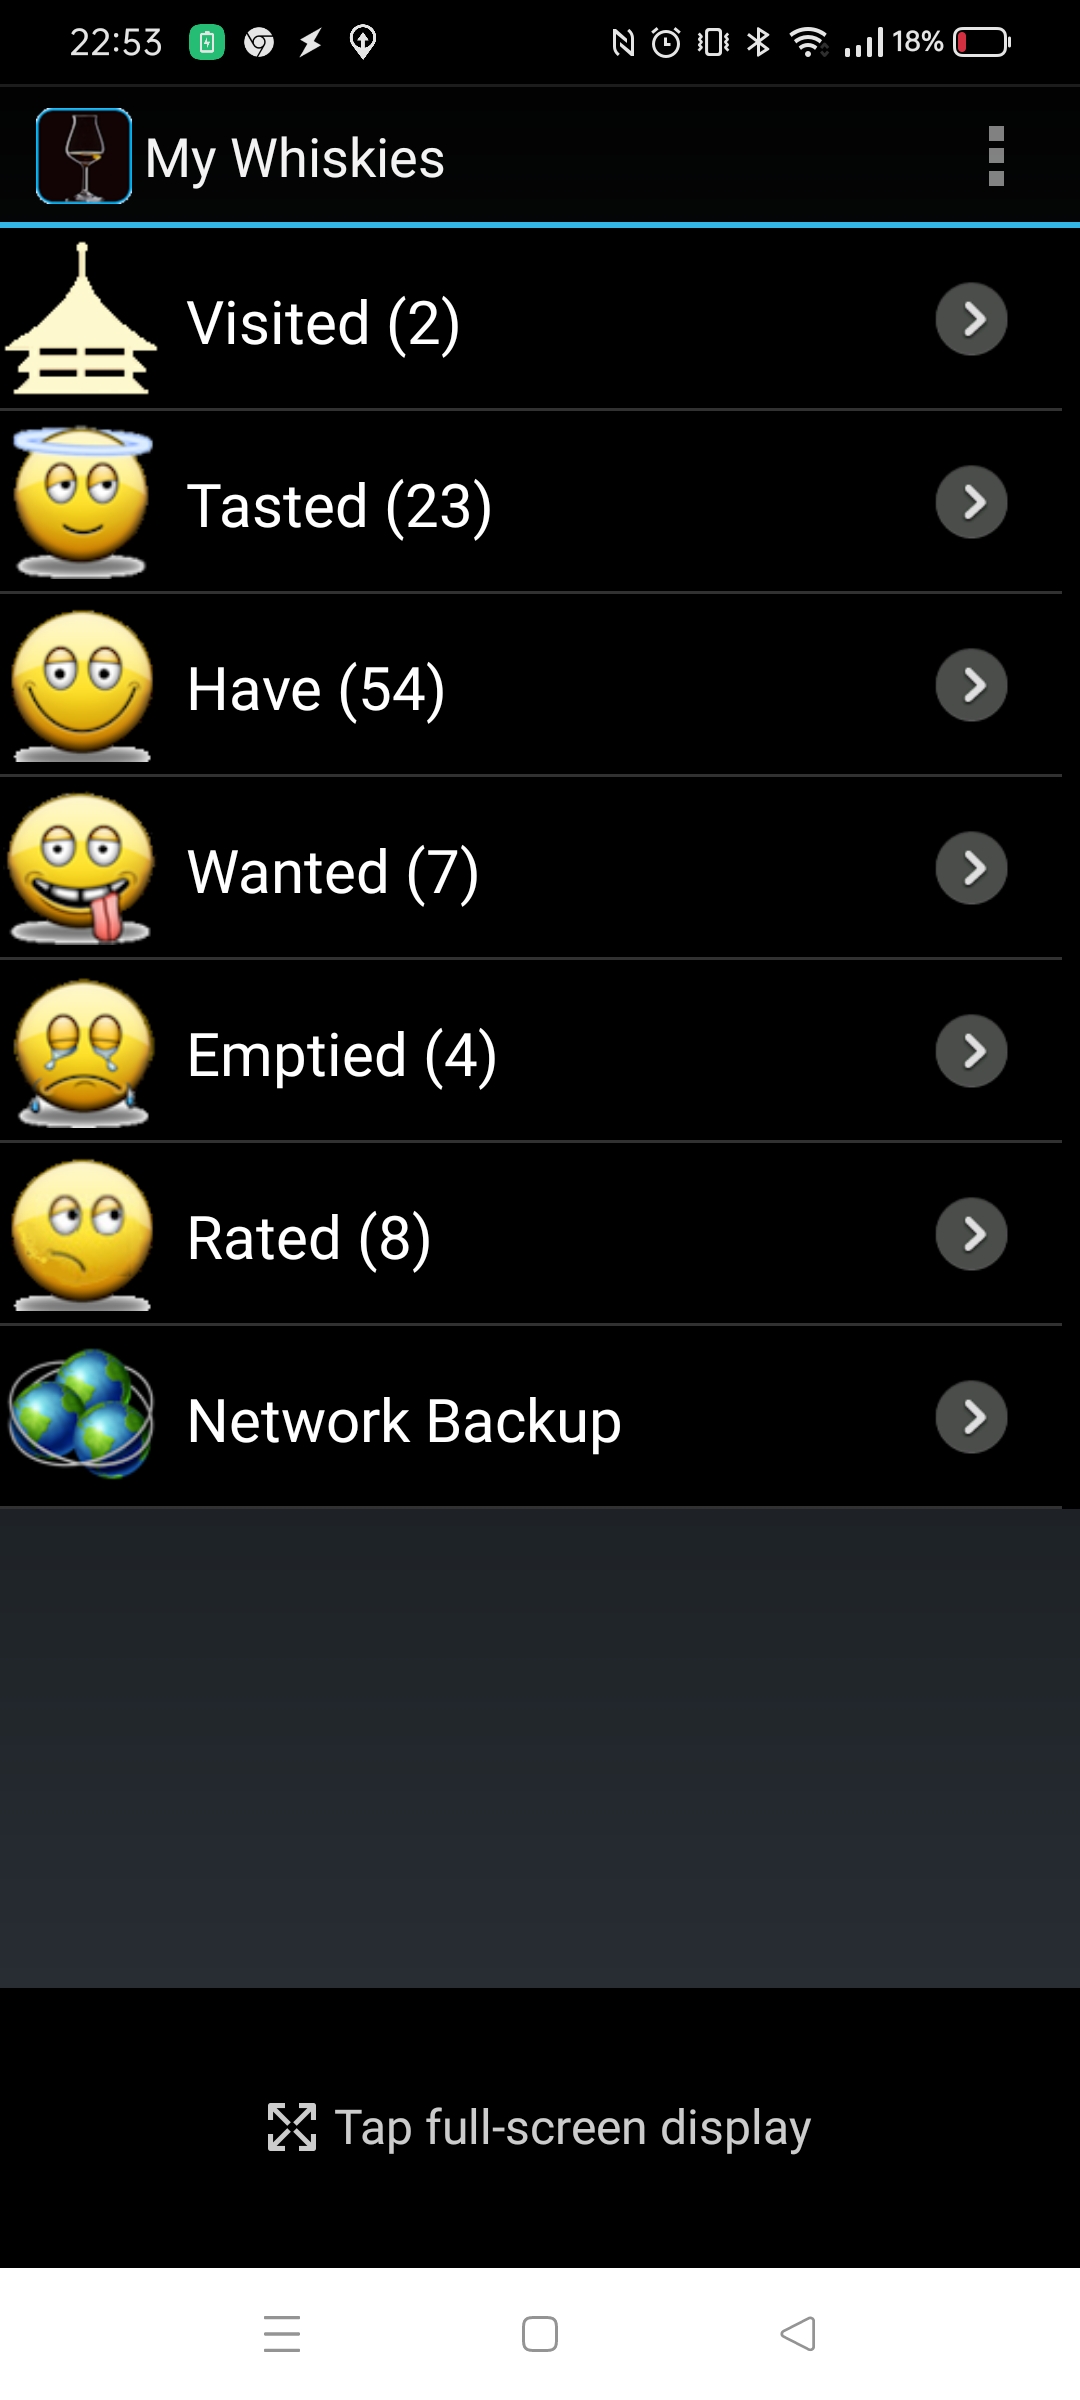
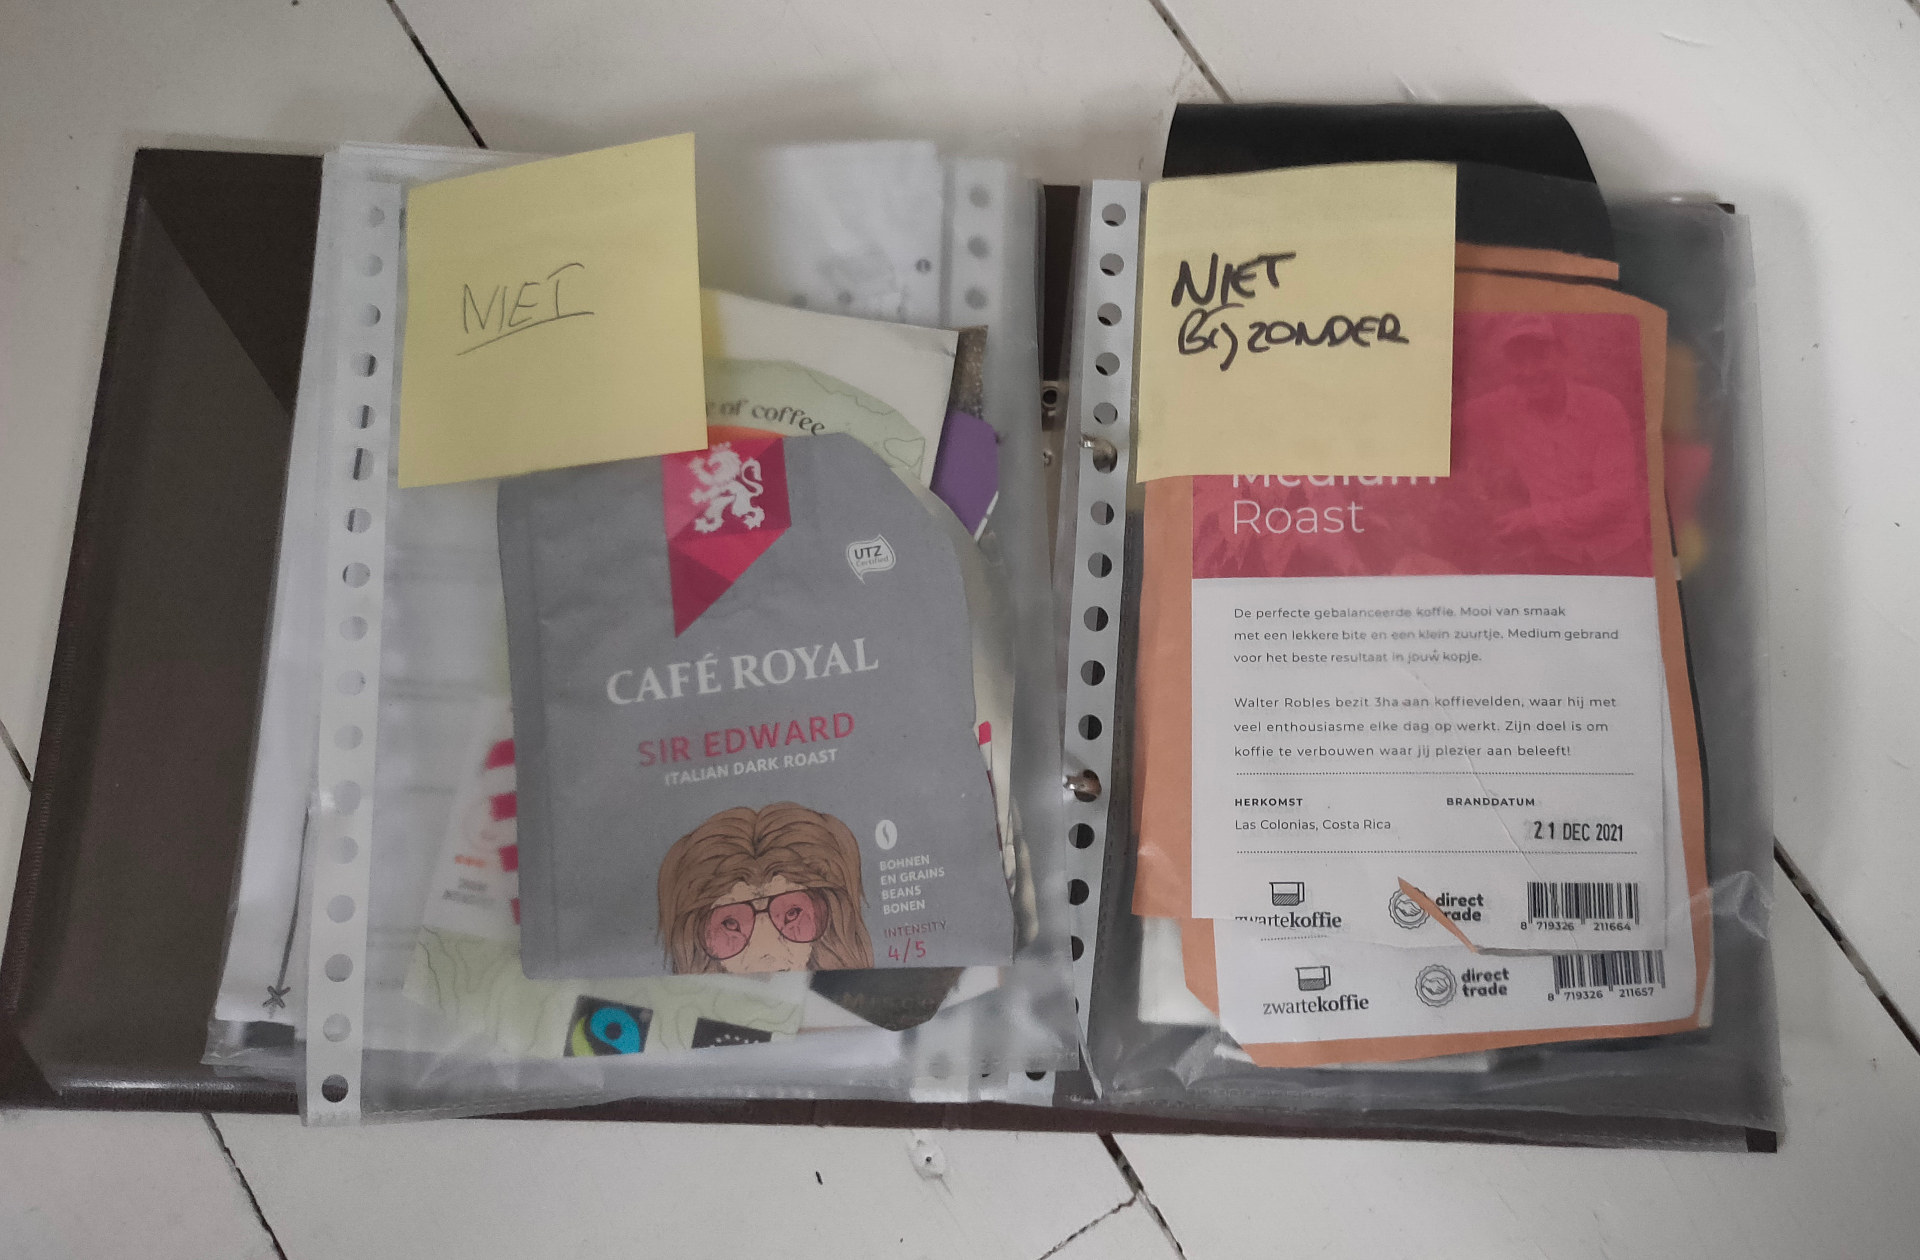
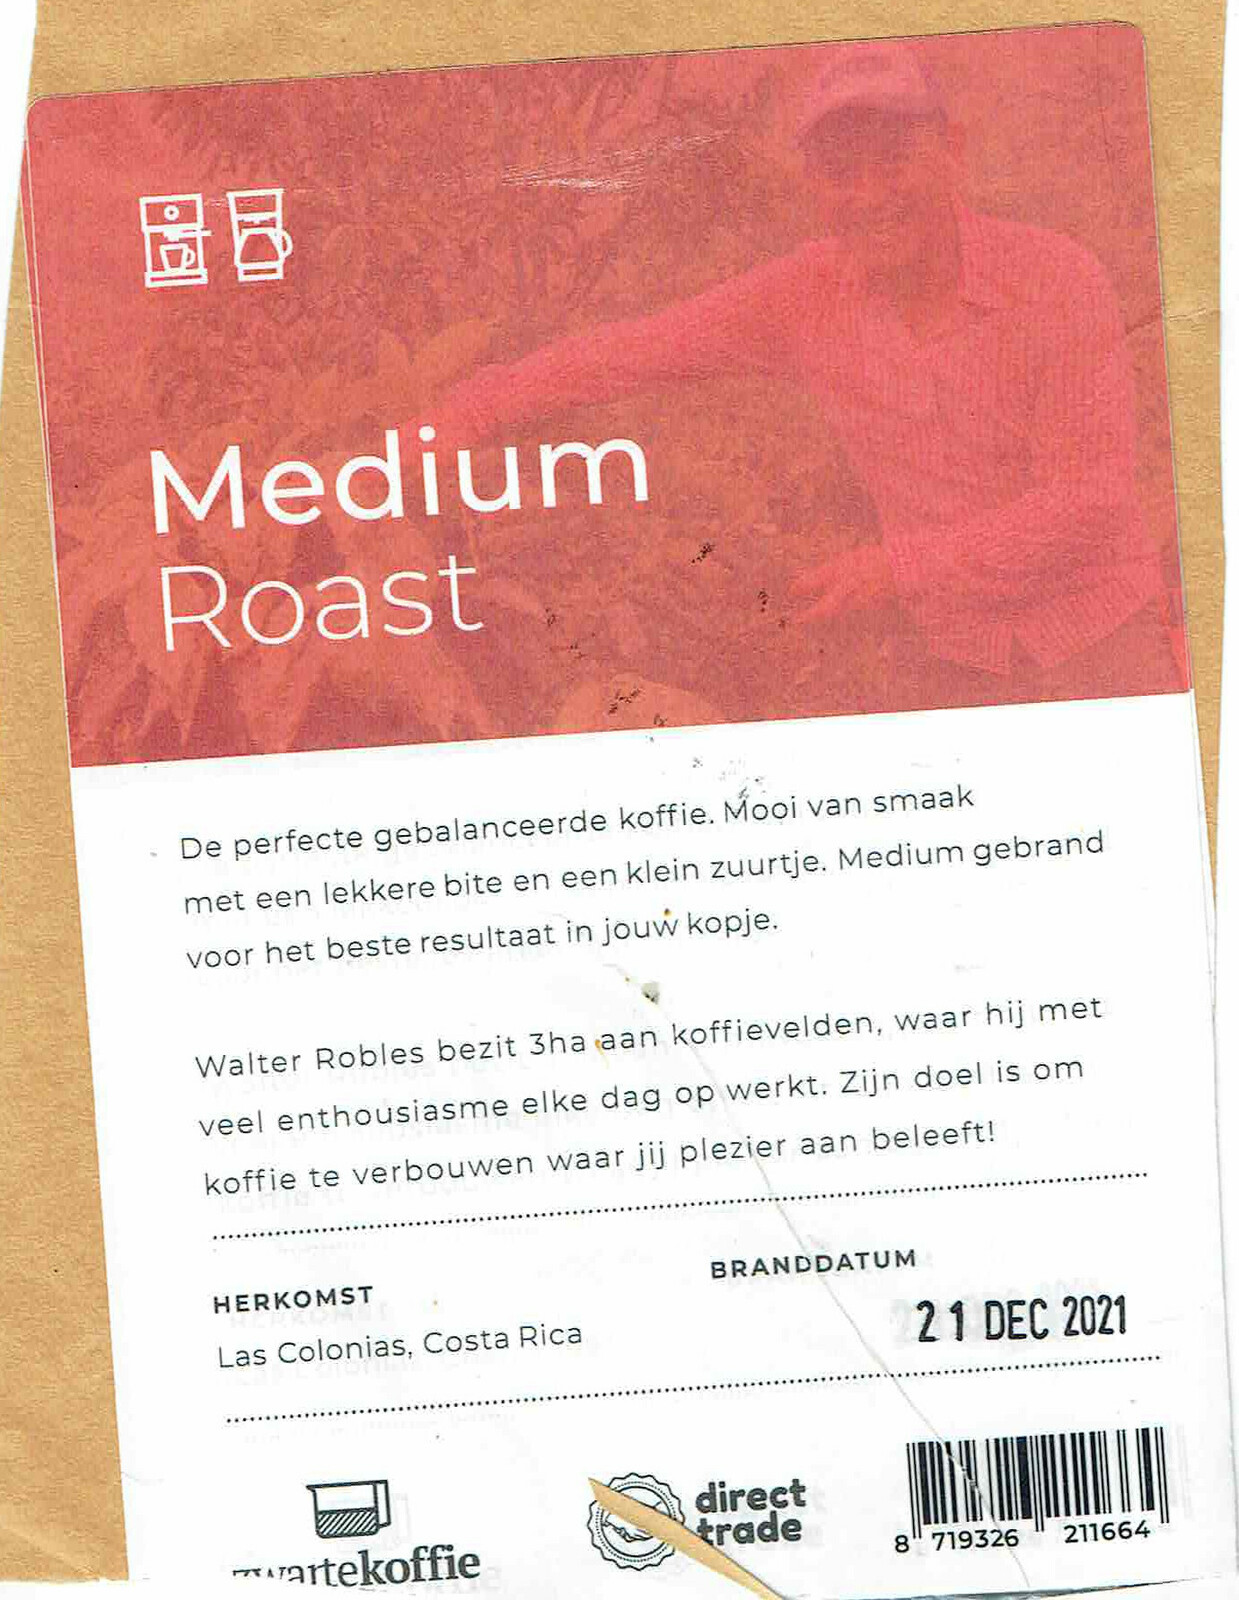
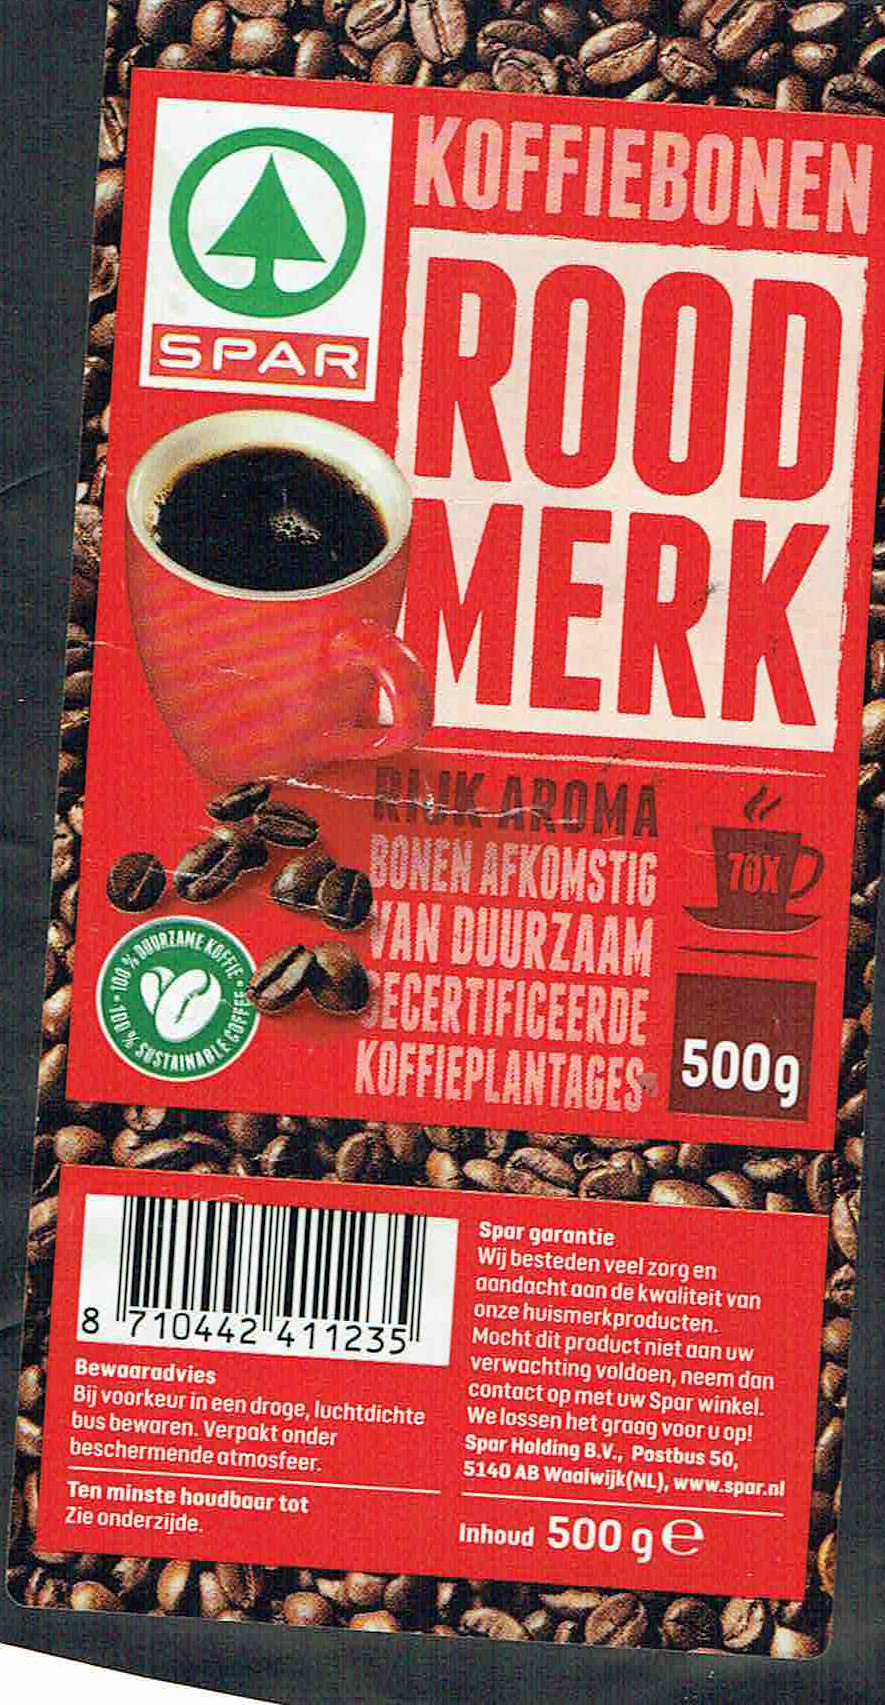
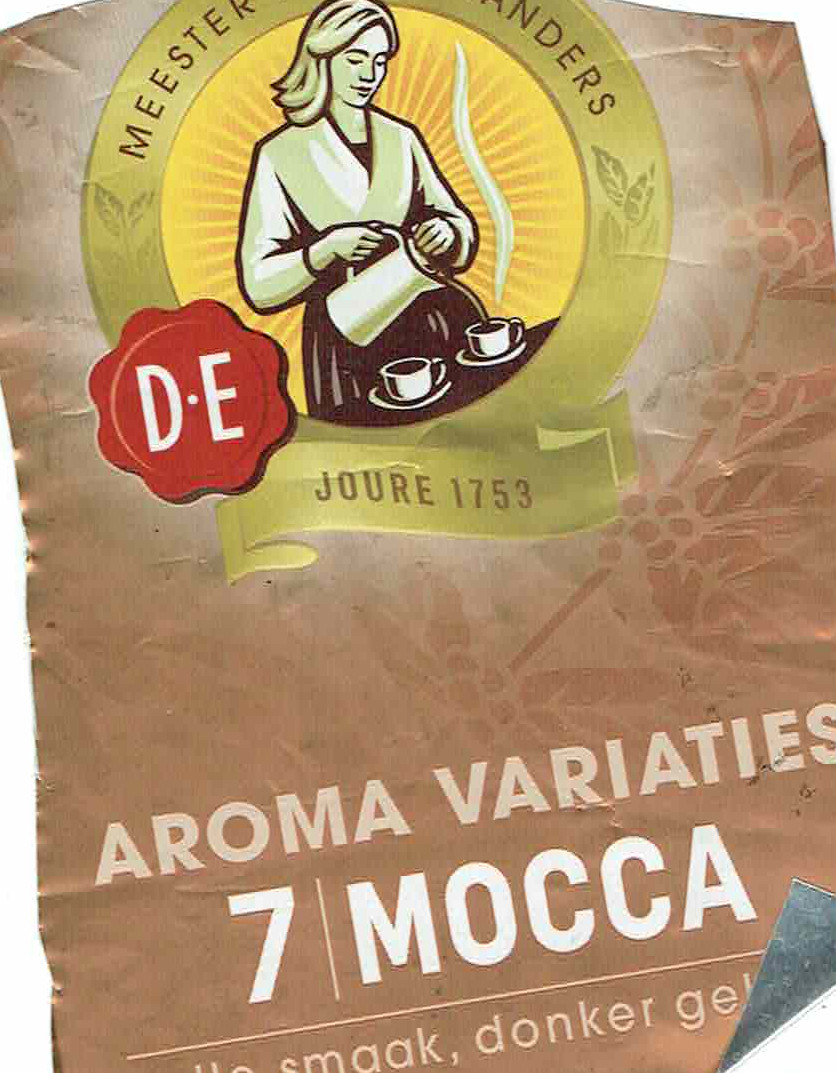
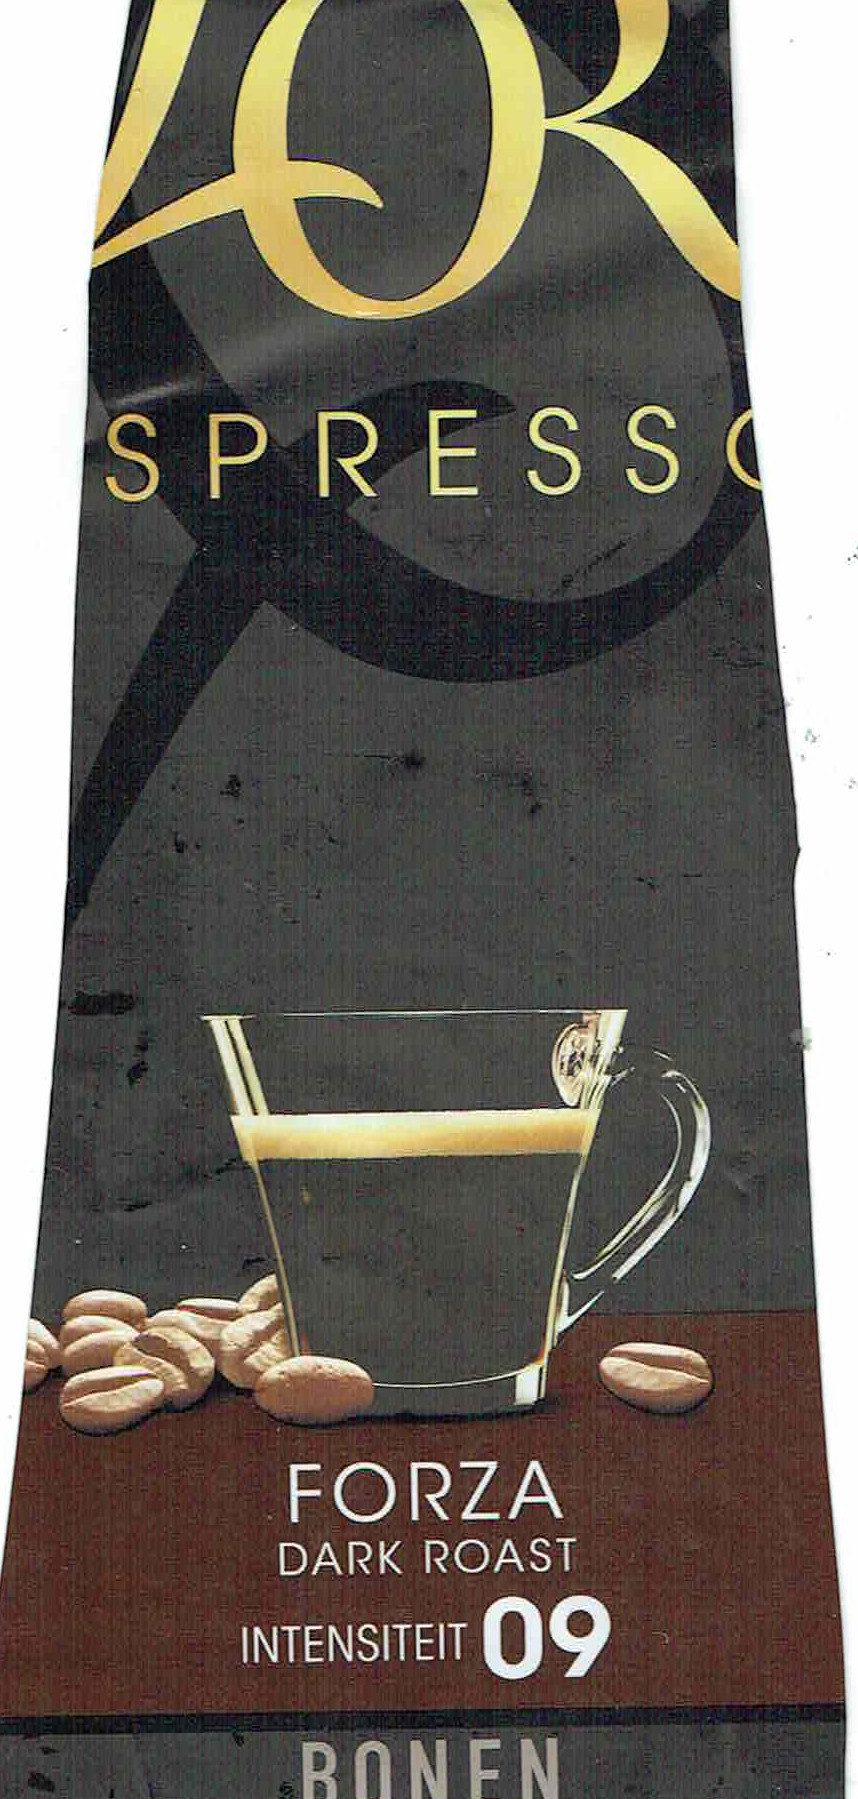
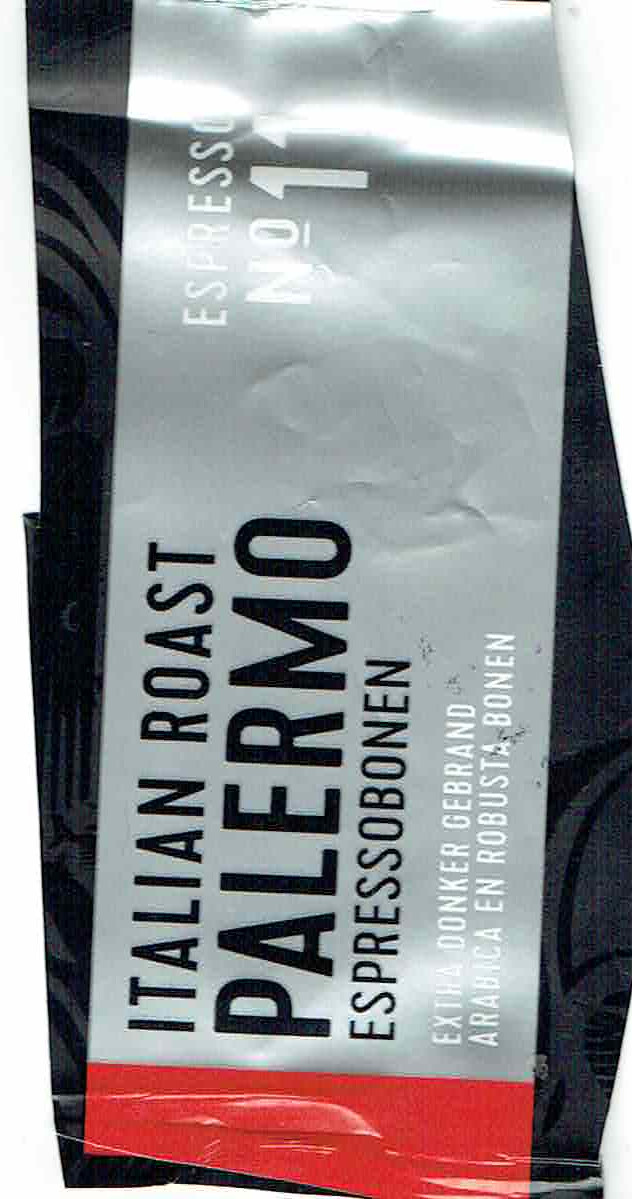
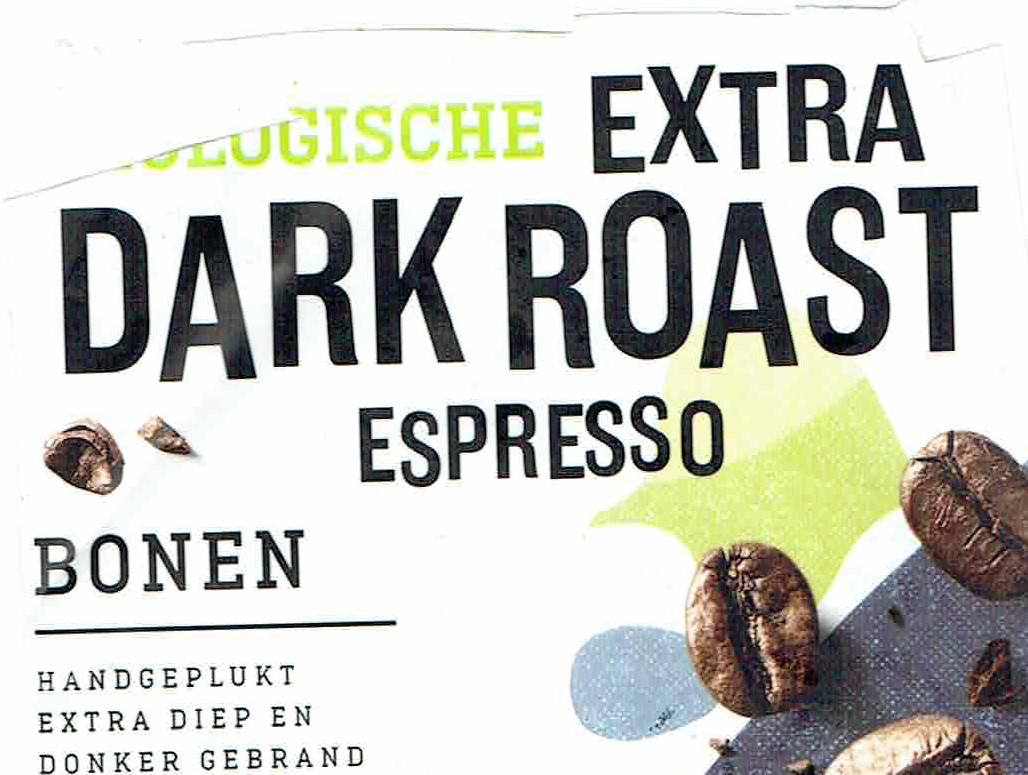
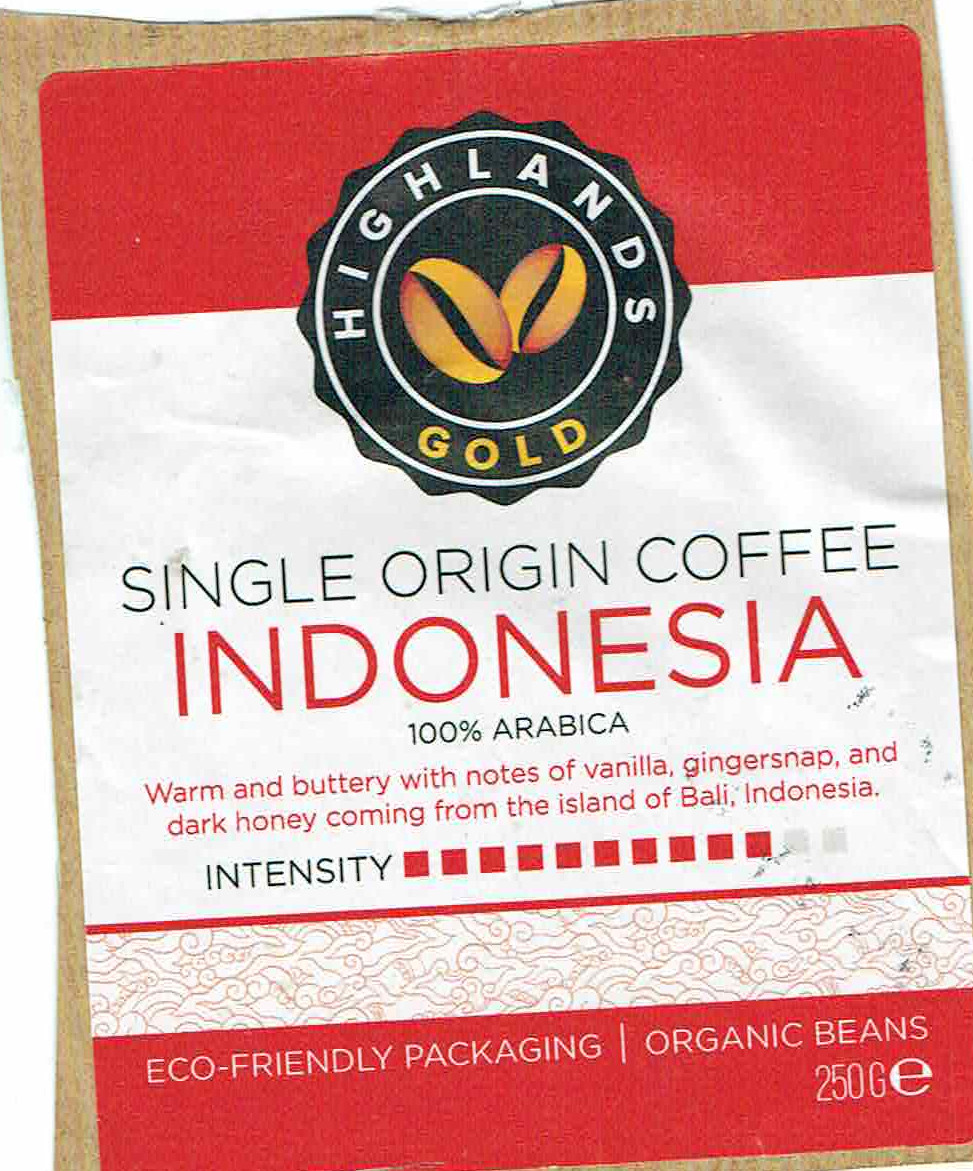
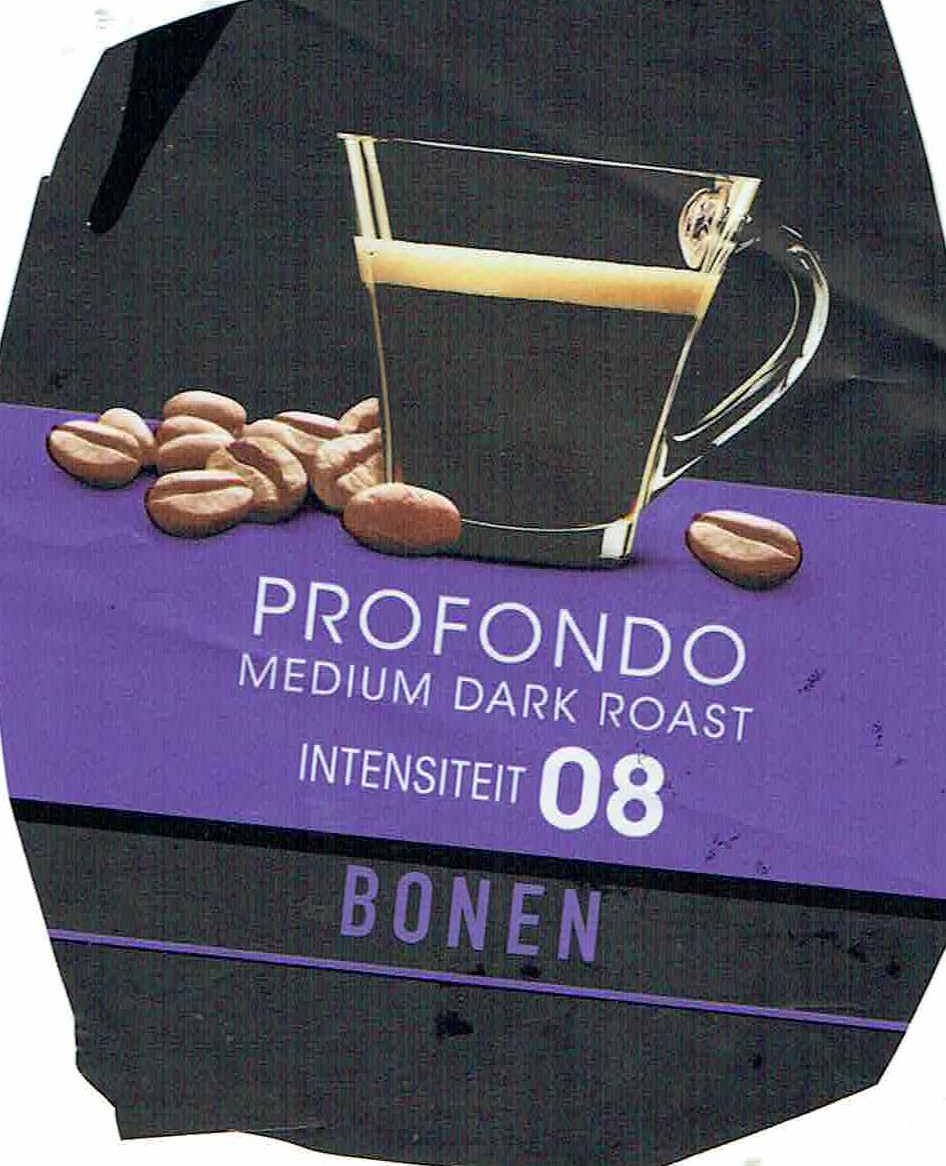
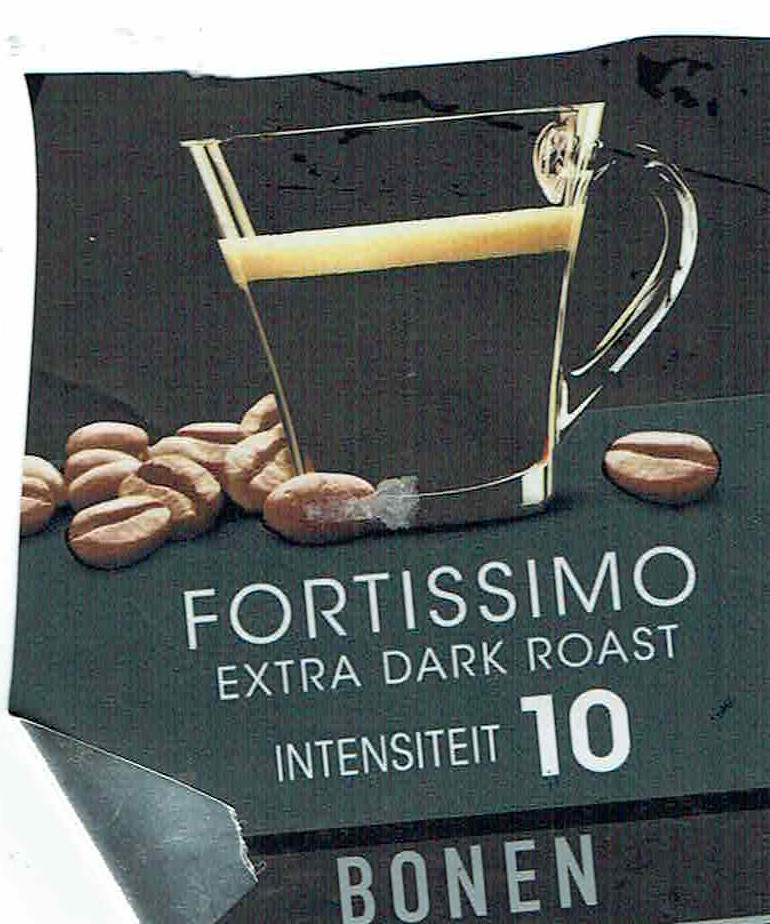
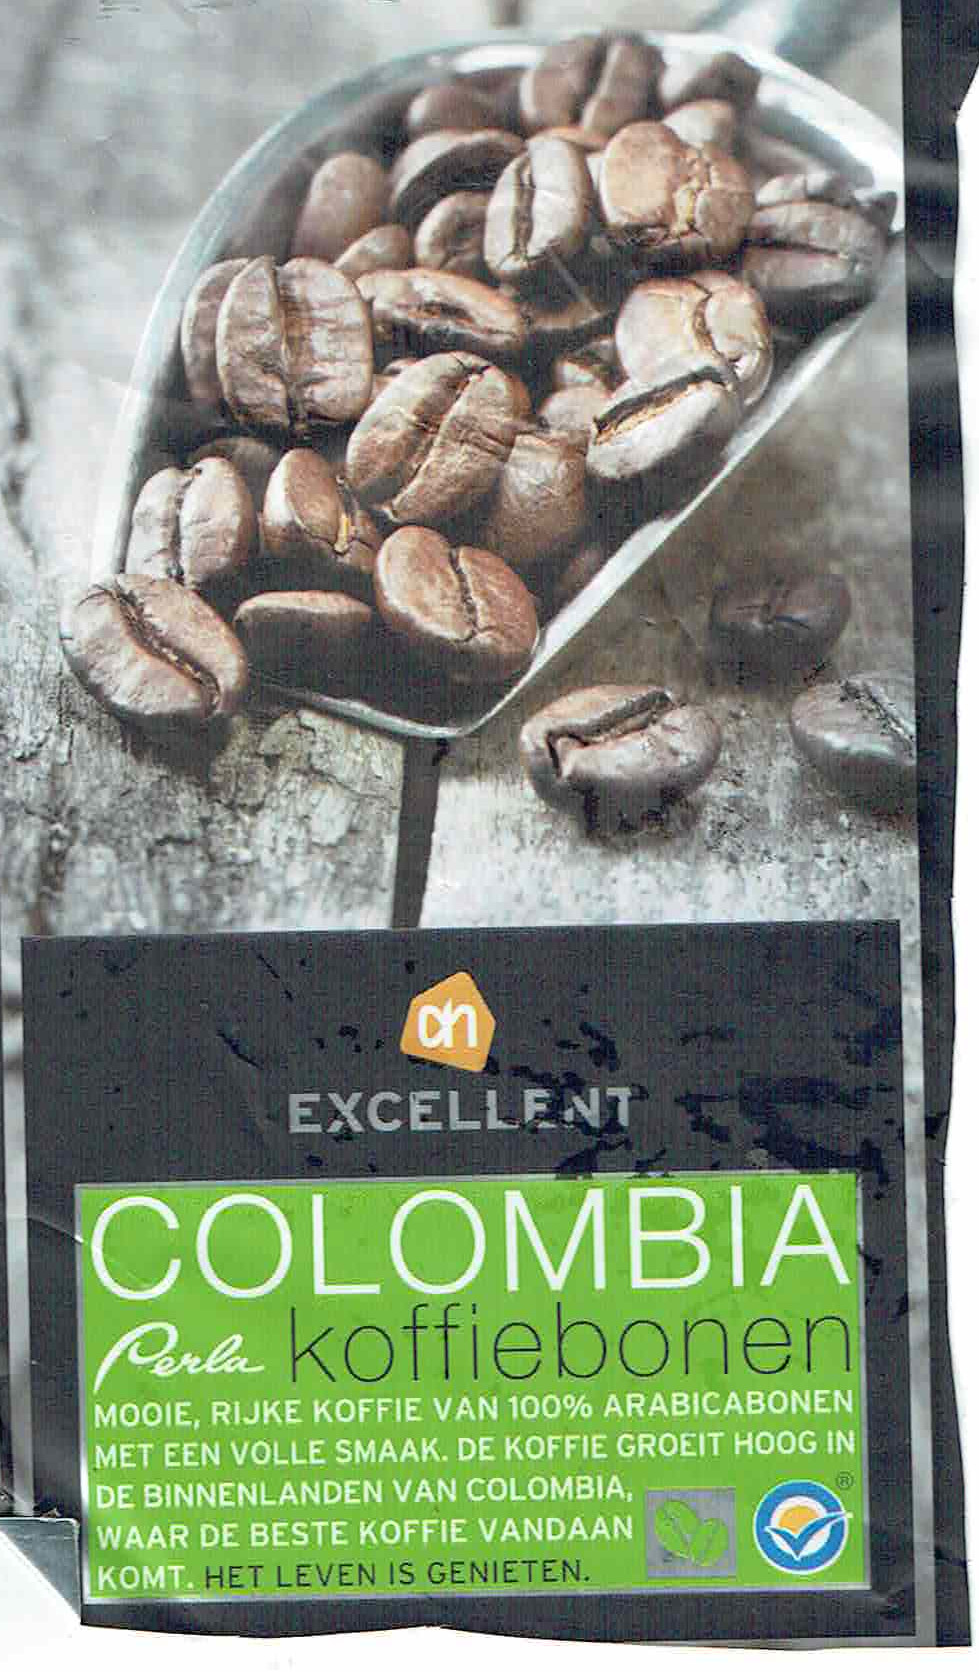
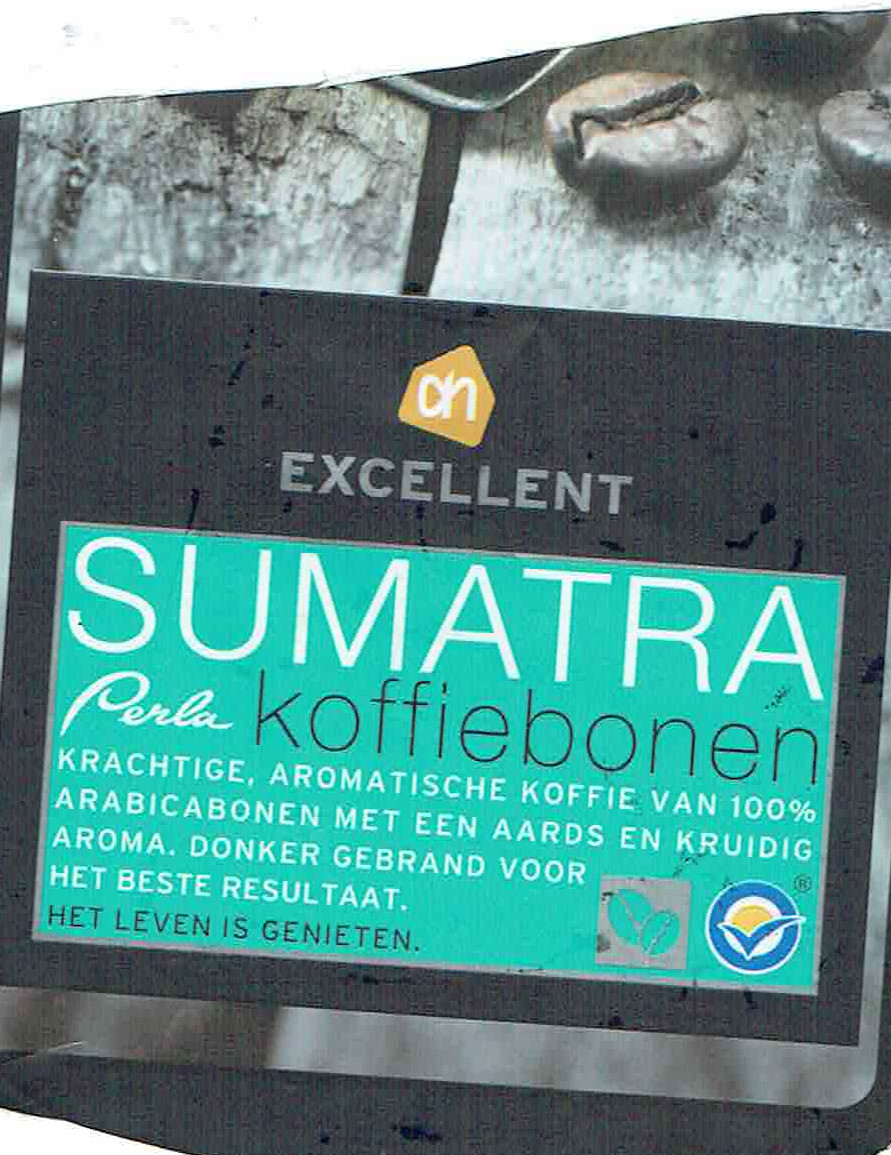
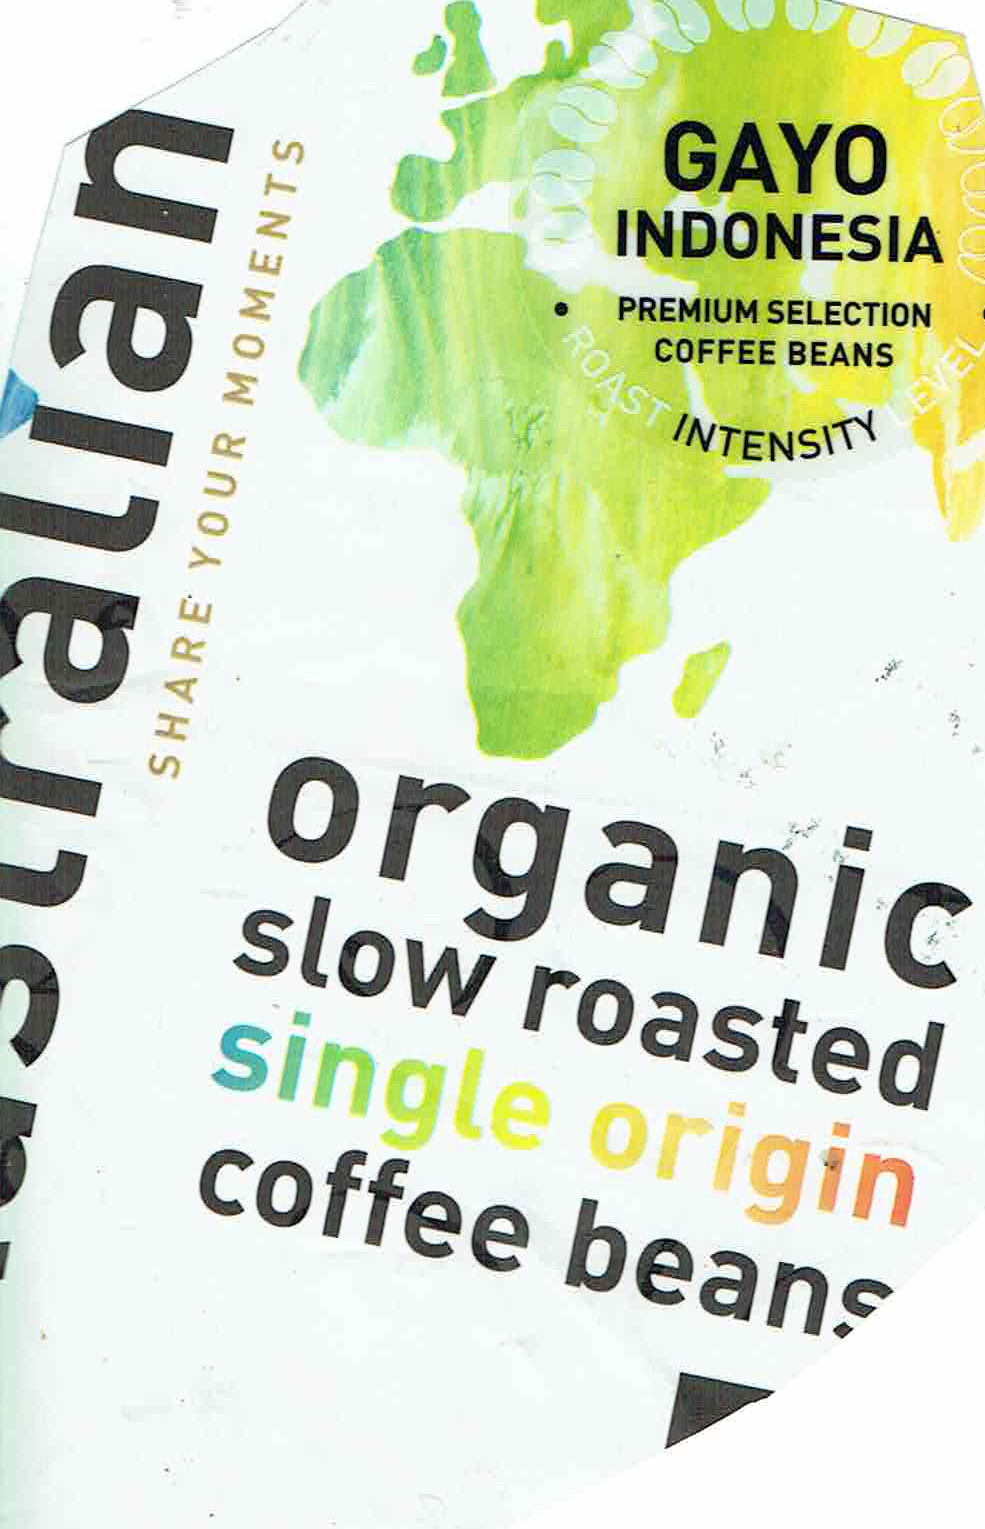
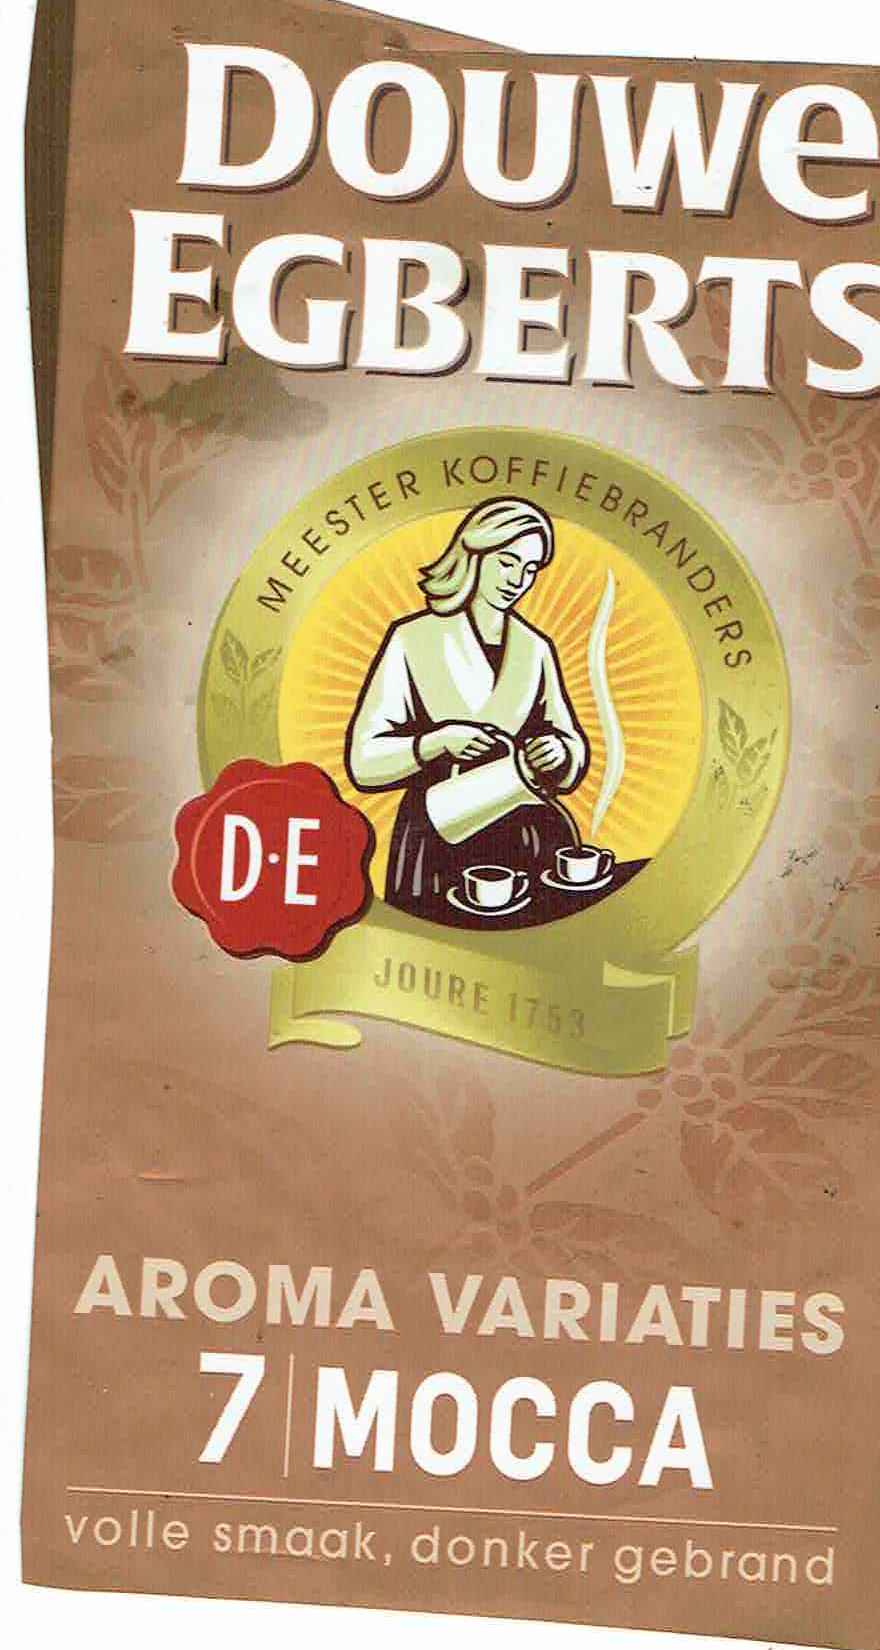
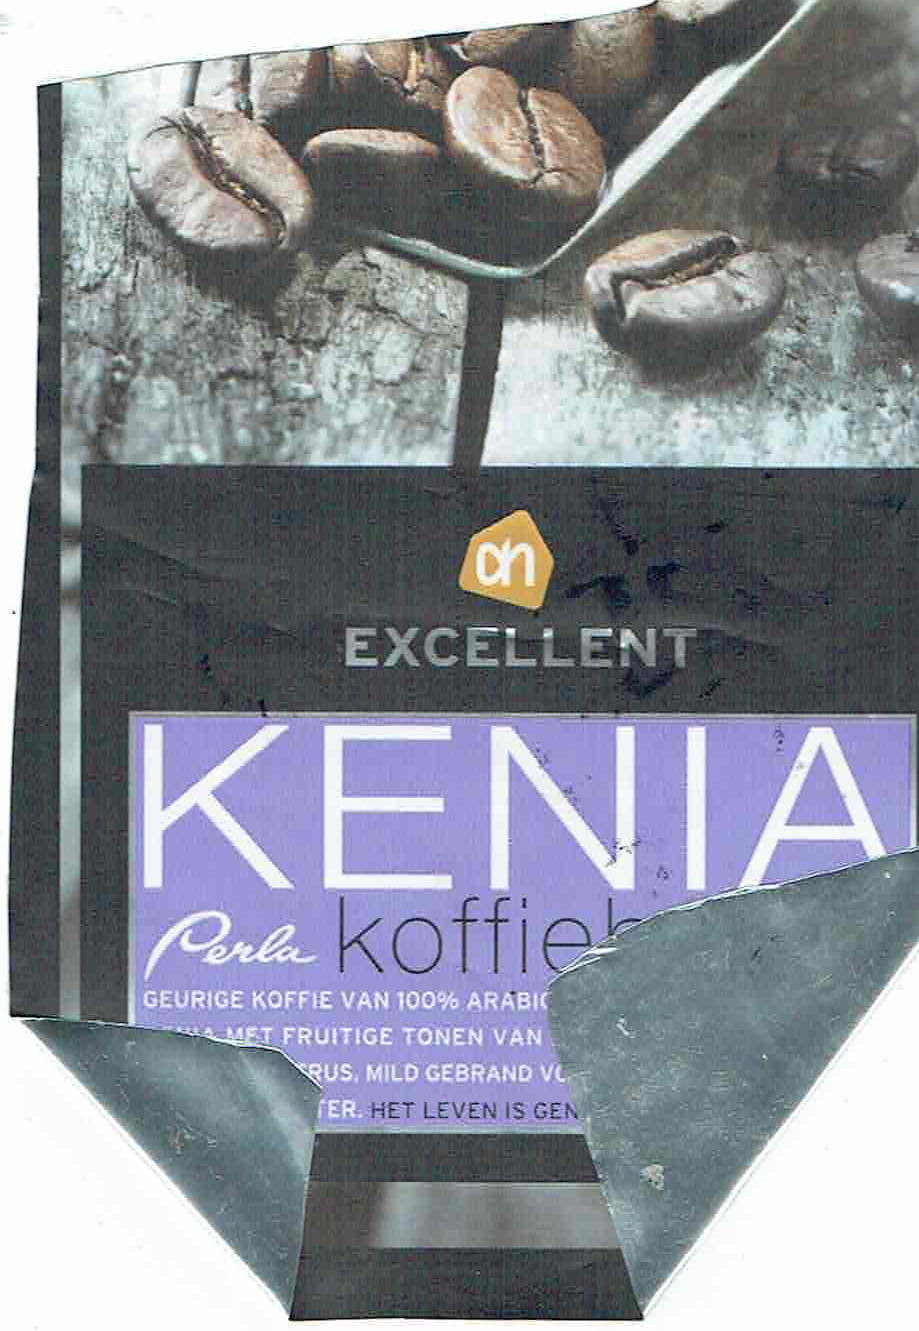
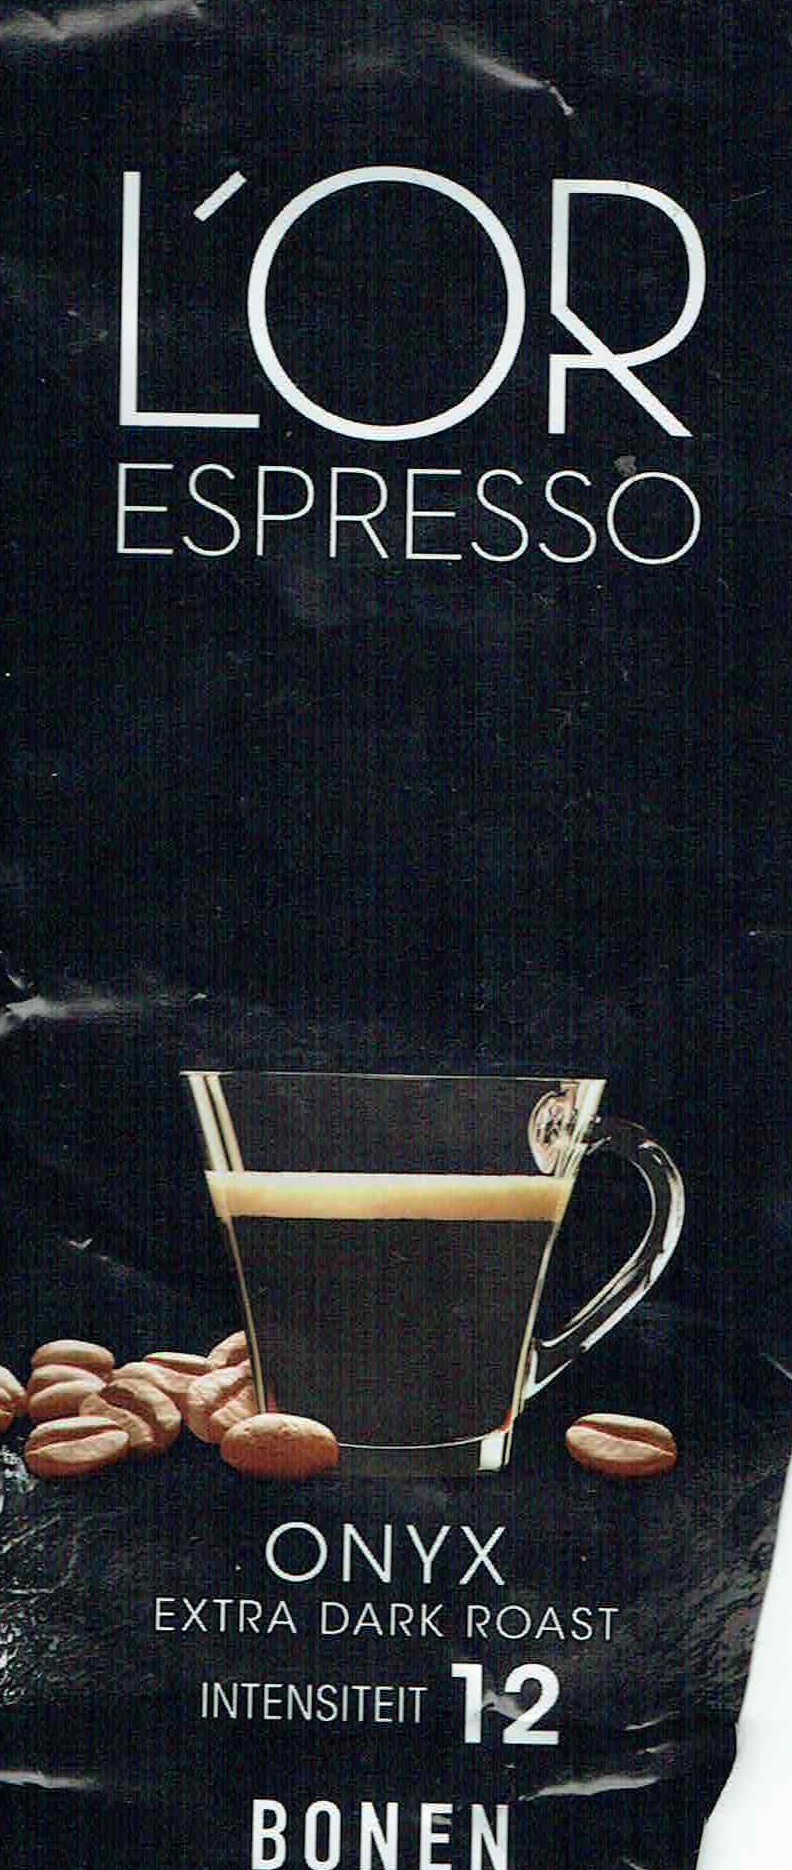
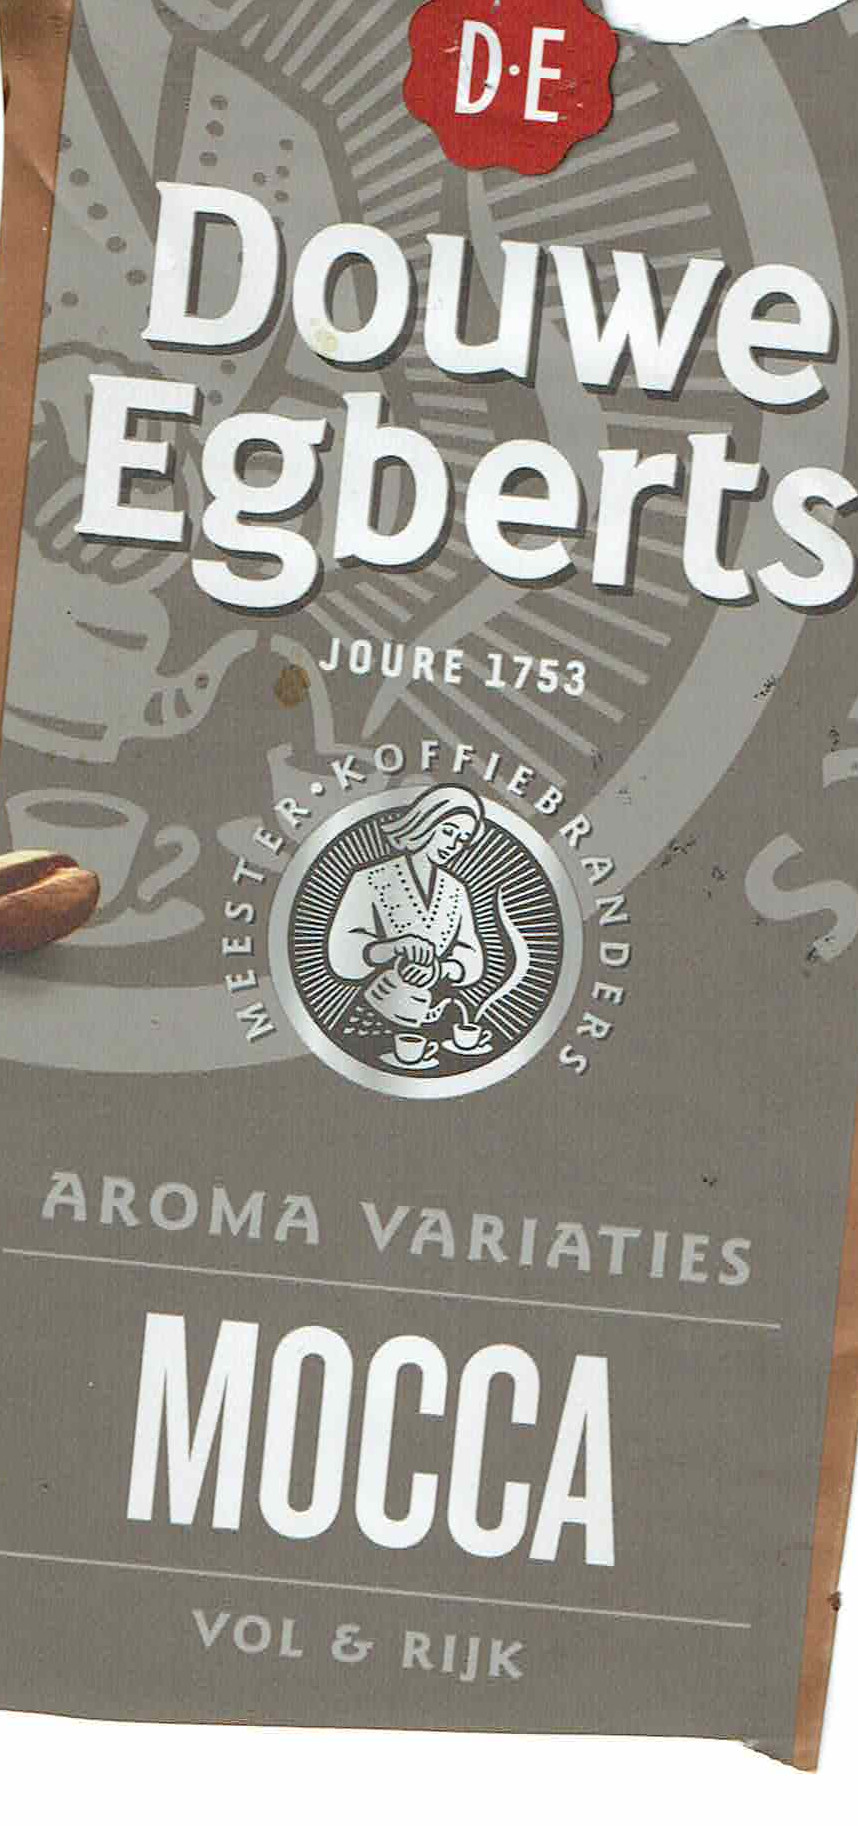
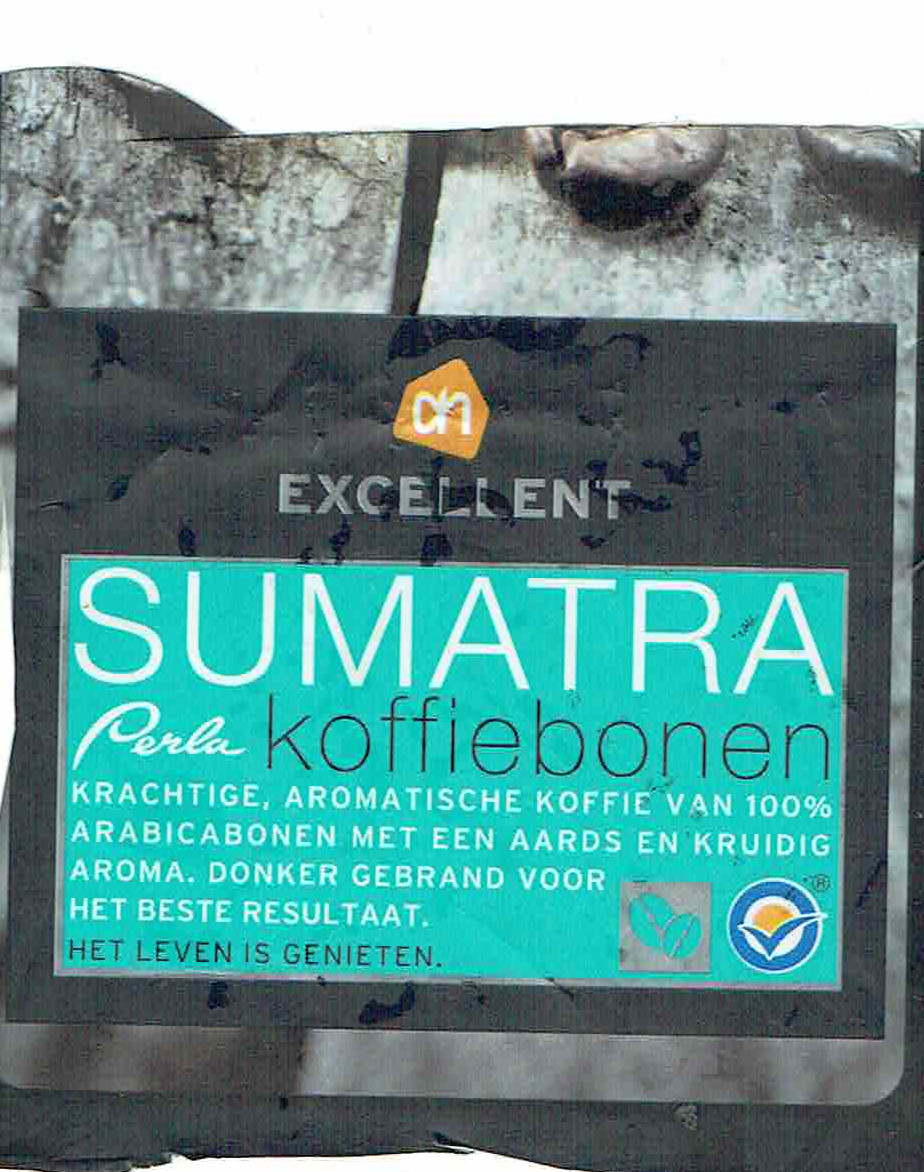
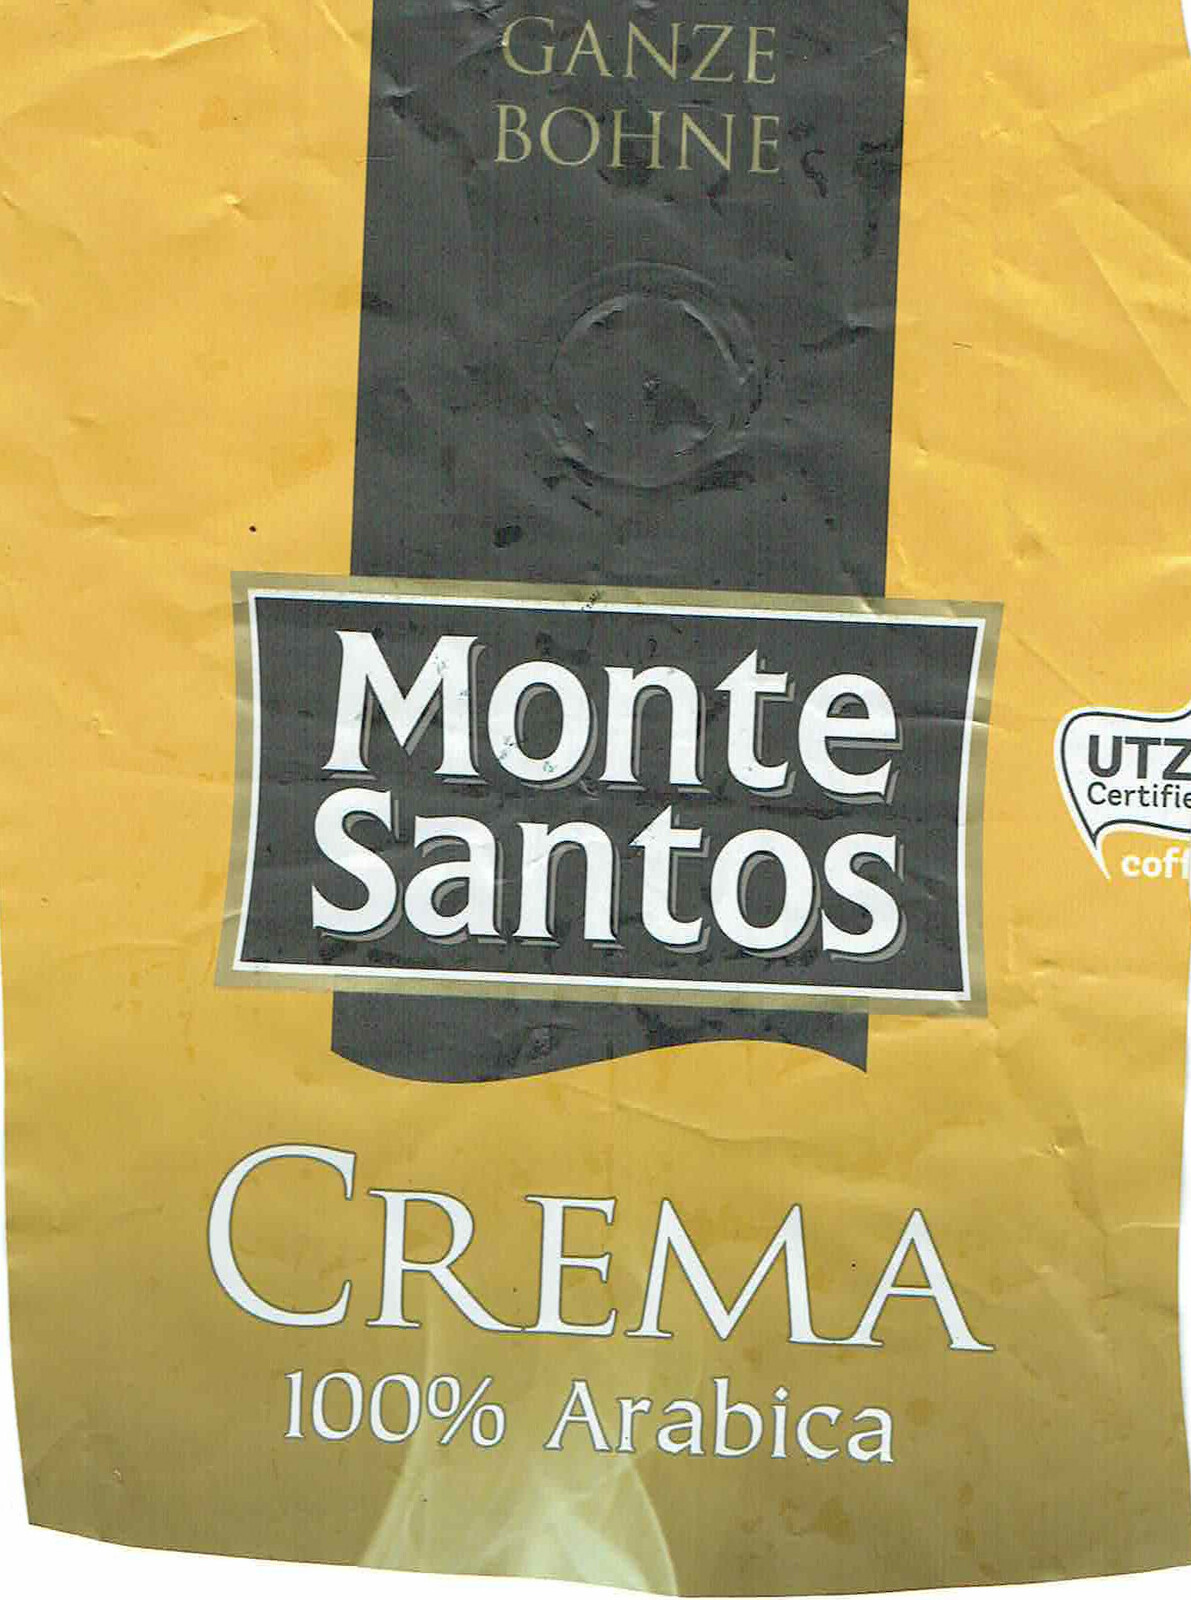
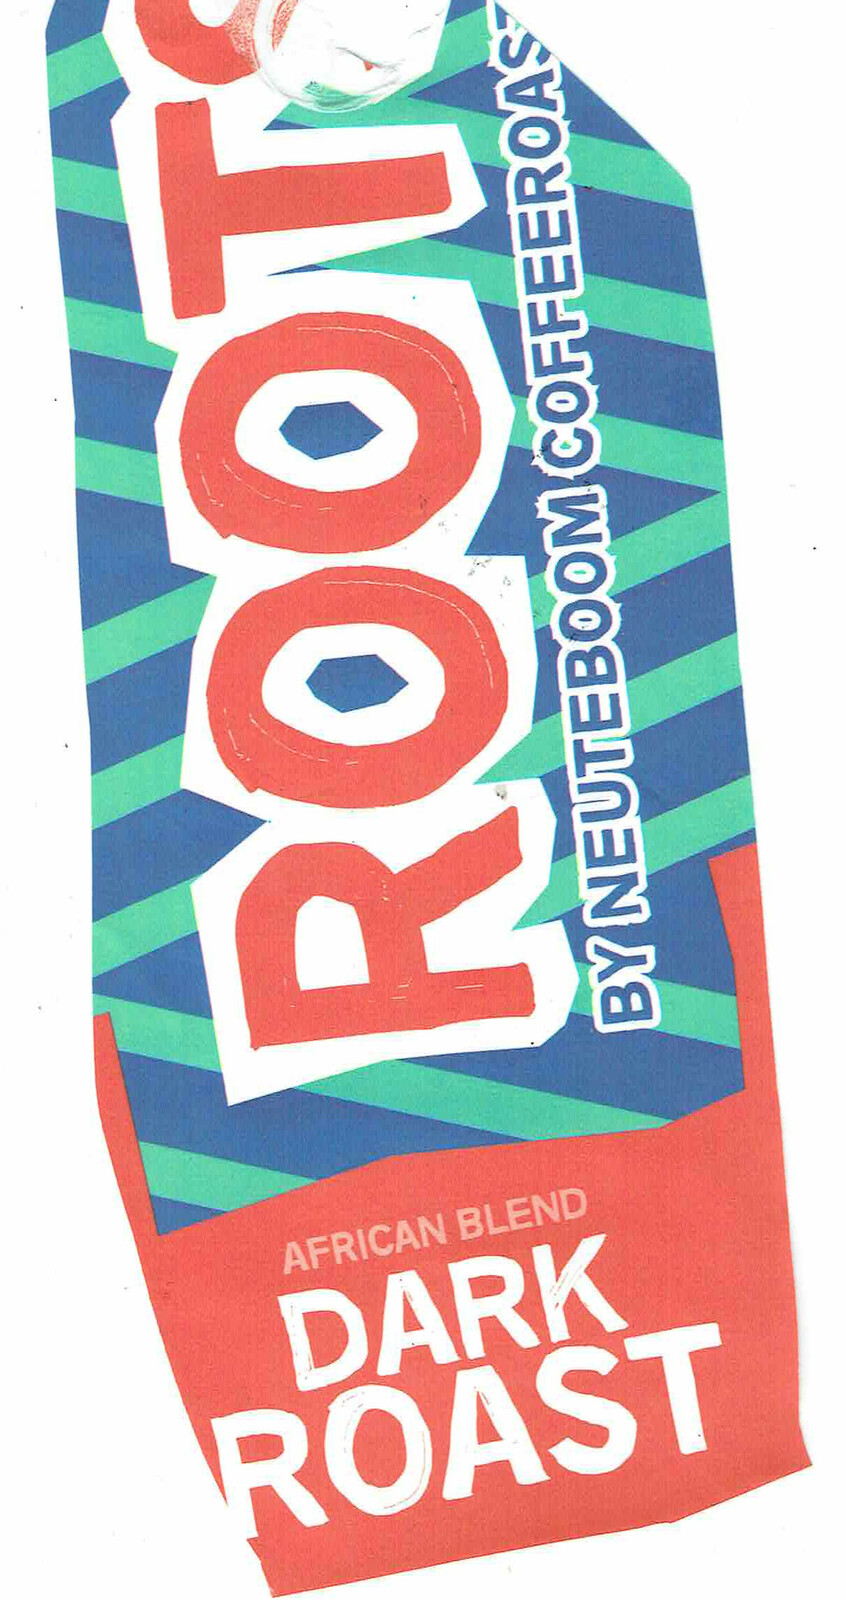
But here are the ones we’ve sorted. (Maybe there are ones in multiple categories .. )
Maybe i have to look at countries, brands, the family of beans being used, and how the beans are roasted. I’ll have to revisit this post
We didn’t like
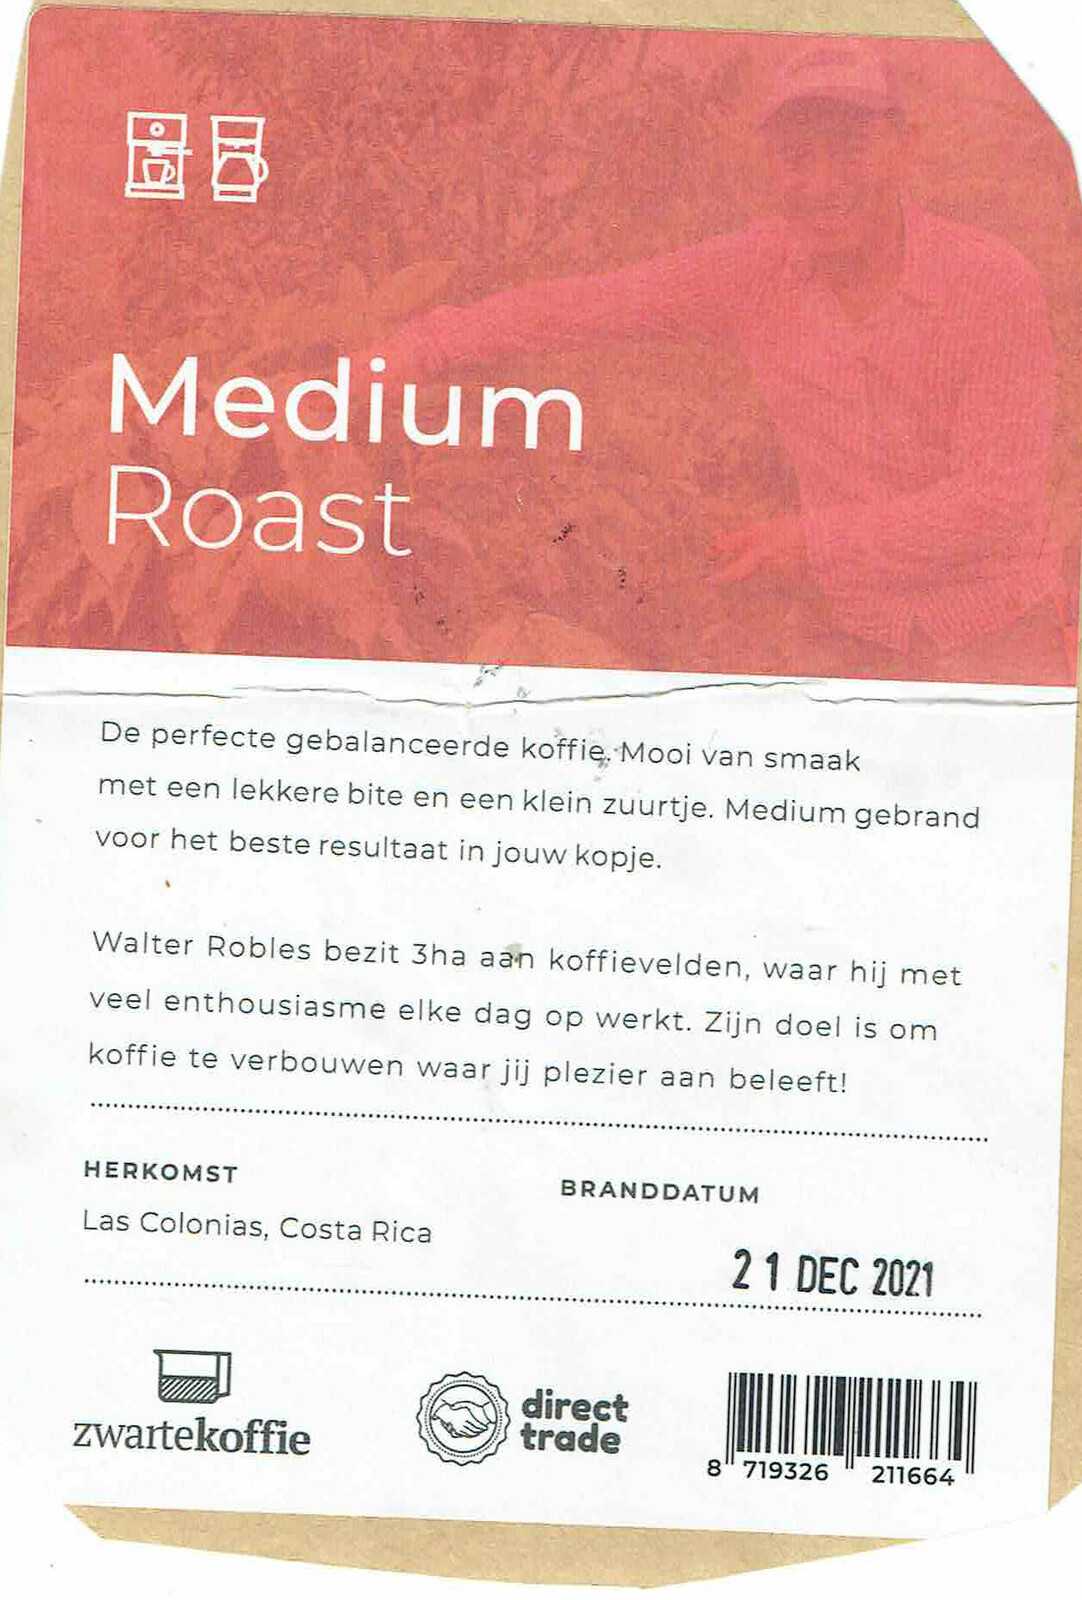
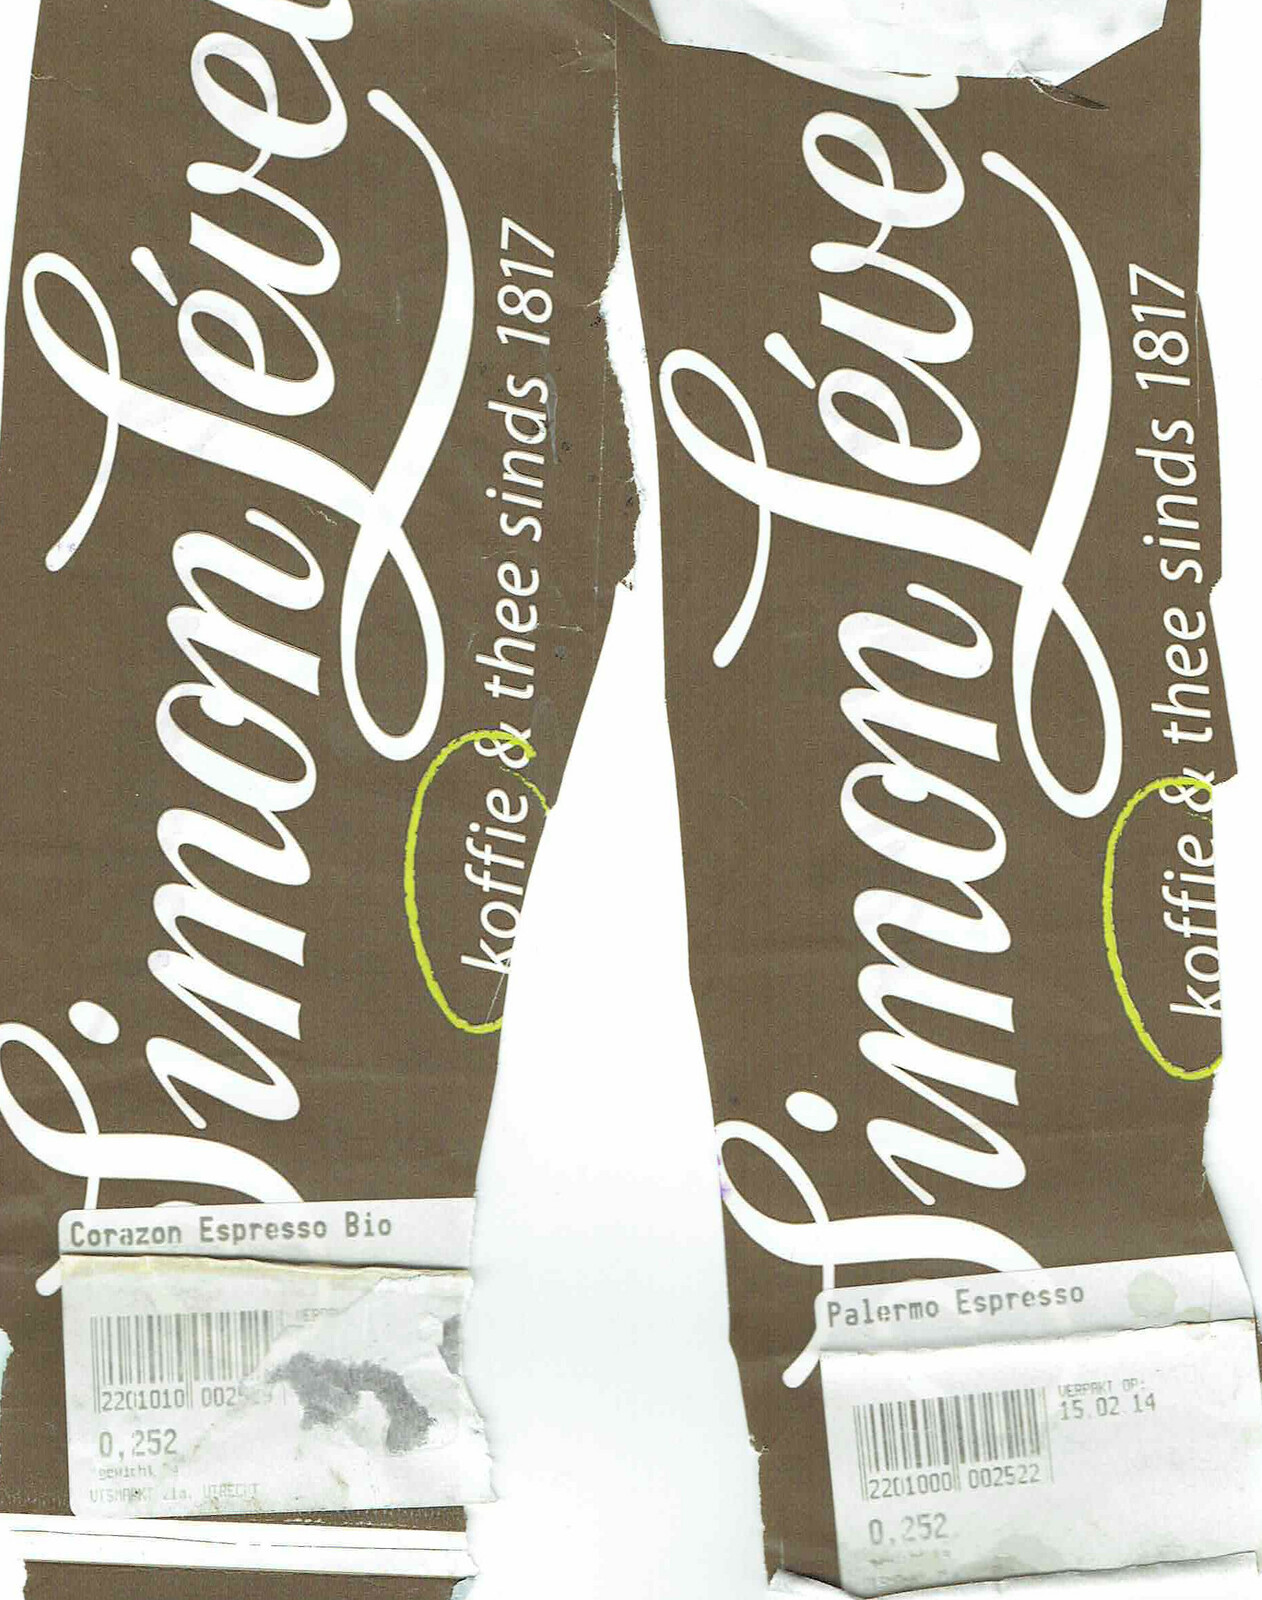
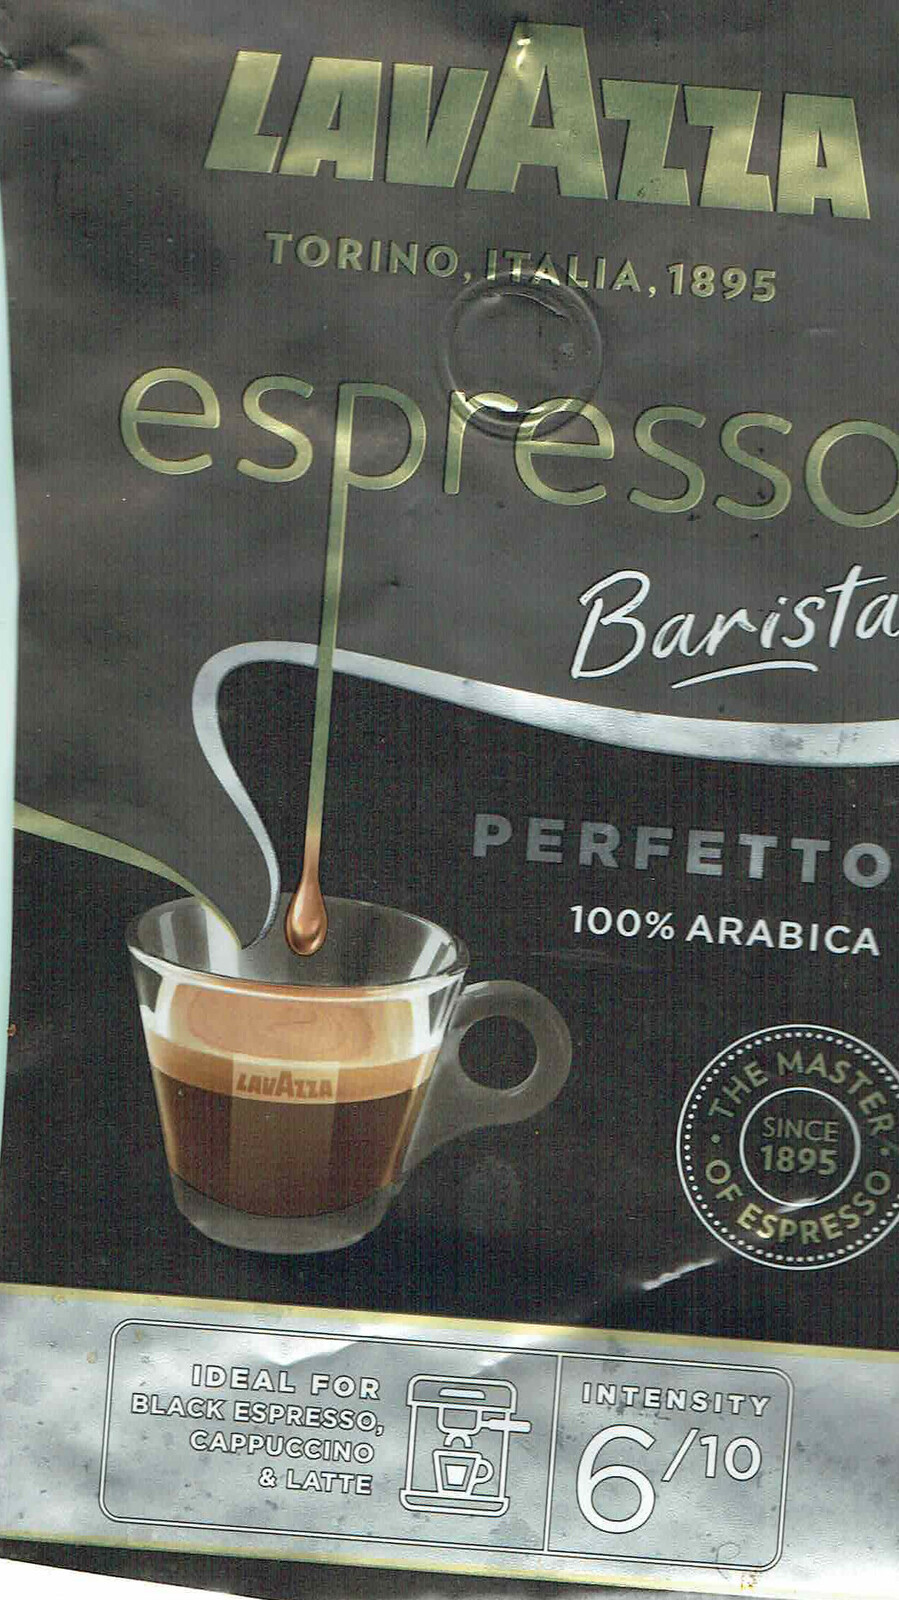
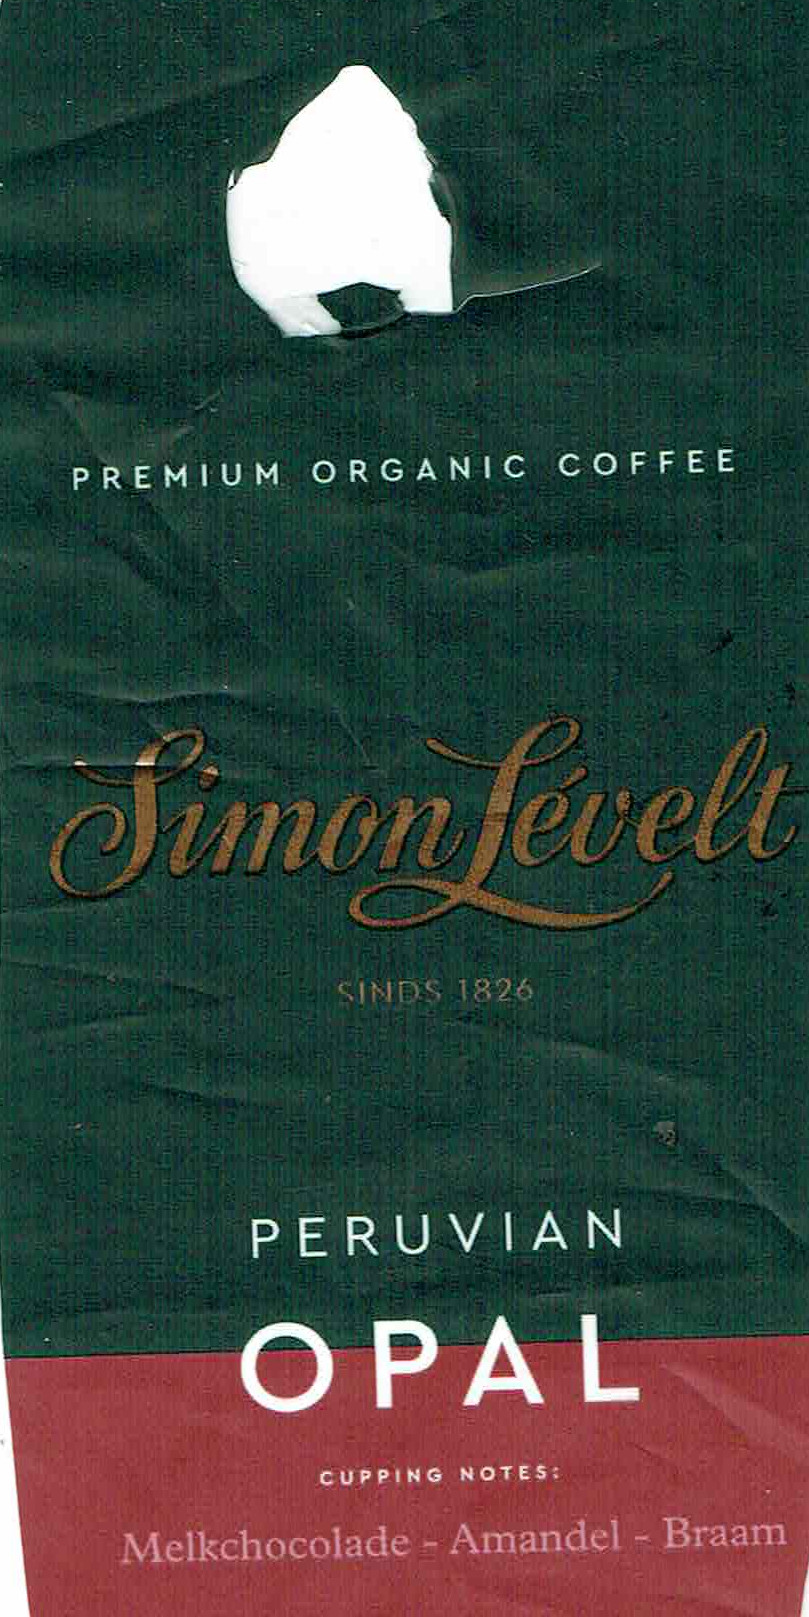
Coffee’s kindda okay
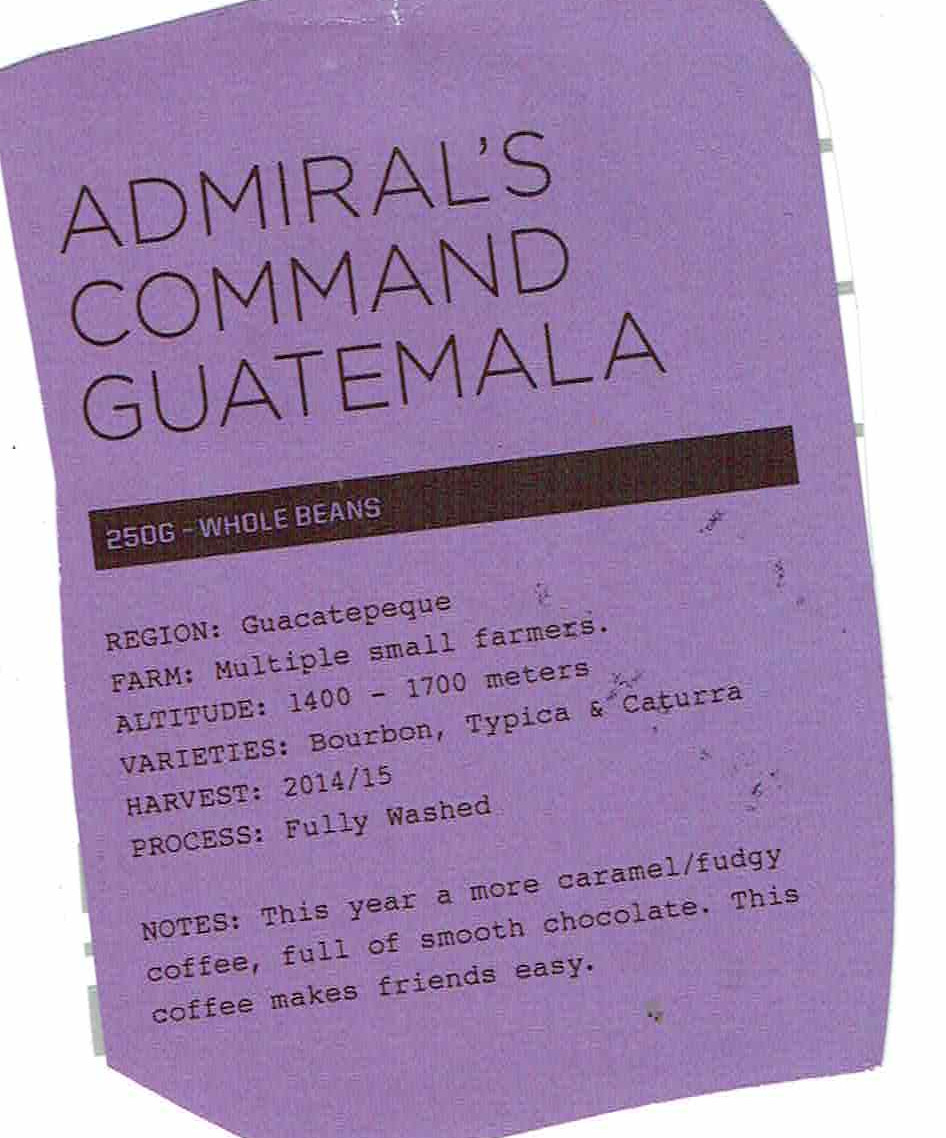
Coffee we liked a lot
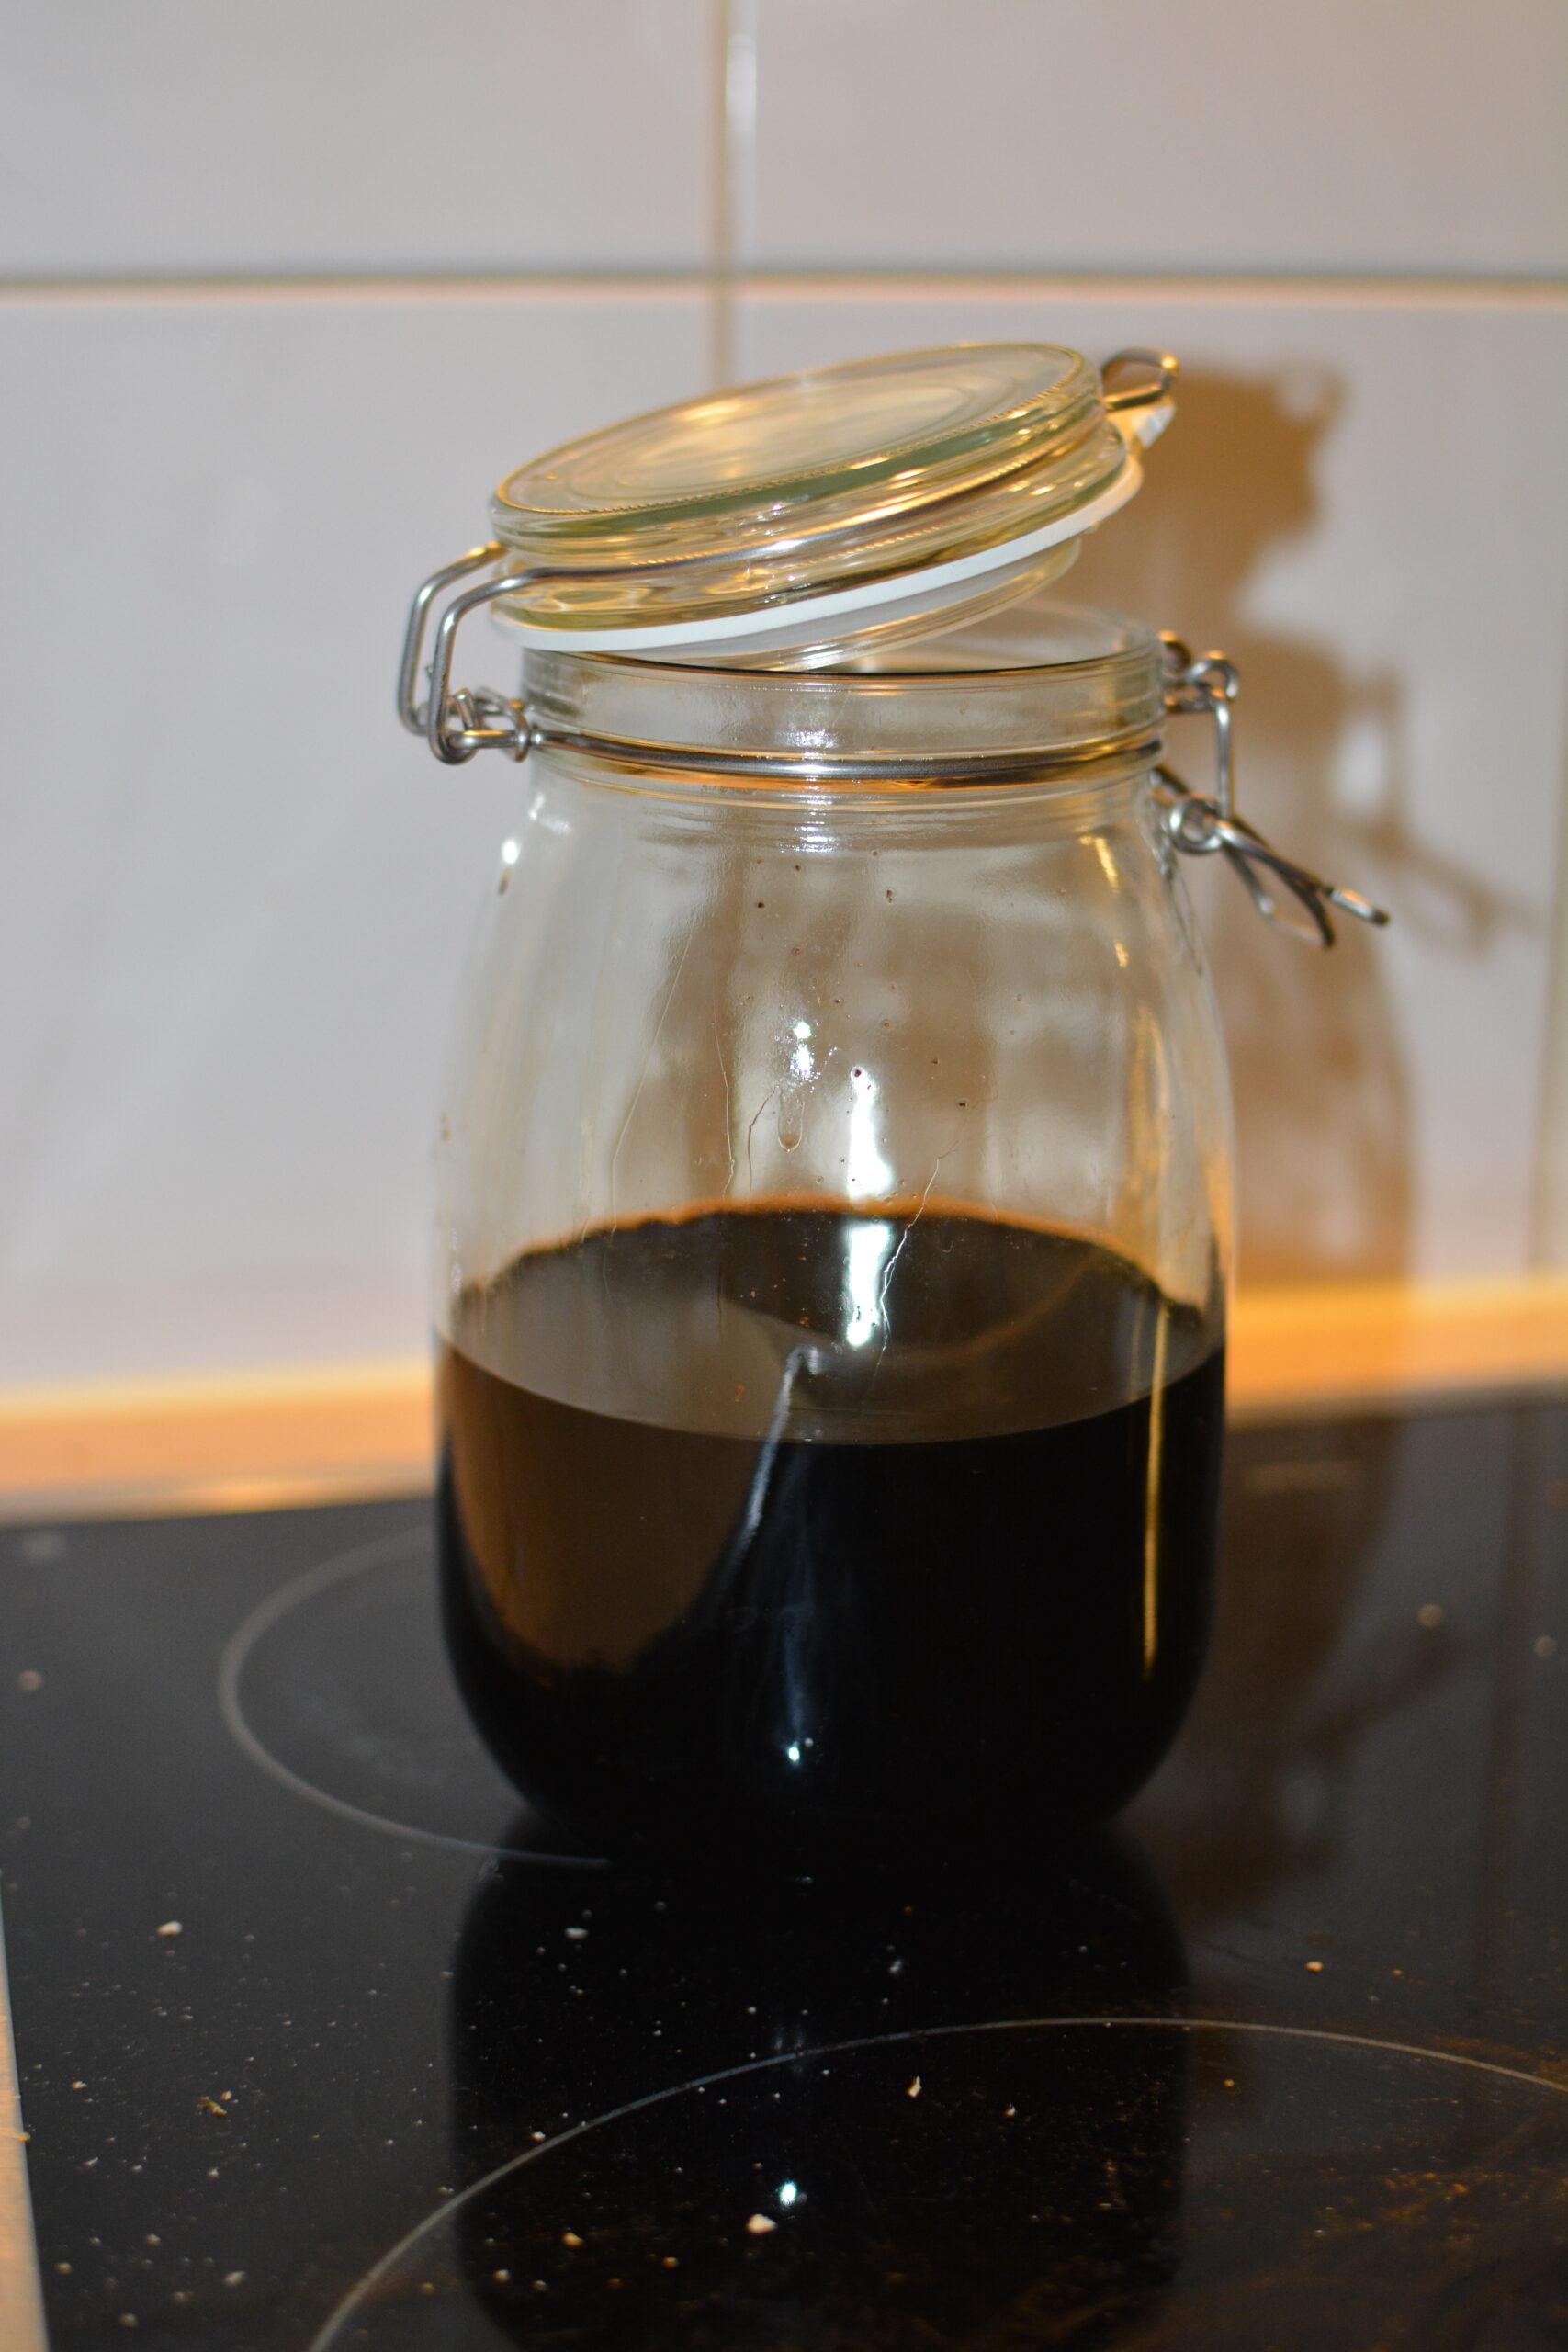
I made some Coffee liqueur in the past, coffee ice, used it glazing meat on my smoker and cocktails.
Coffee liqueur
Coffee liqueur: 3 cups sugar, 2 cups water, vanilla, 8 tablespoons grounded coffee and 700cl rum .. vodka wil work also. Heat without the alcohol, strain and add the alcohol in a container. Leave for several days, and enjoy. (note .. rum adds more flavour, depends of you want this)
Take a italian ham, prosciutto for example put a coffee bean in it. And eat this .. its amazing!
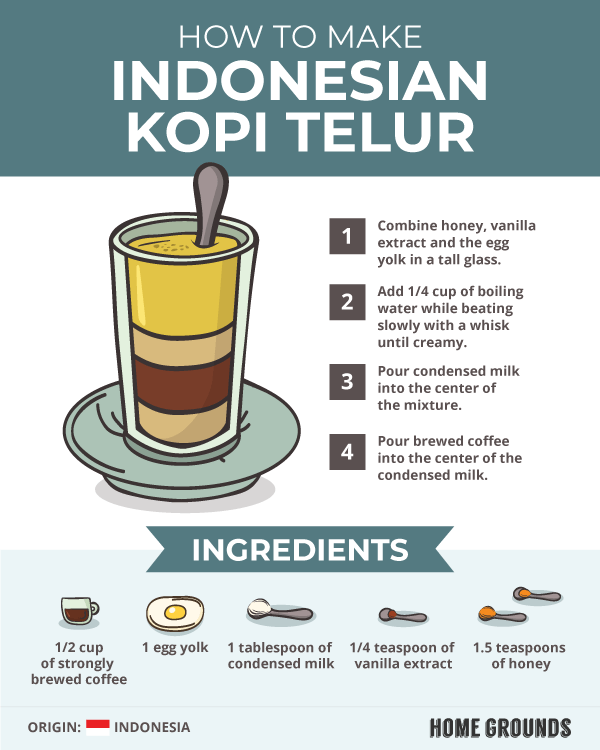
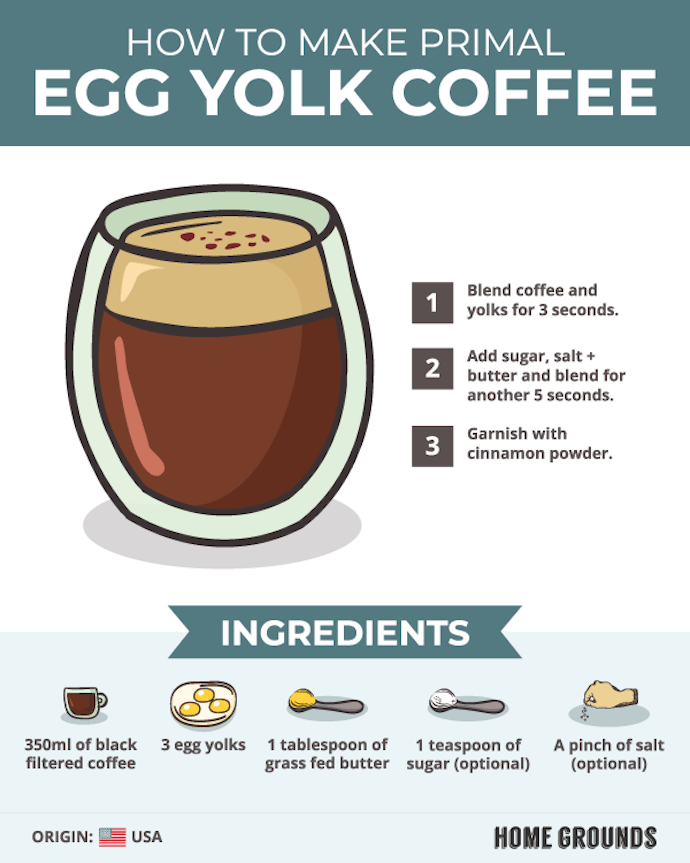
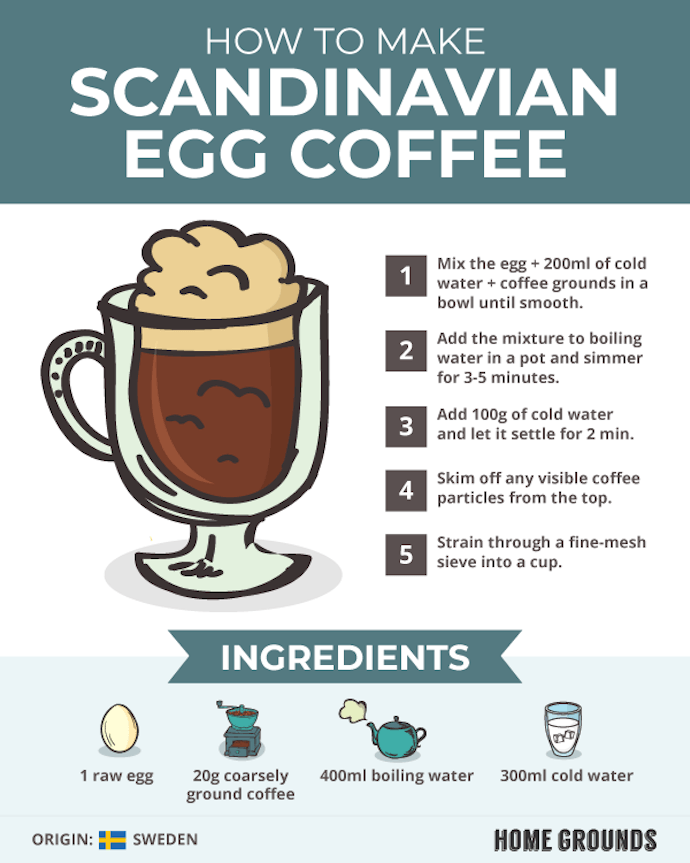
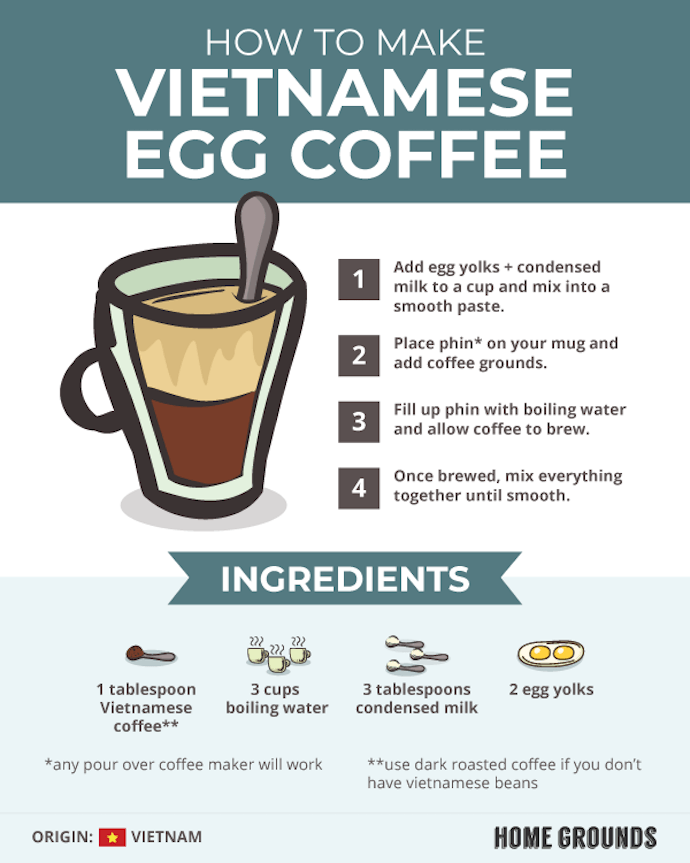
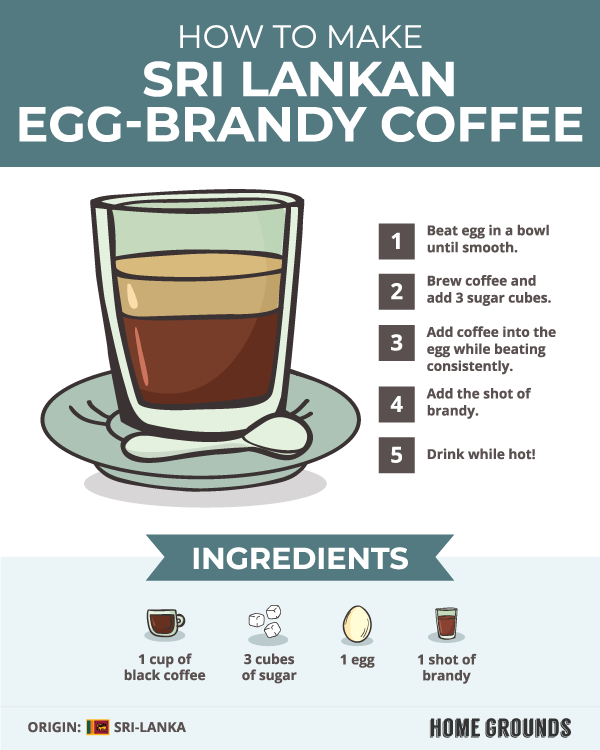
These coffee variations i’ve tried also. And ofcource i had to try Kopi Luwak.
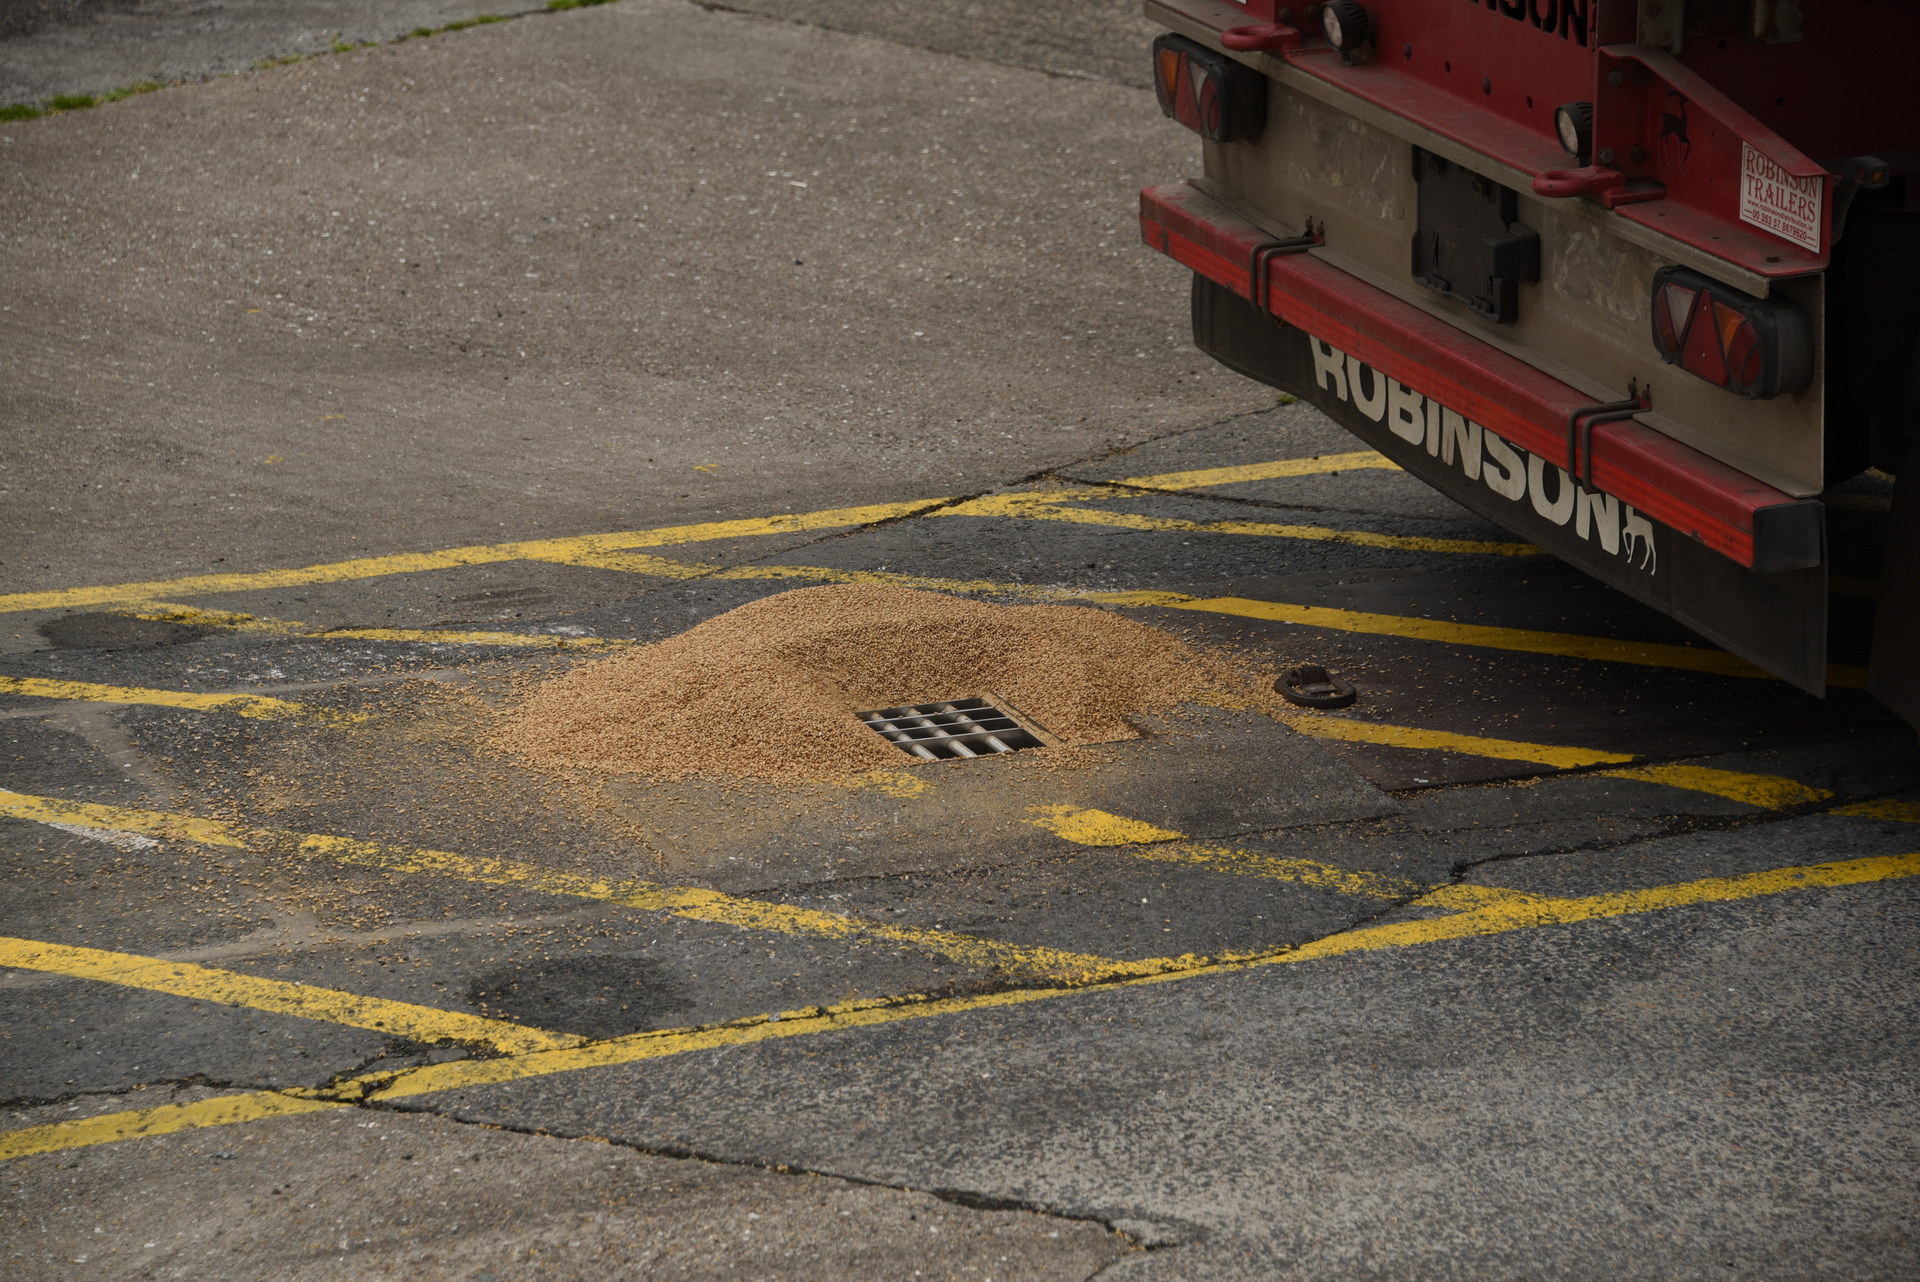
Instead of saying PPM is parts per million, i say Peats per minute! Henri
3 – 26 Juni zijn we op vakantie geweest in Schotland. Daarbij hebben we met name de western isles bezocht.
Henri
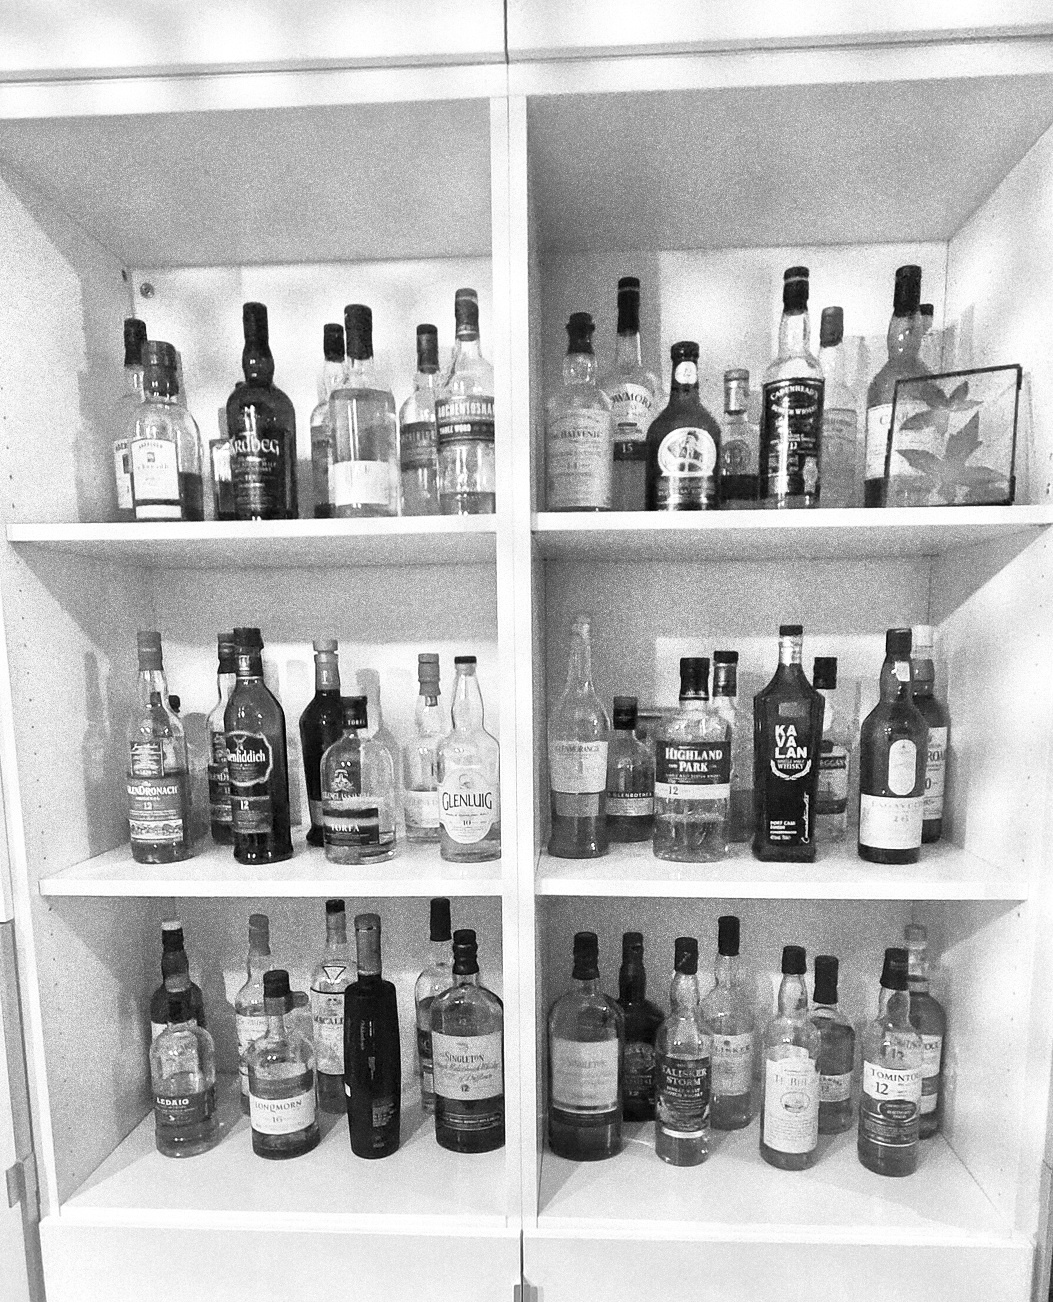
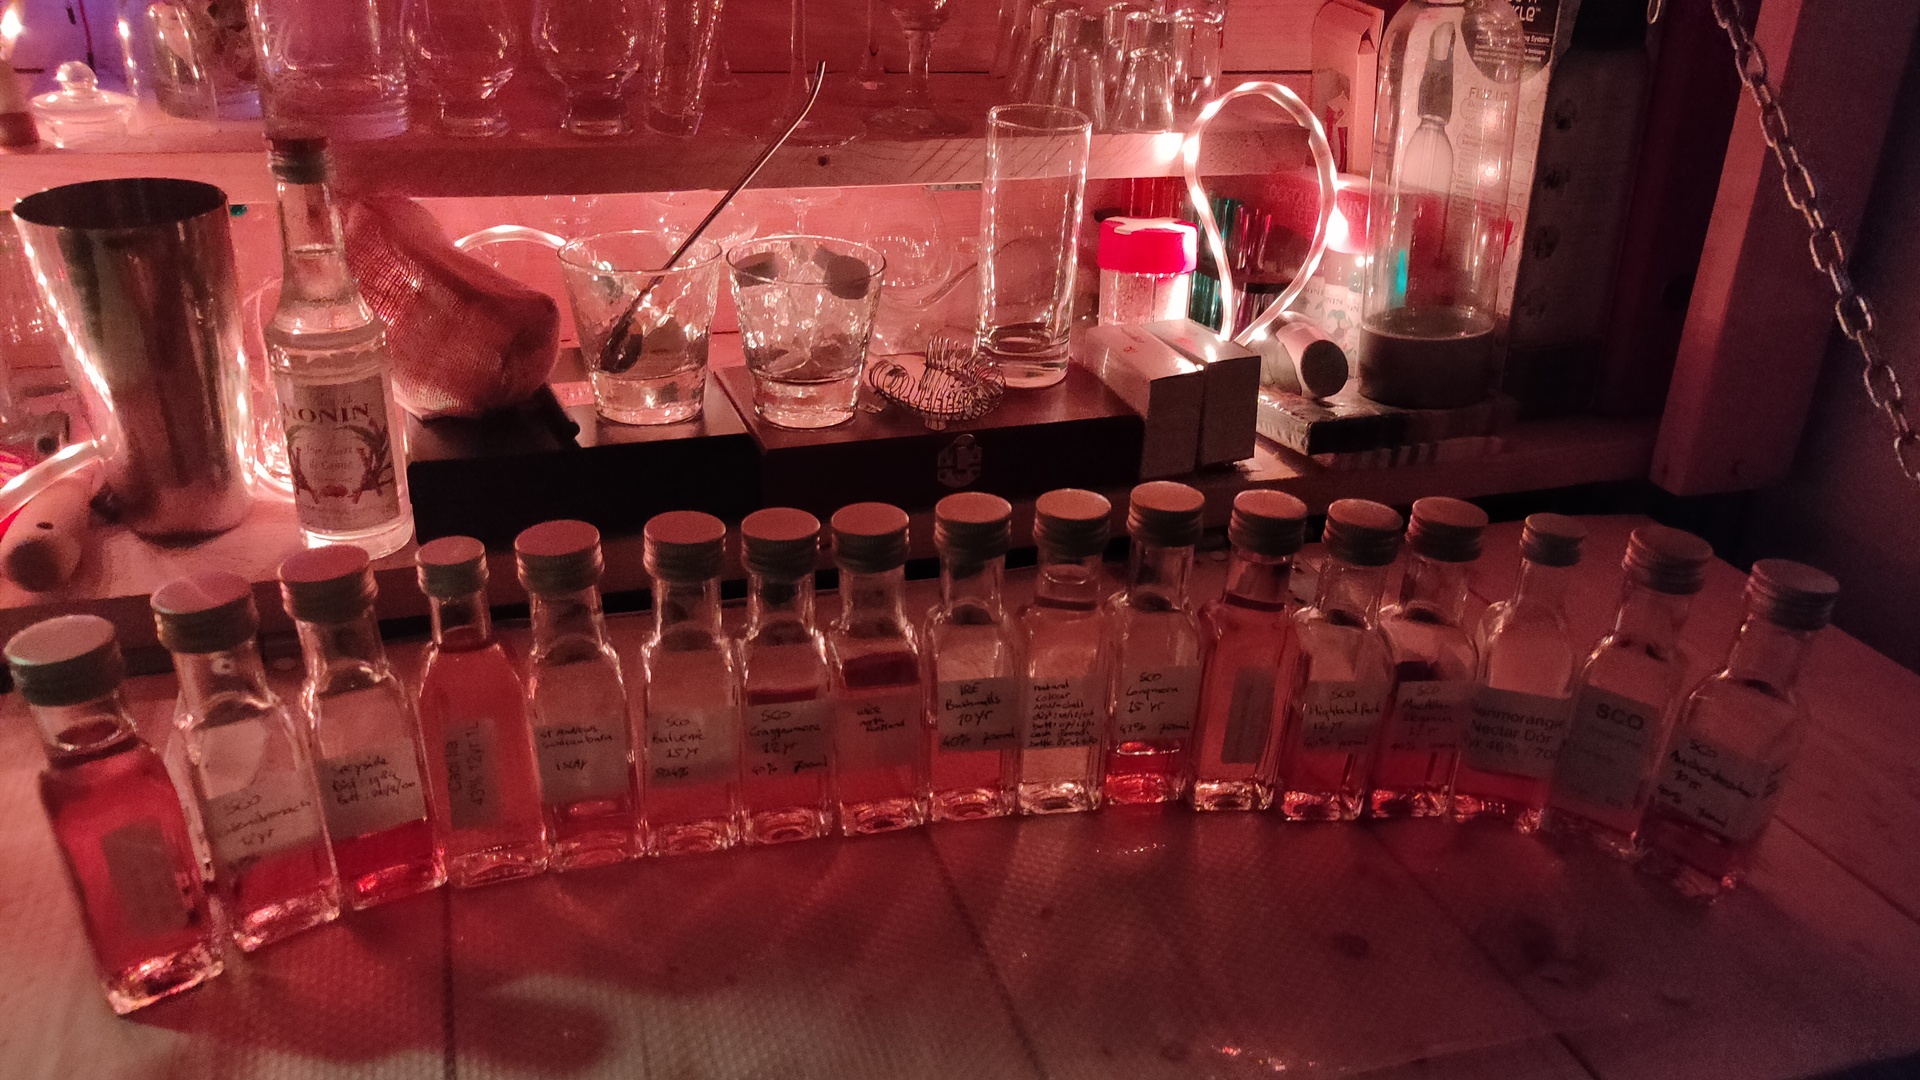
Hieronder heb ik stukken uit ons logboek geplakt aangaande bezoeken aan whisky distillers.
Naast de vele distillers op Islay, hebben we nog wat andere bezocht op de andere eilanden.
Isle of Islay
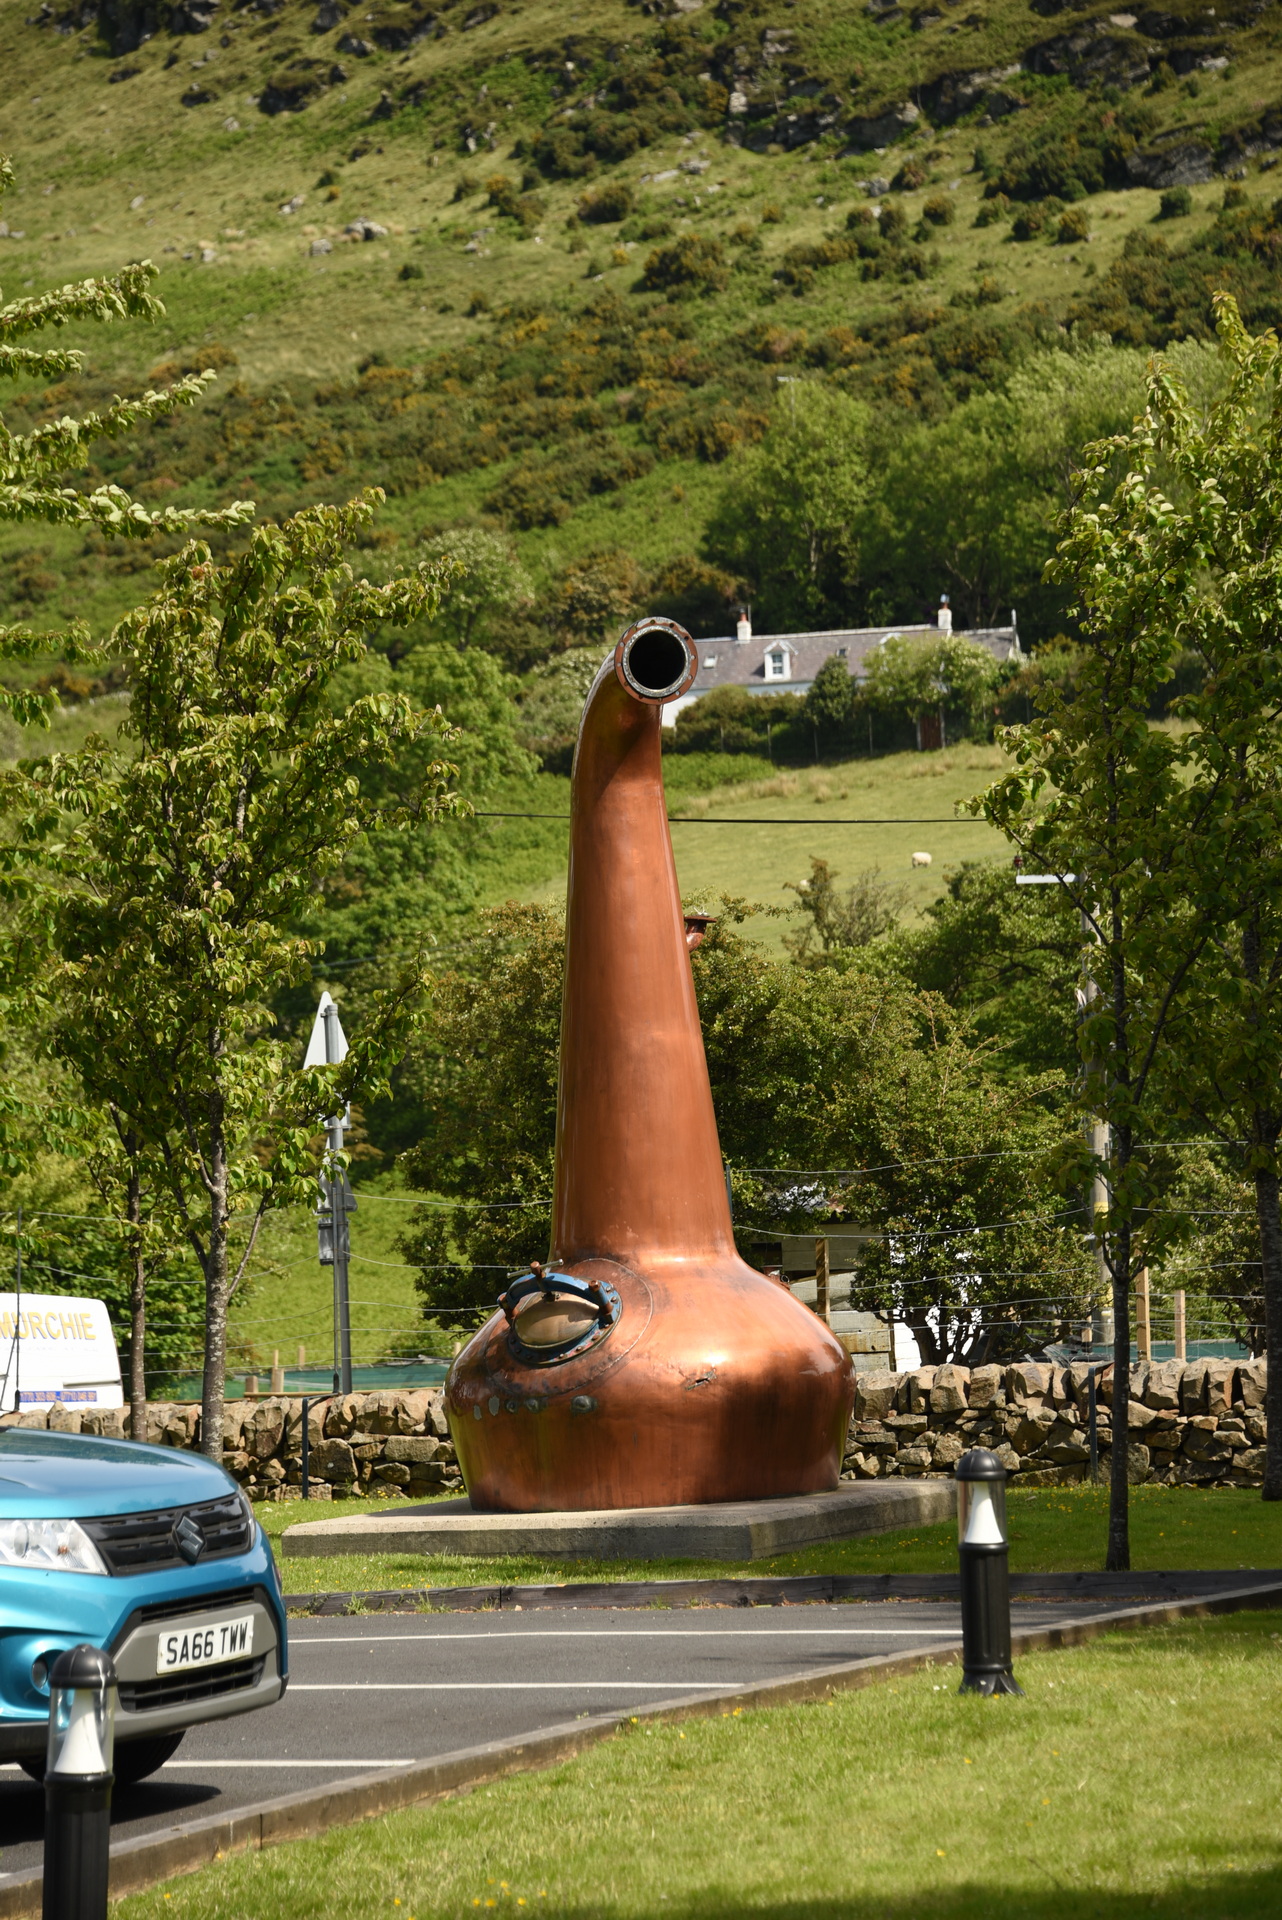
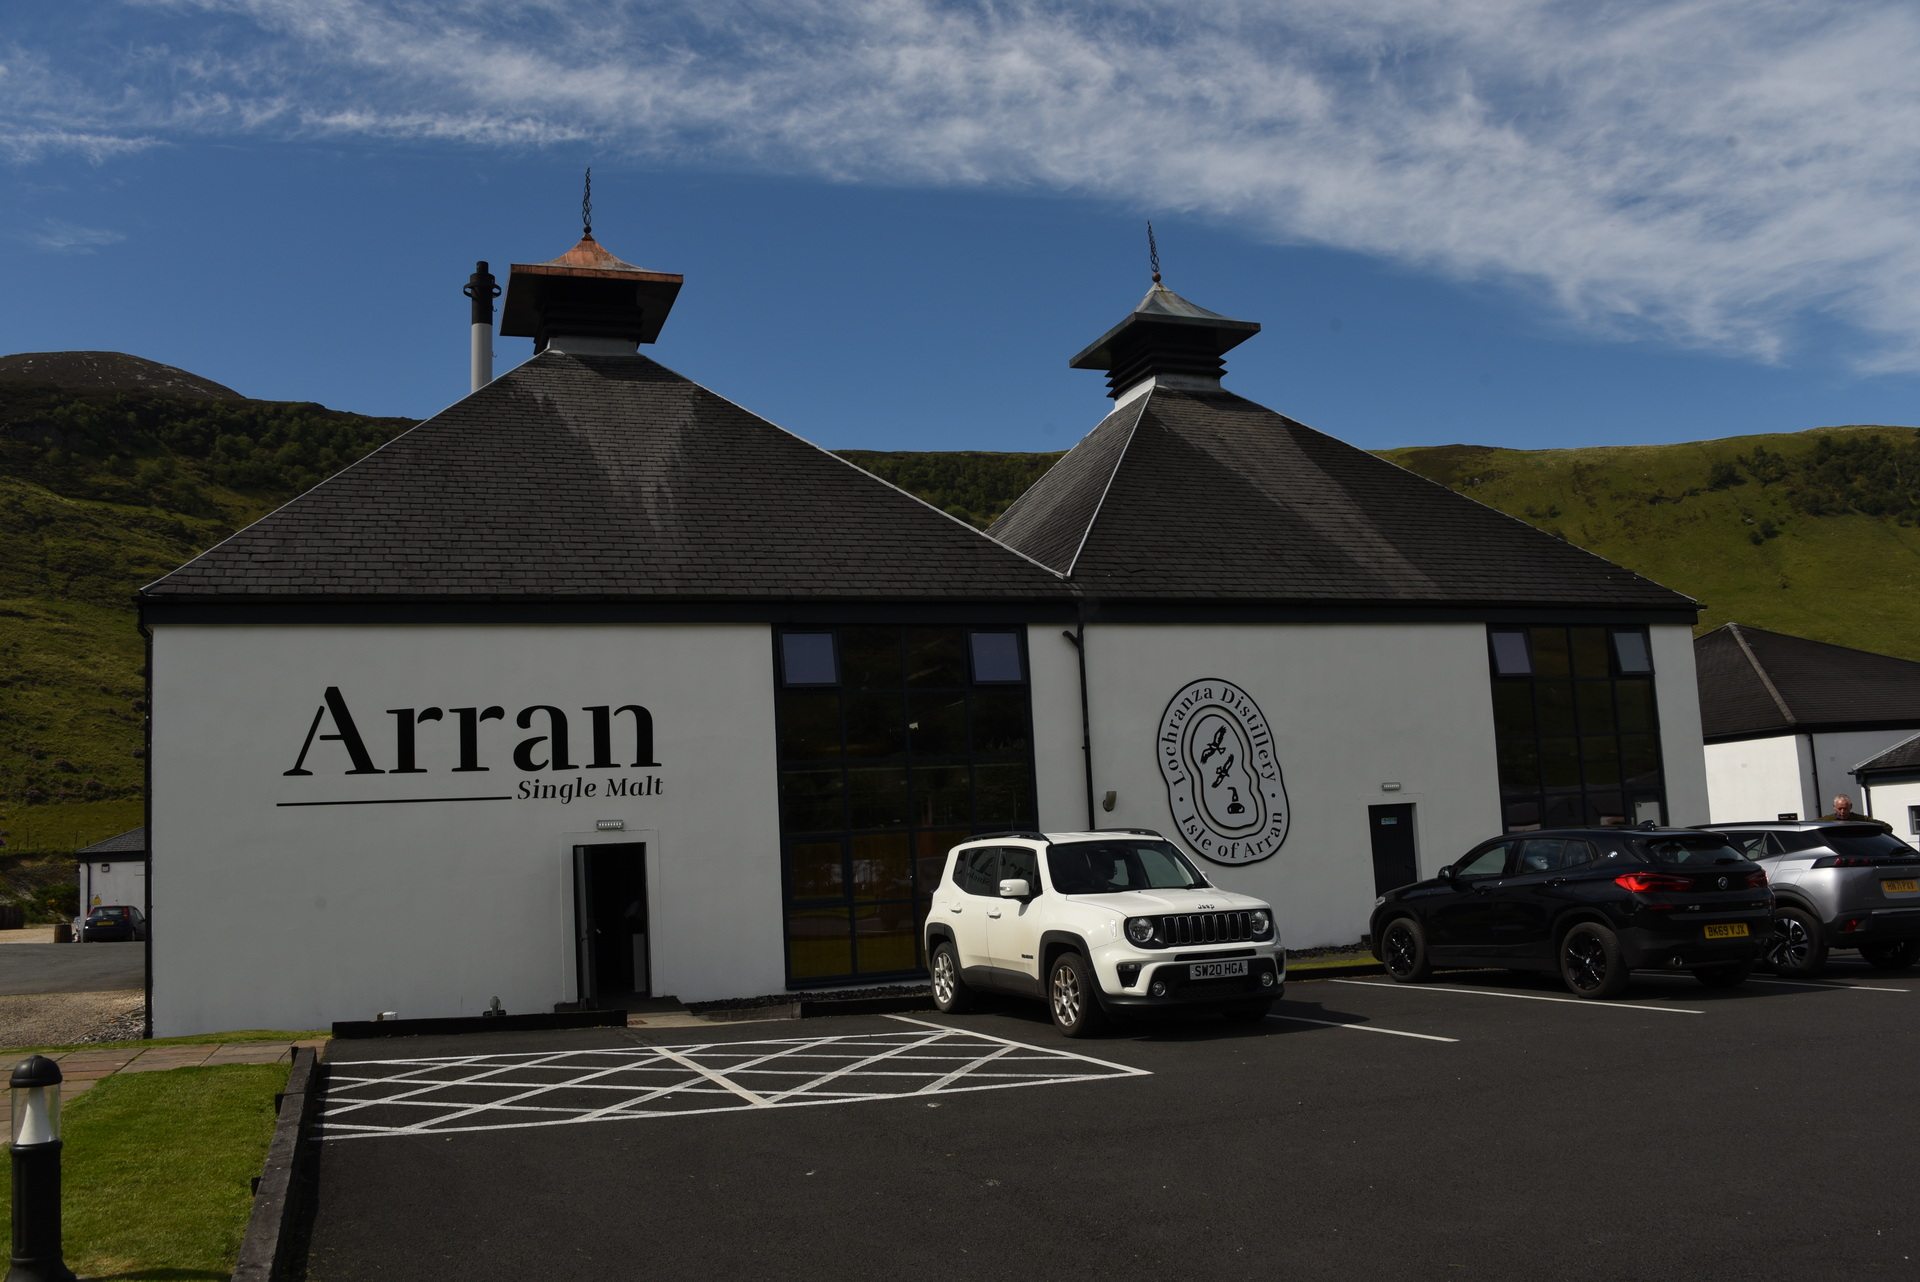
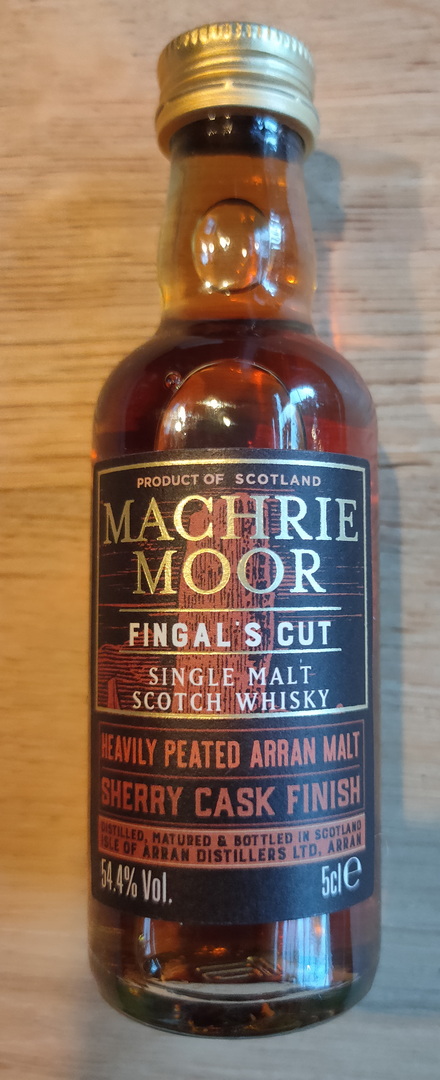
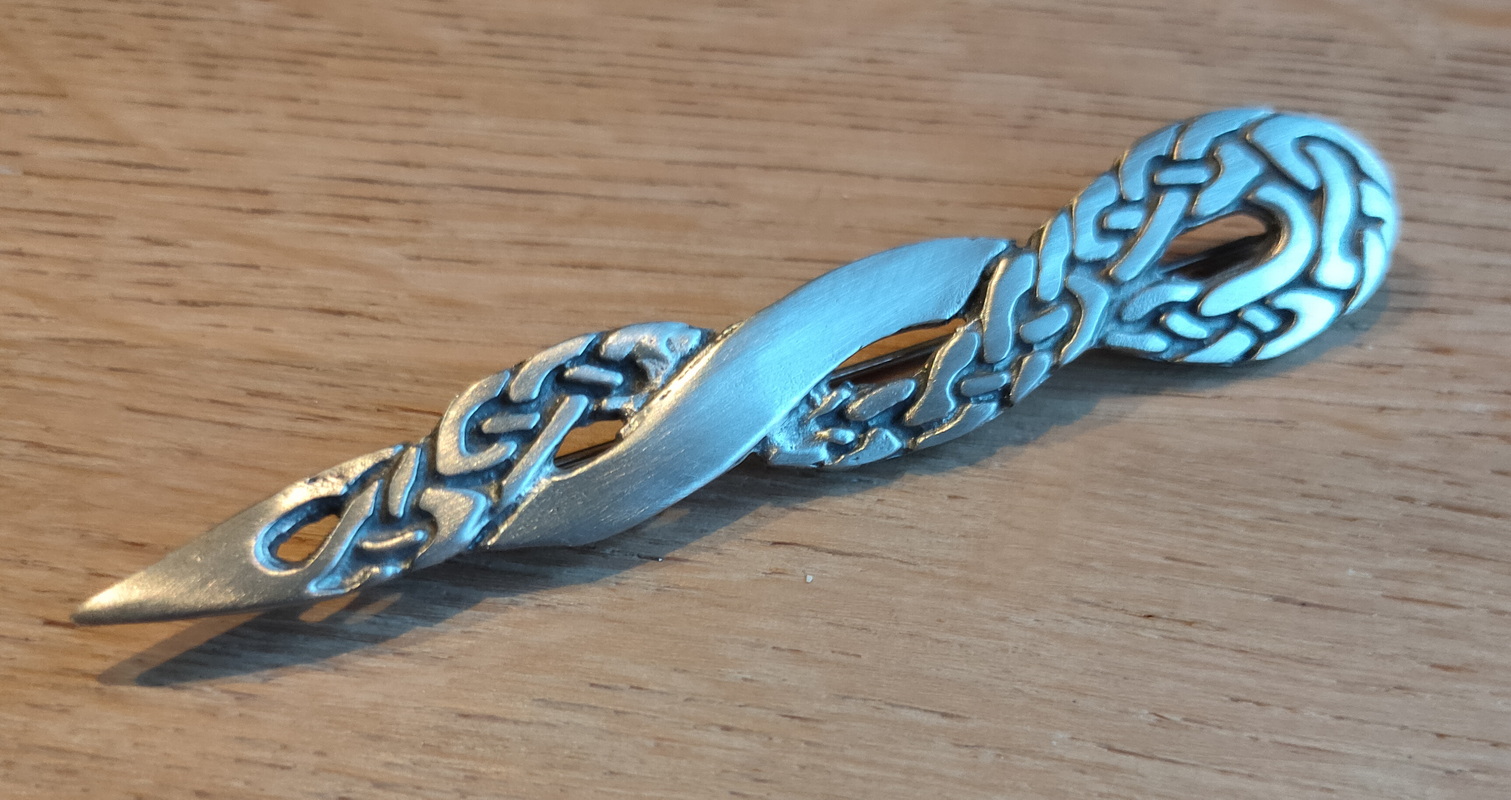
7 Juni – Arran distiller (Isle of Arran)
Hier een fles whisky gekocht en een kiltpin (van beide kun je er nooit genoeg hebben)
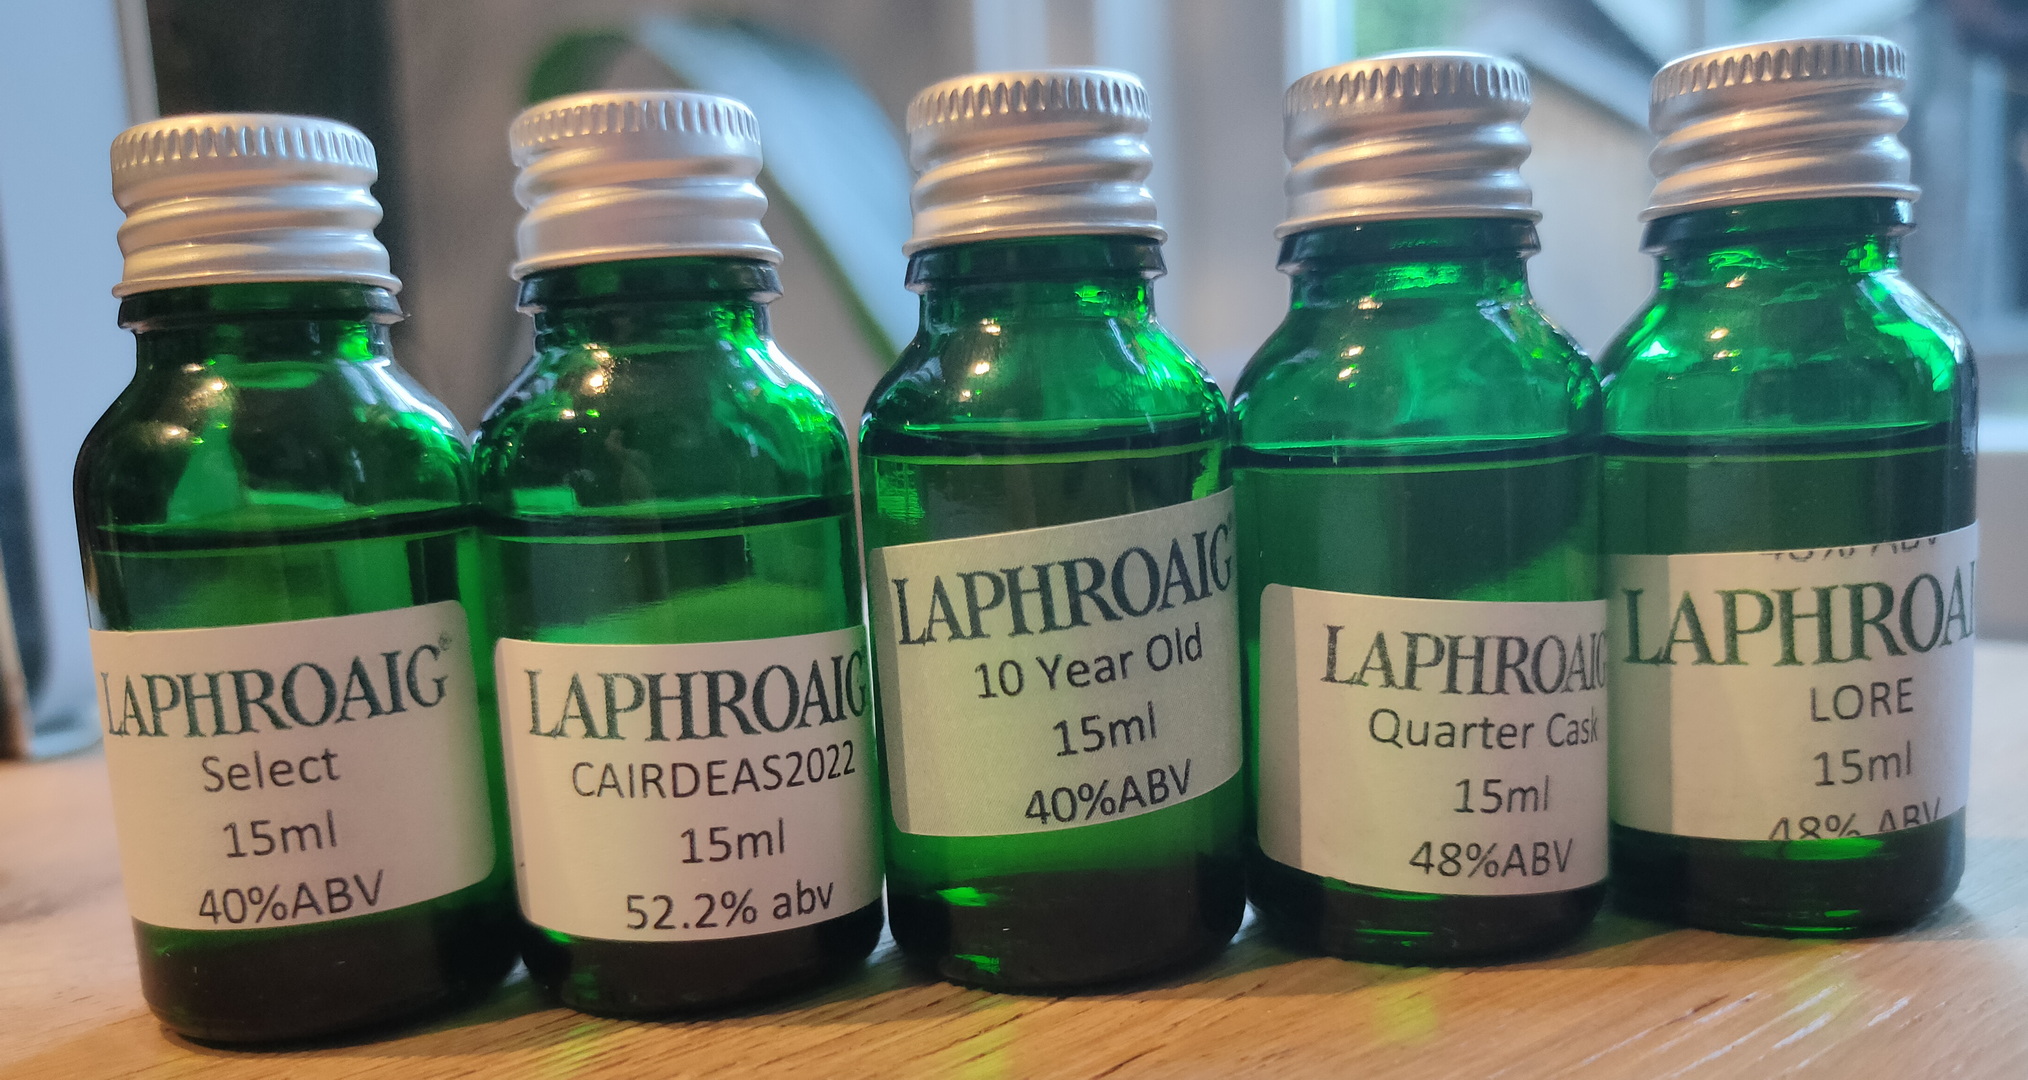
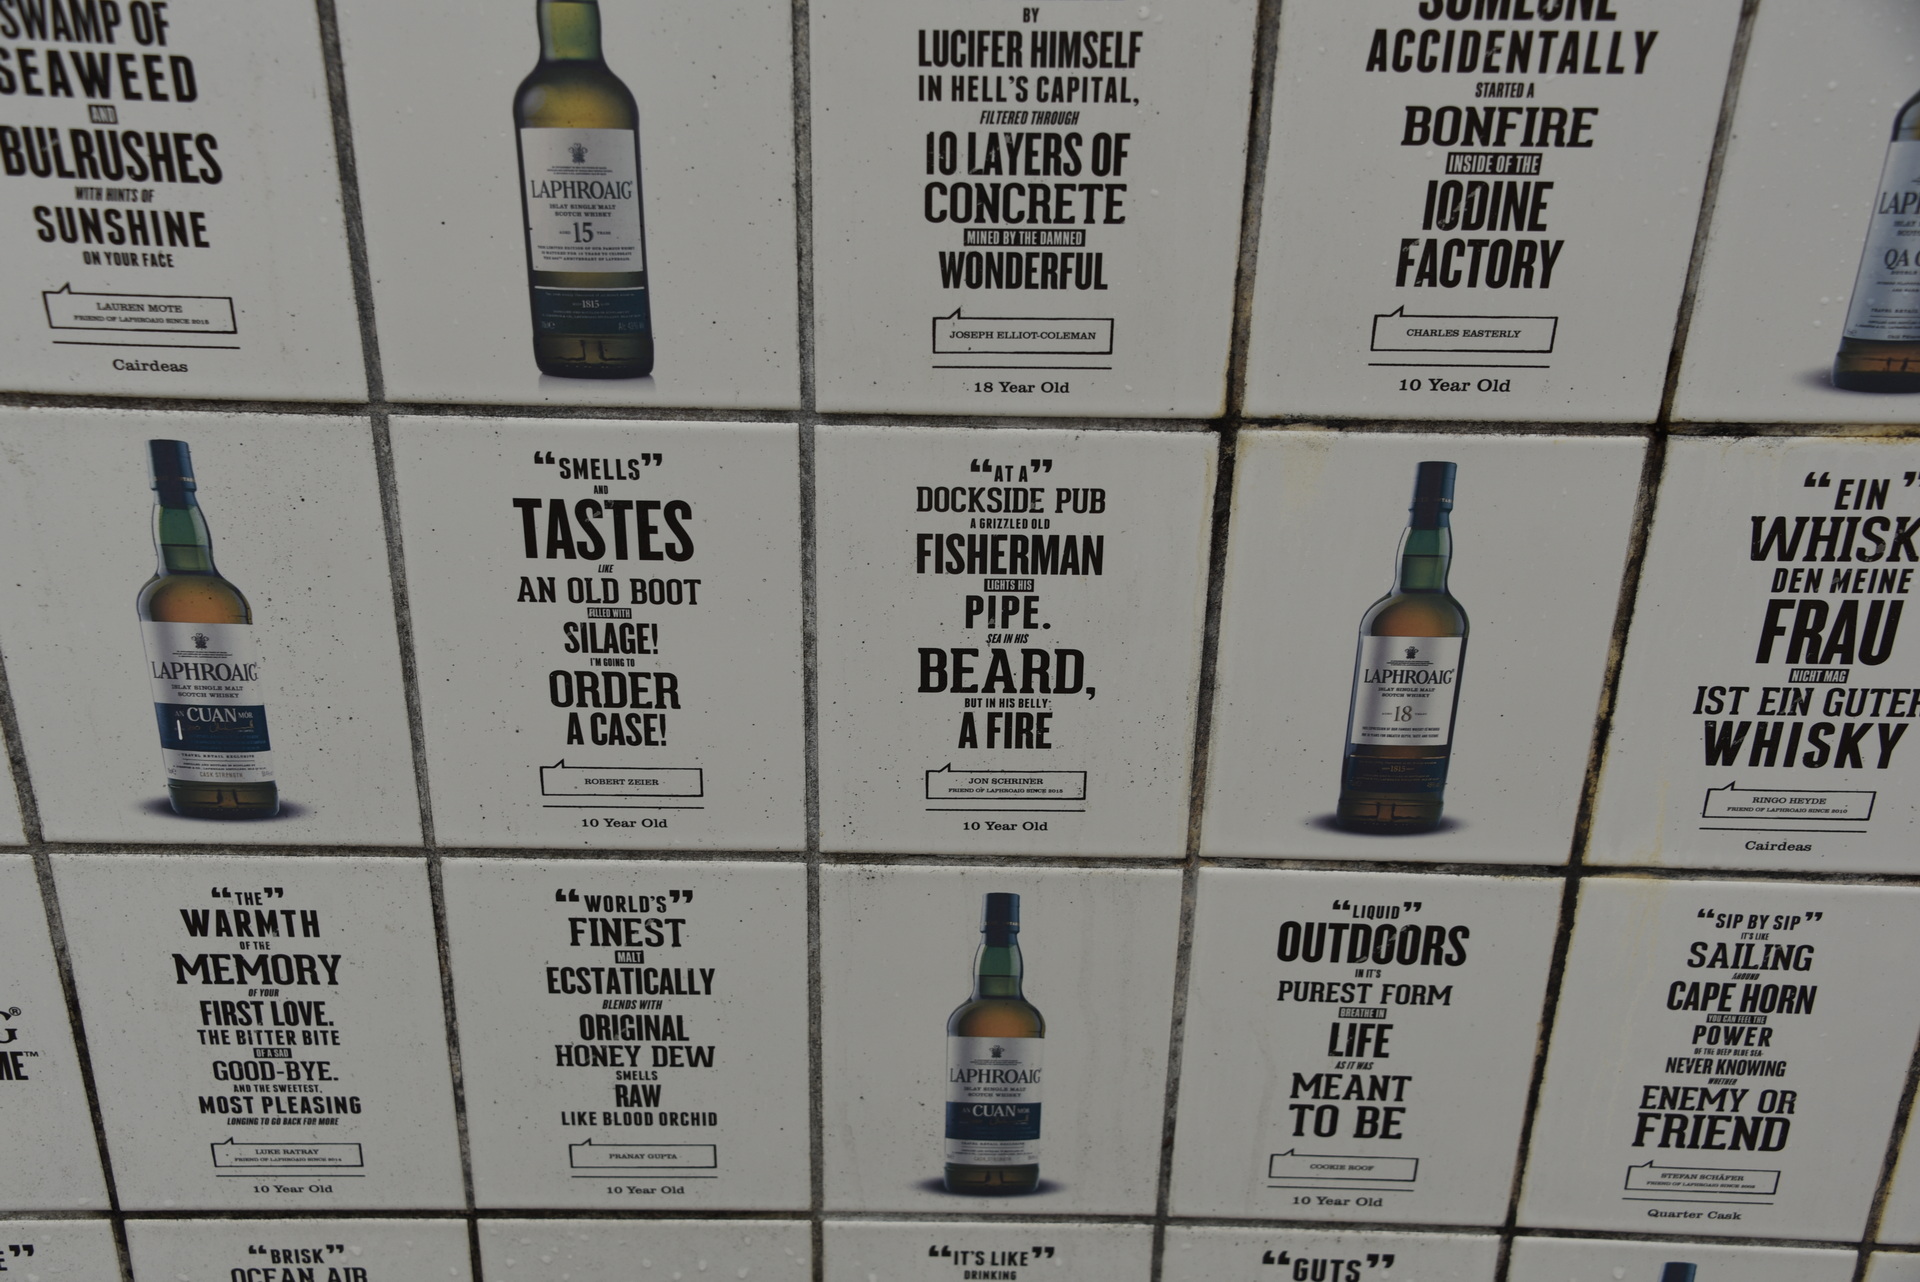
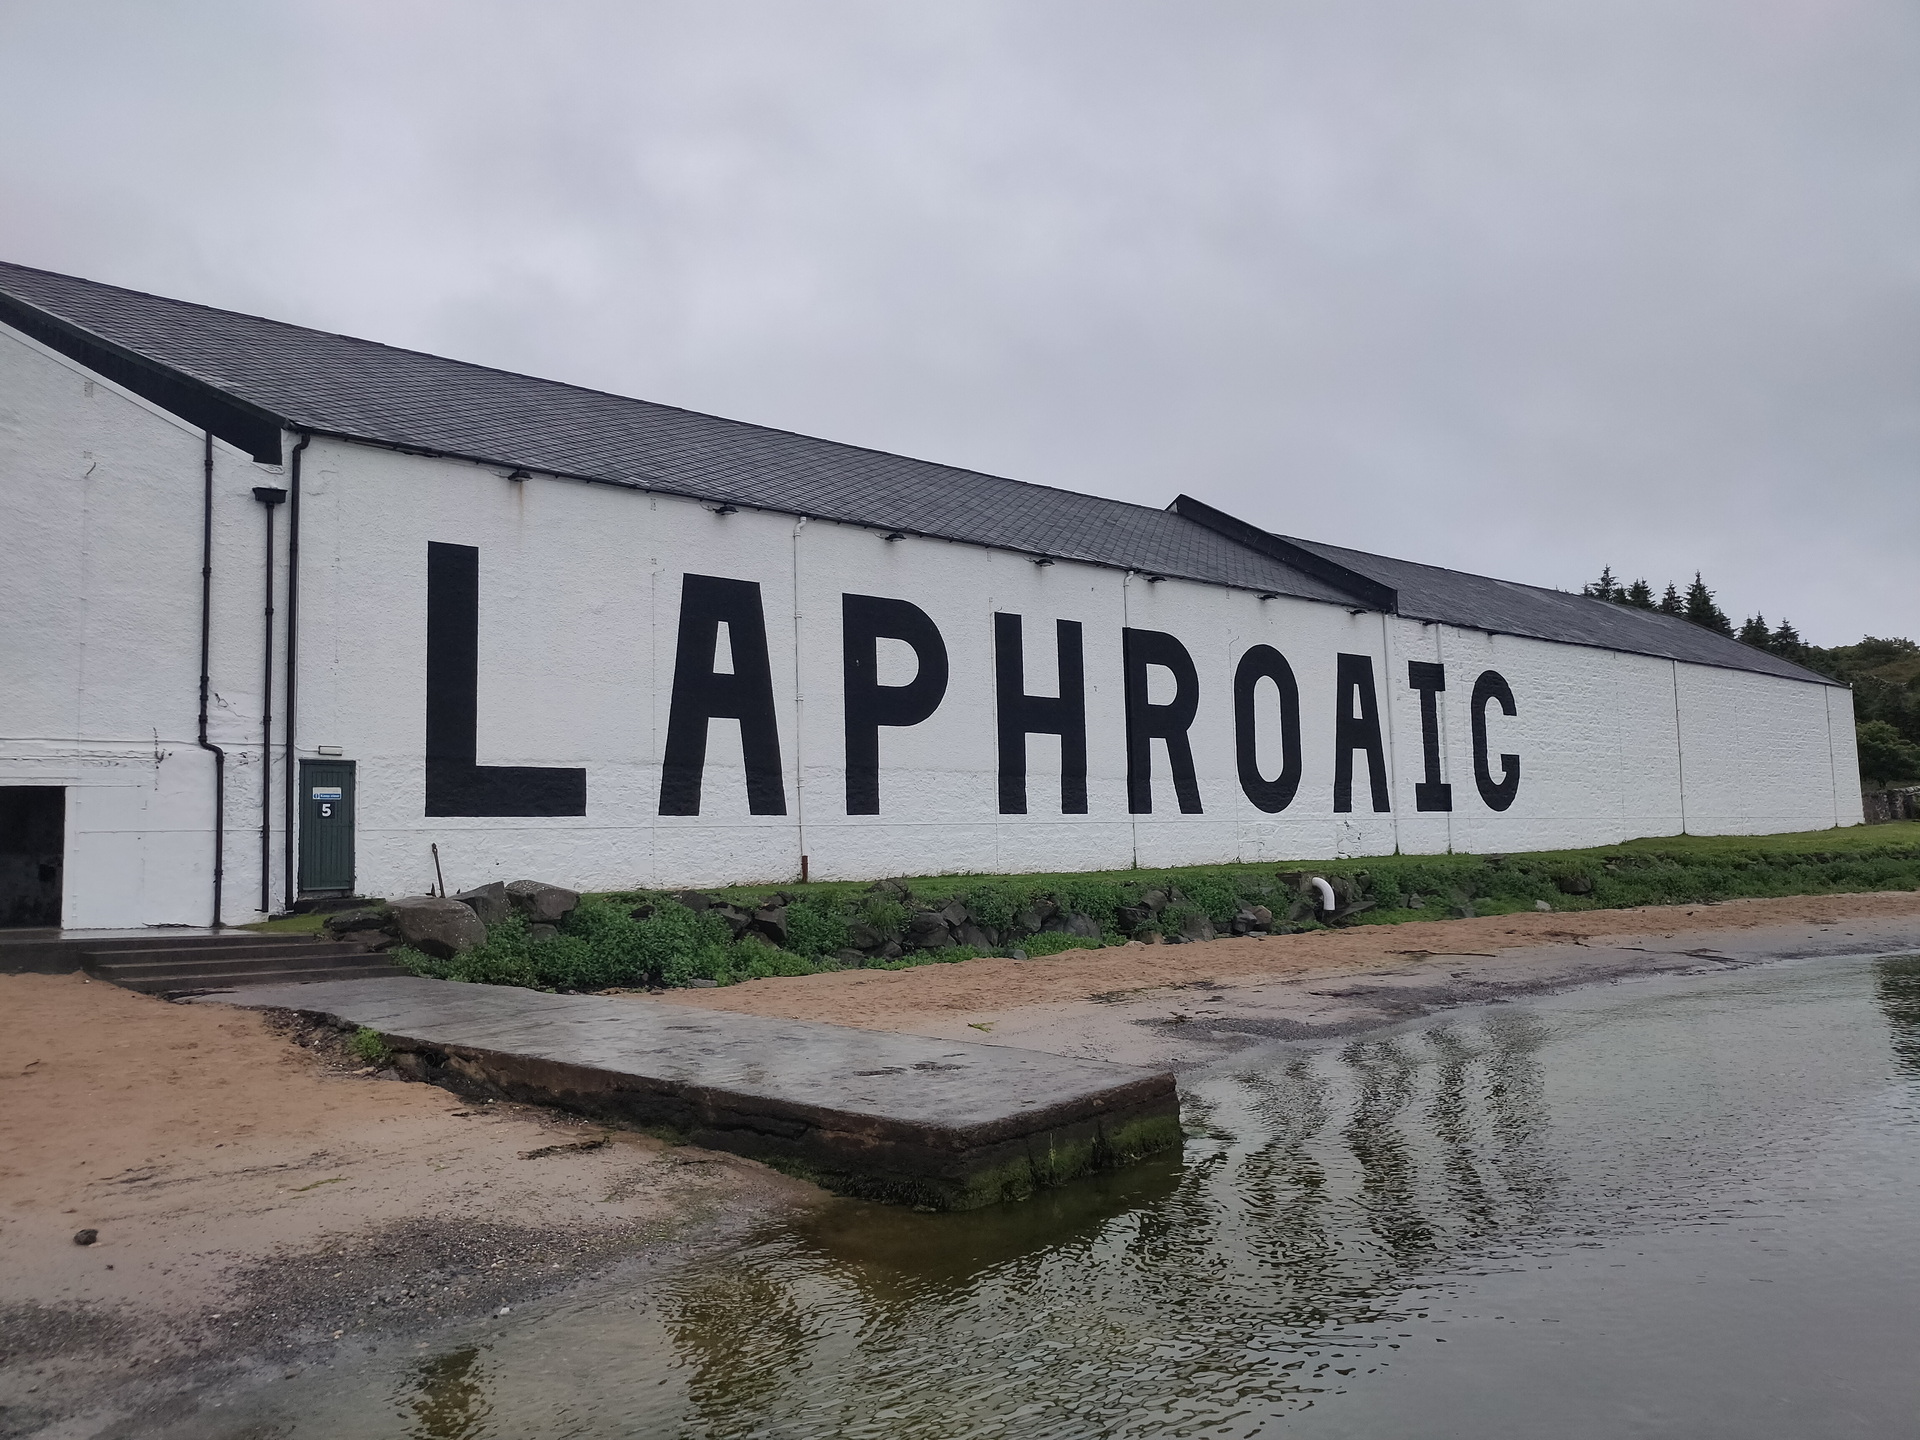
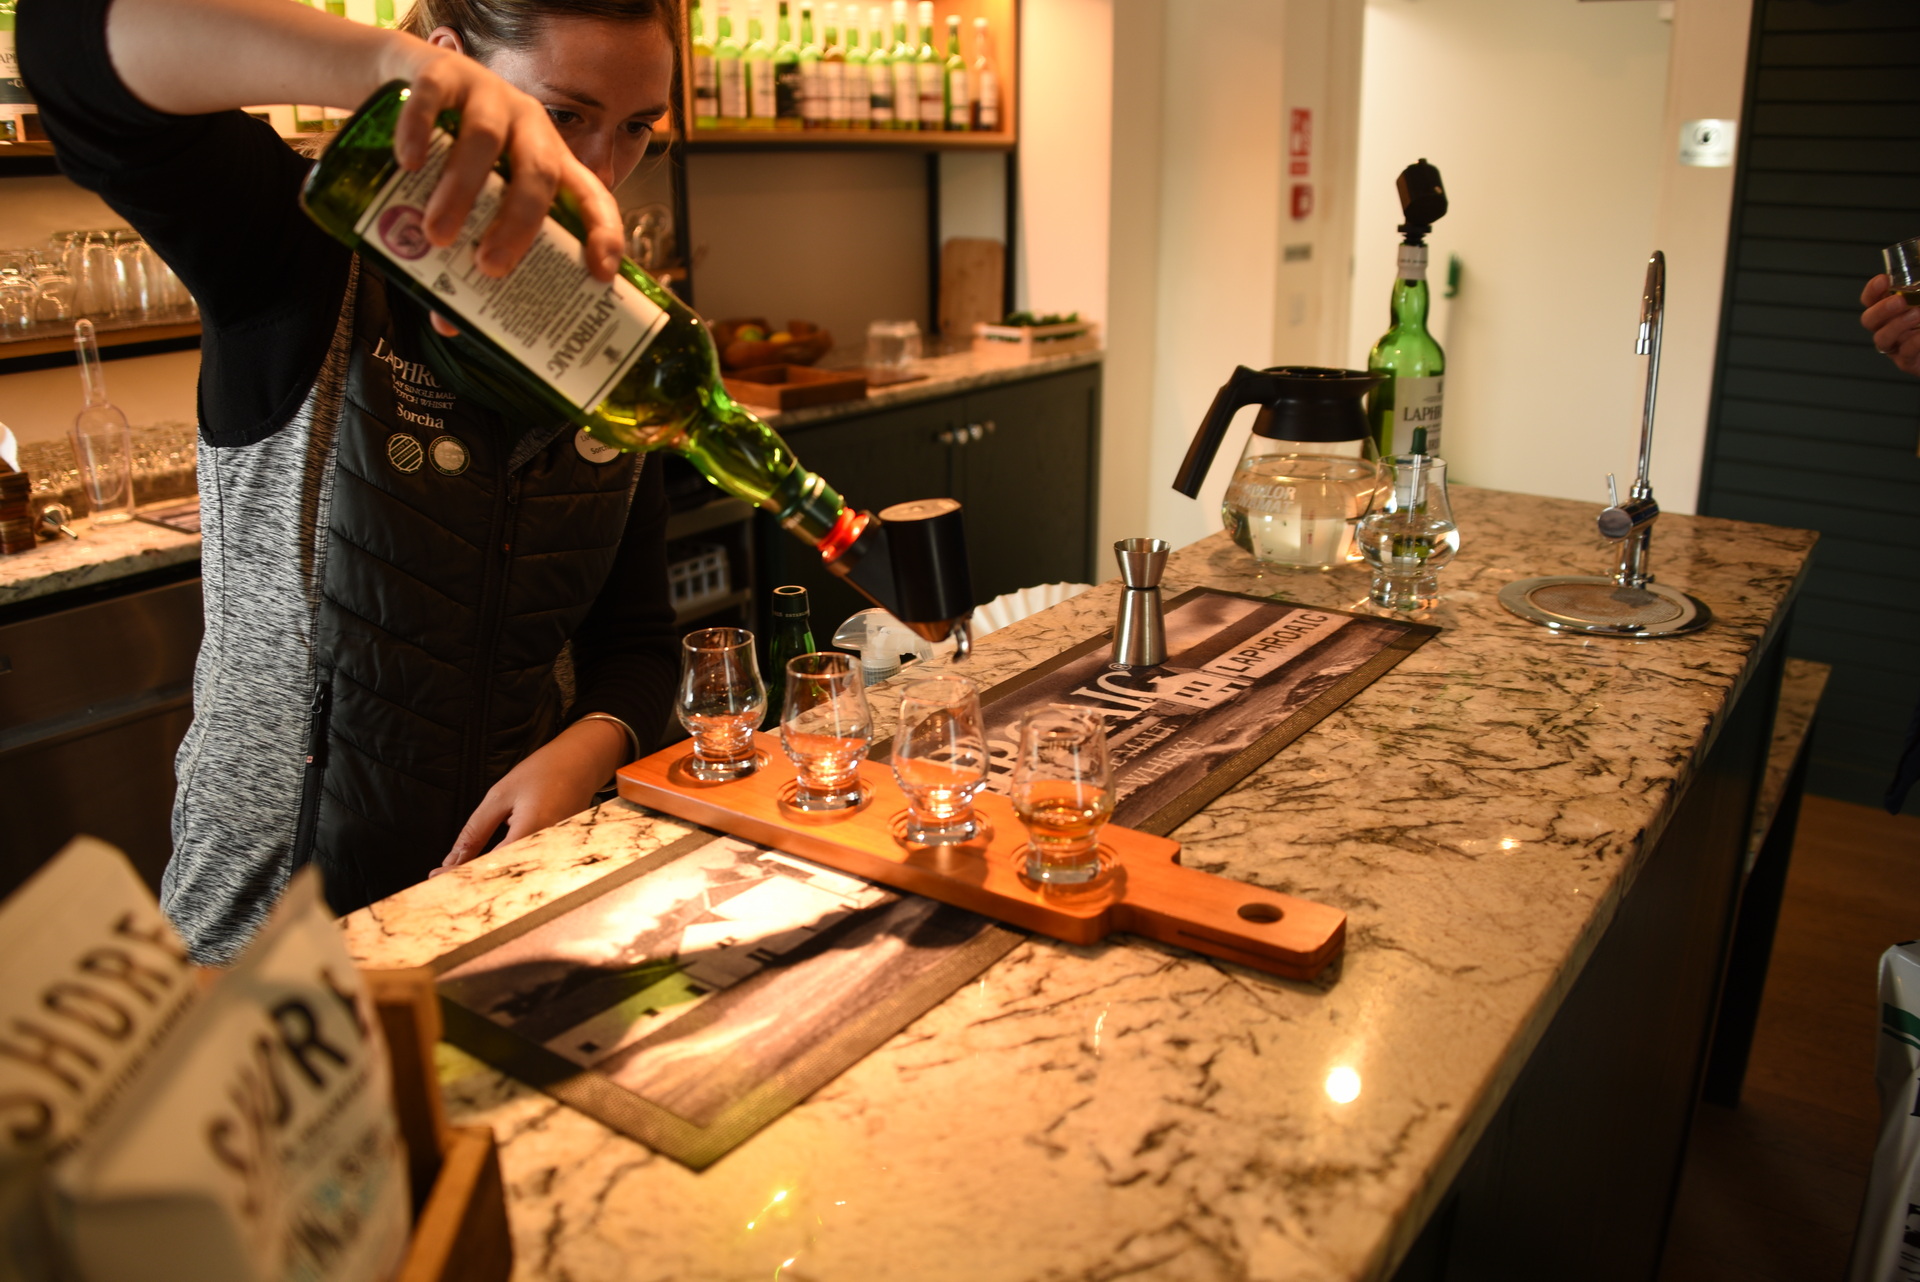
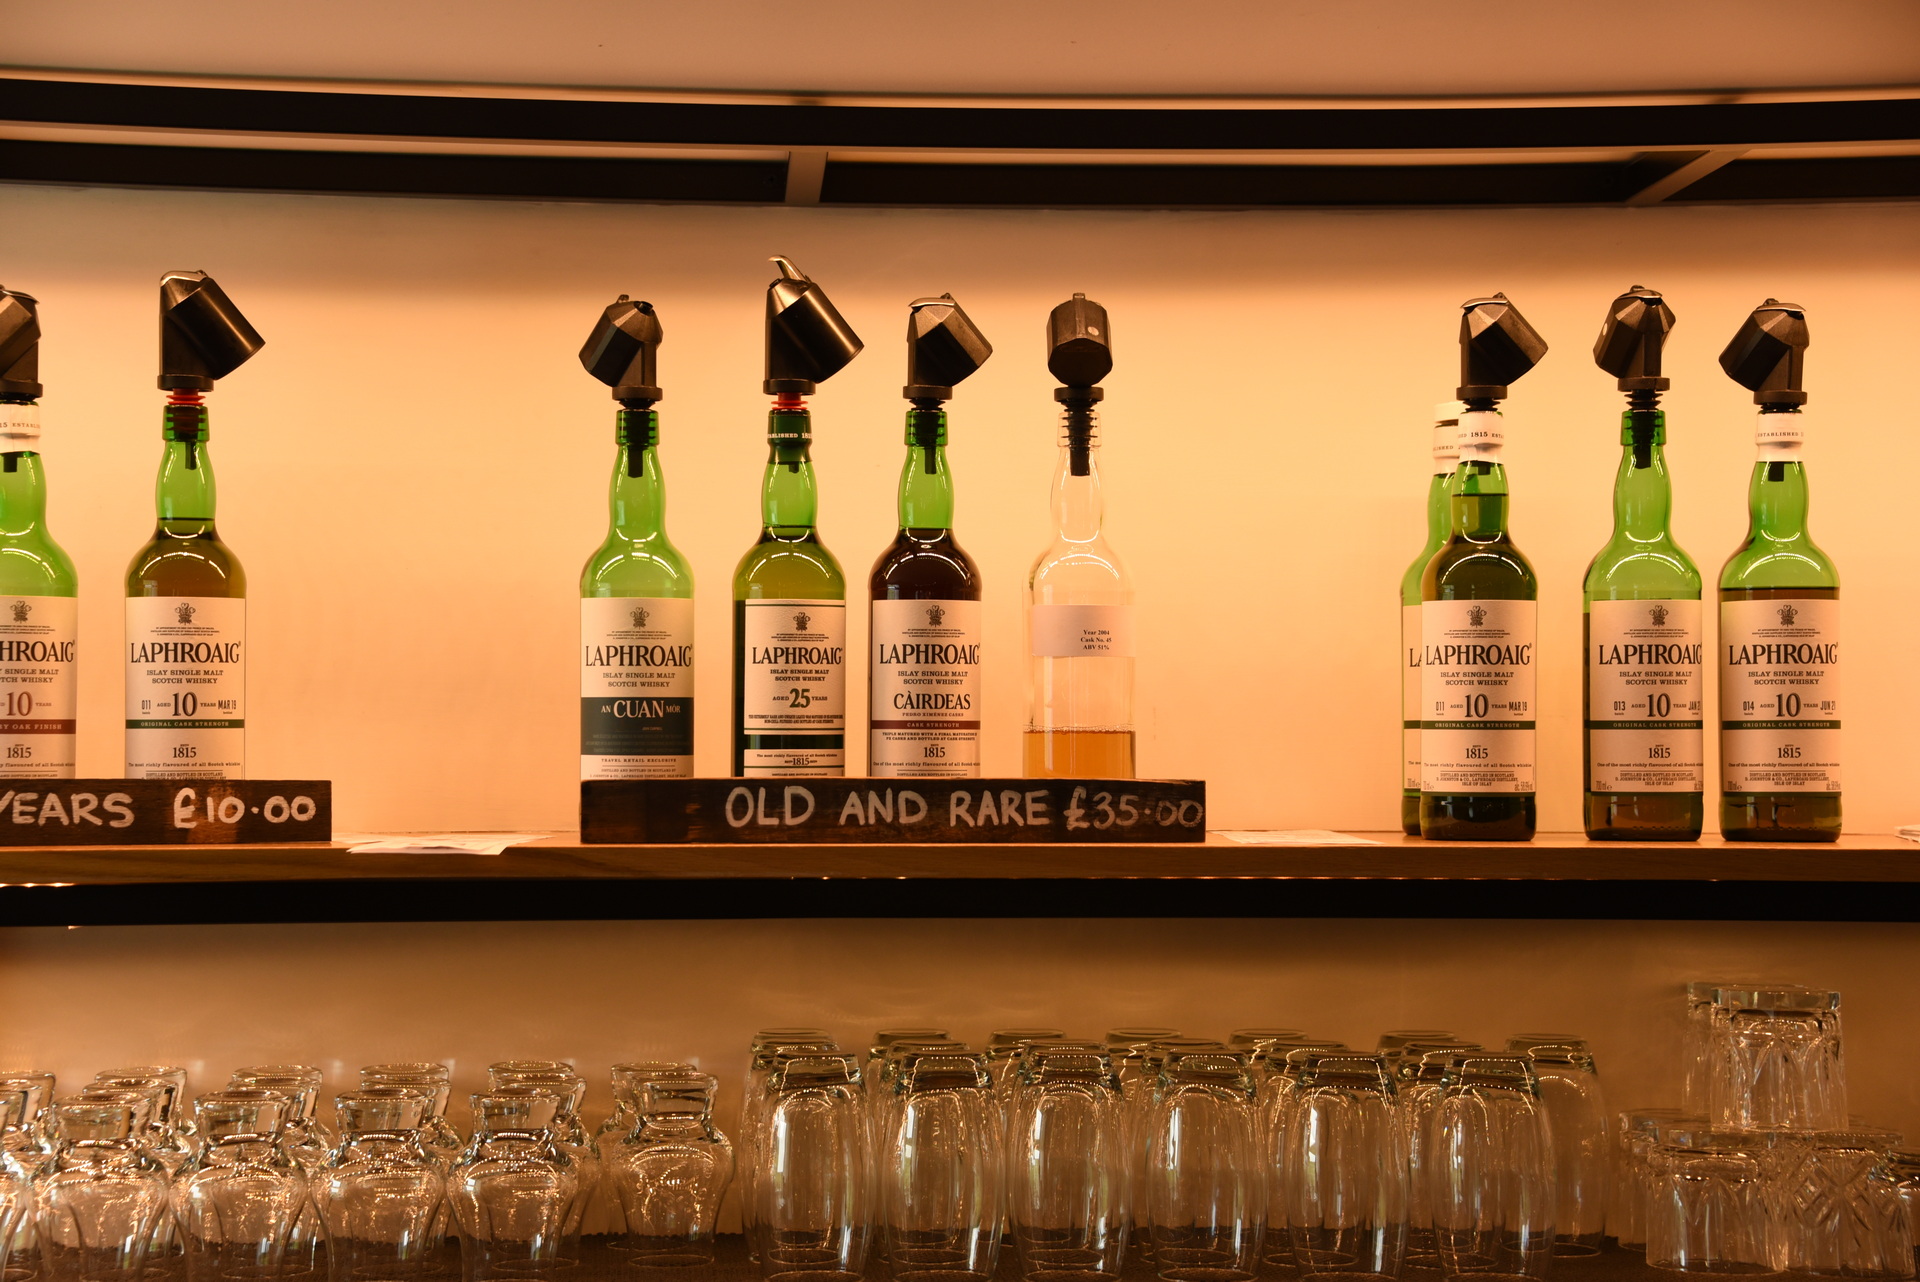
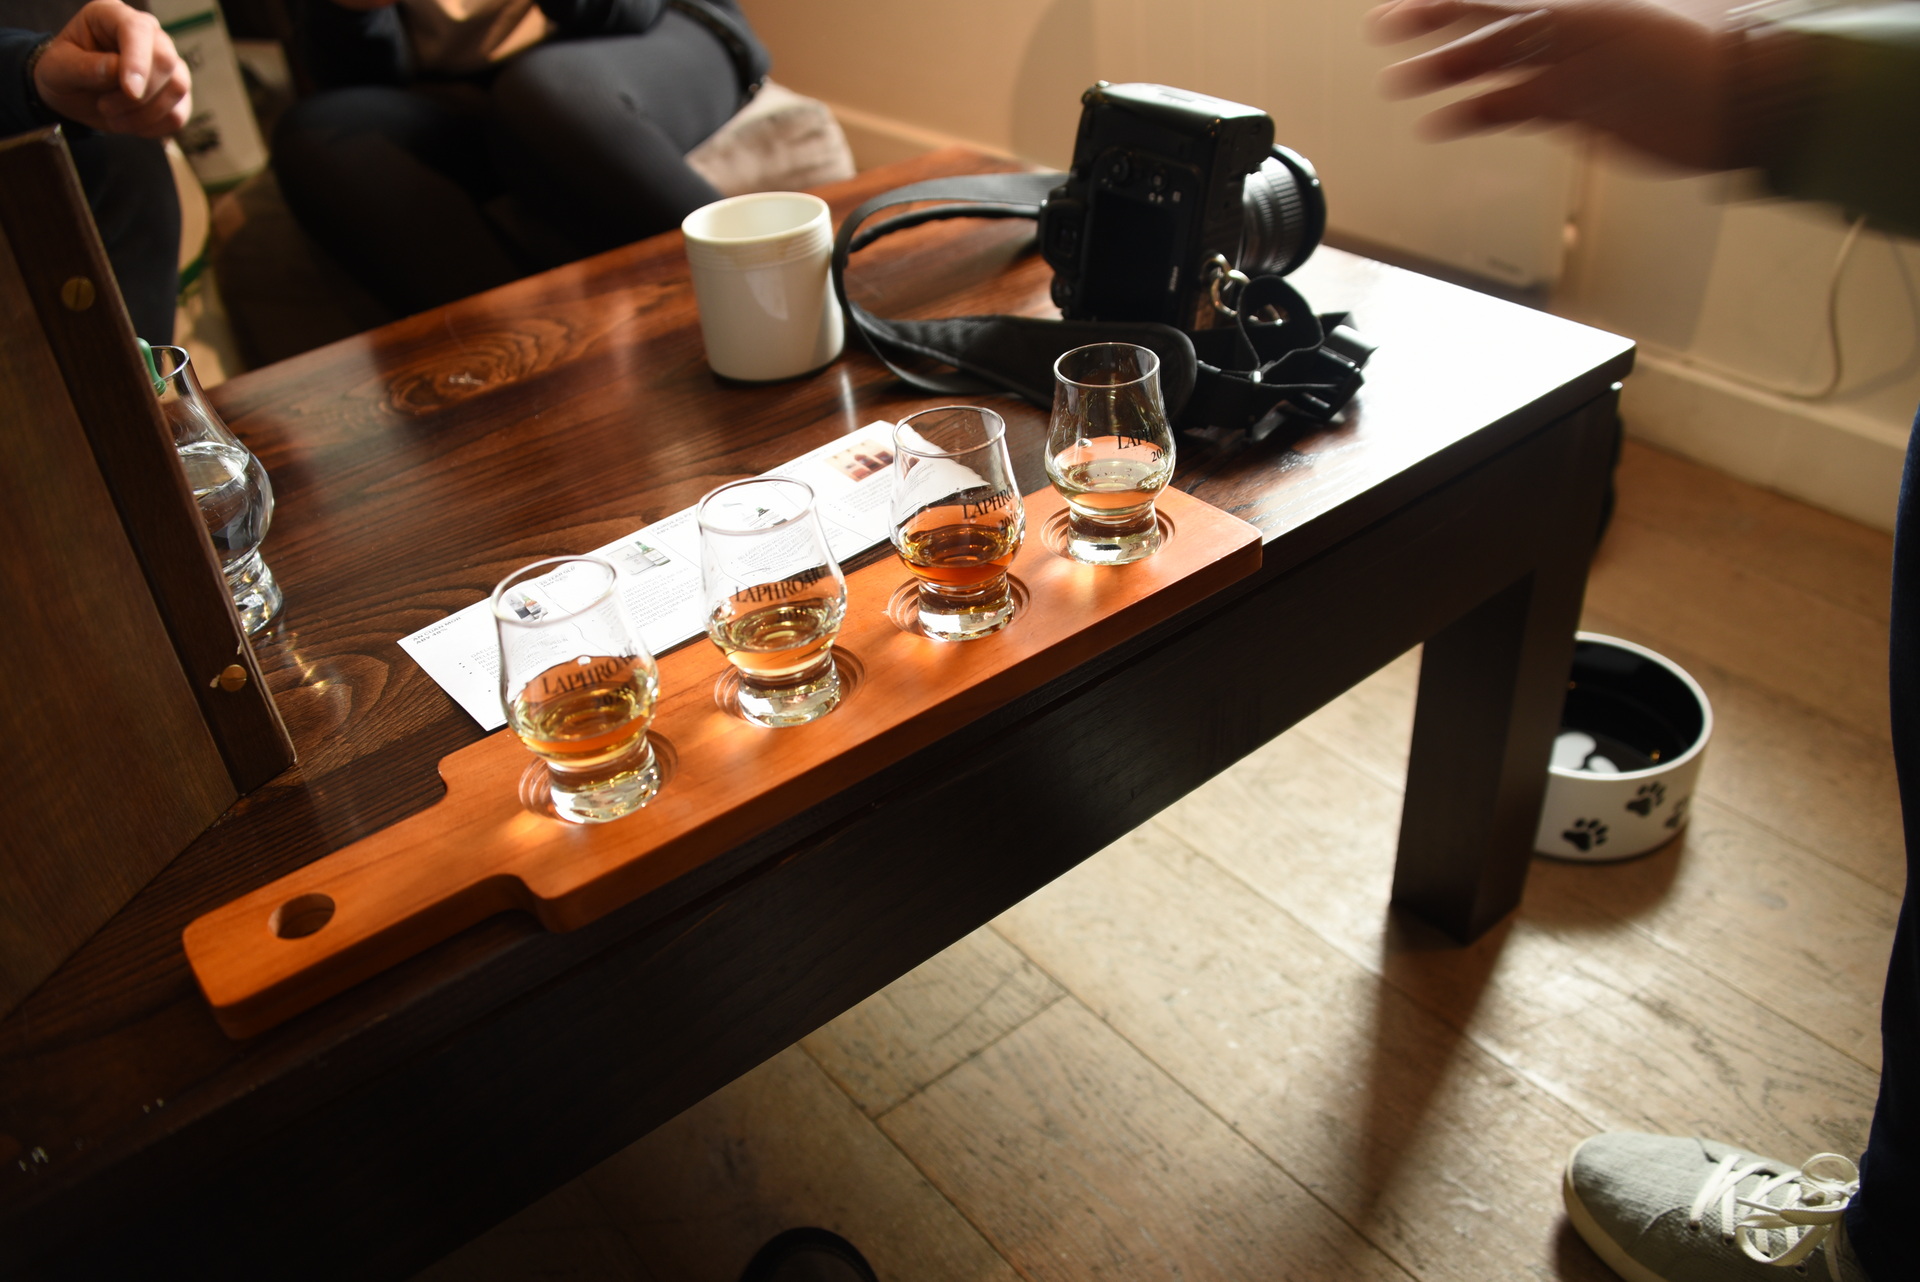
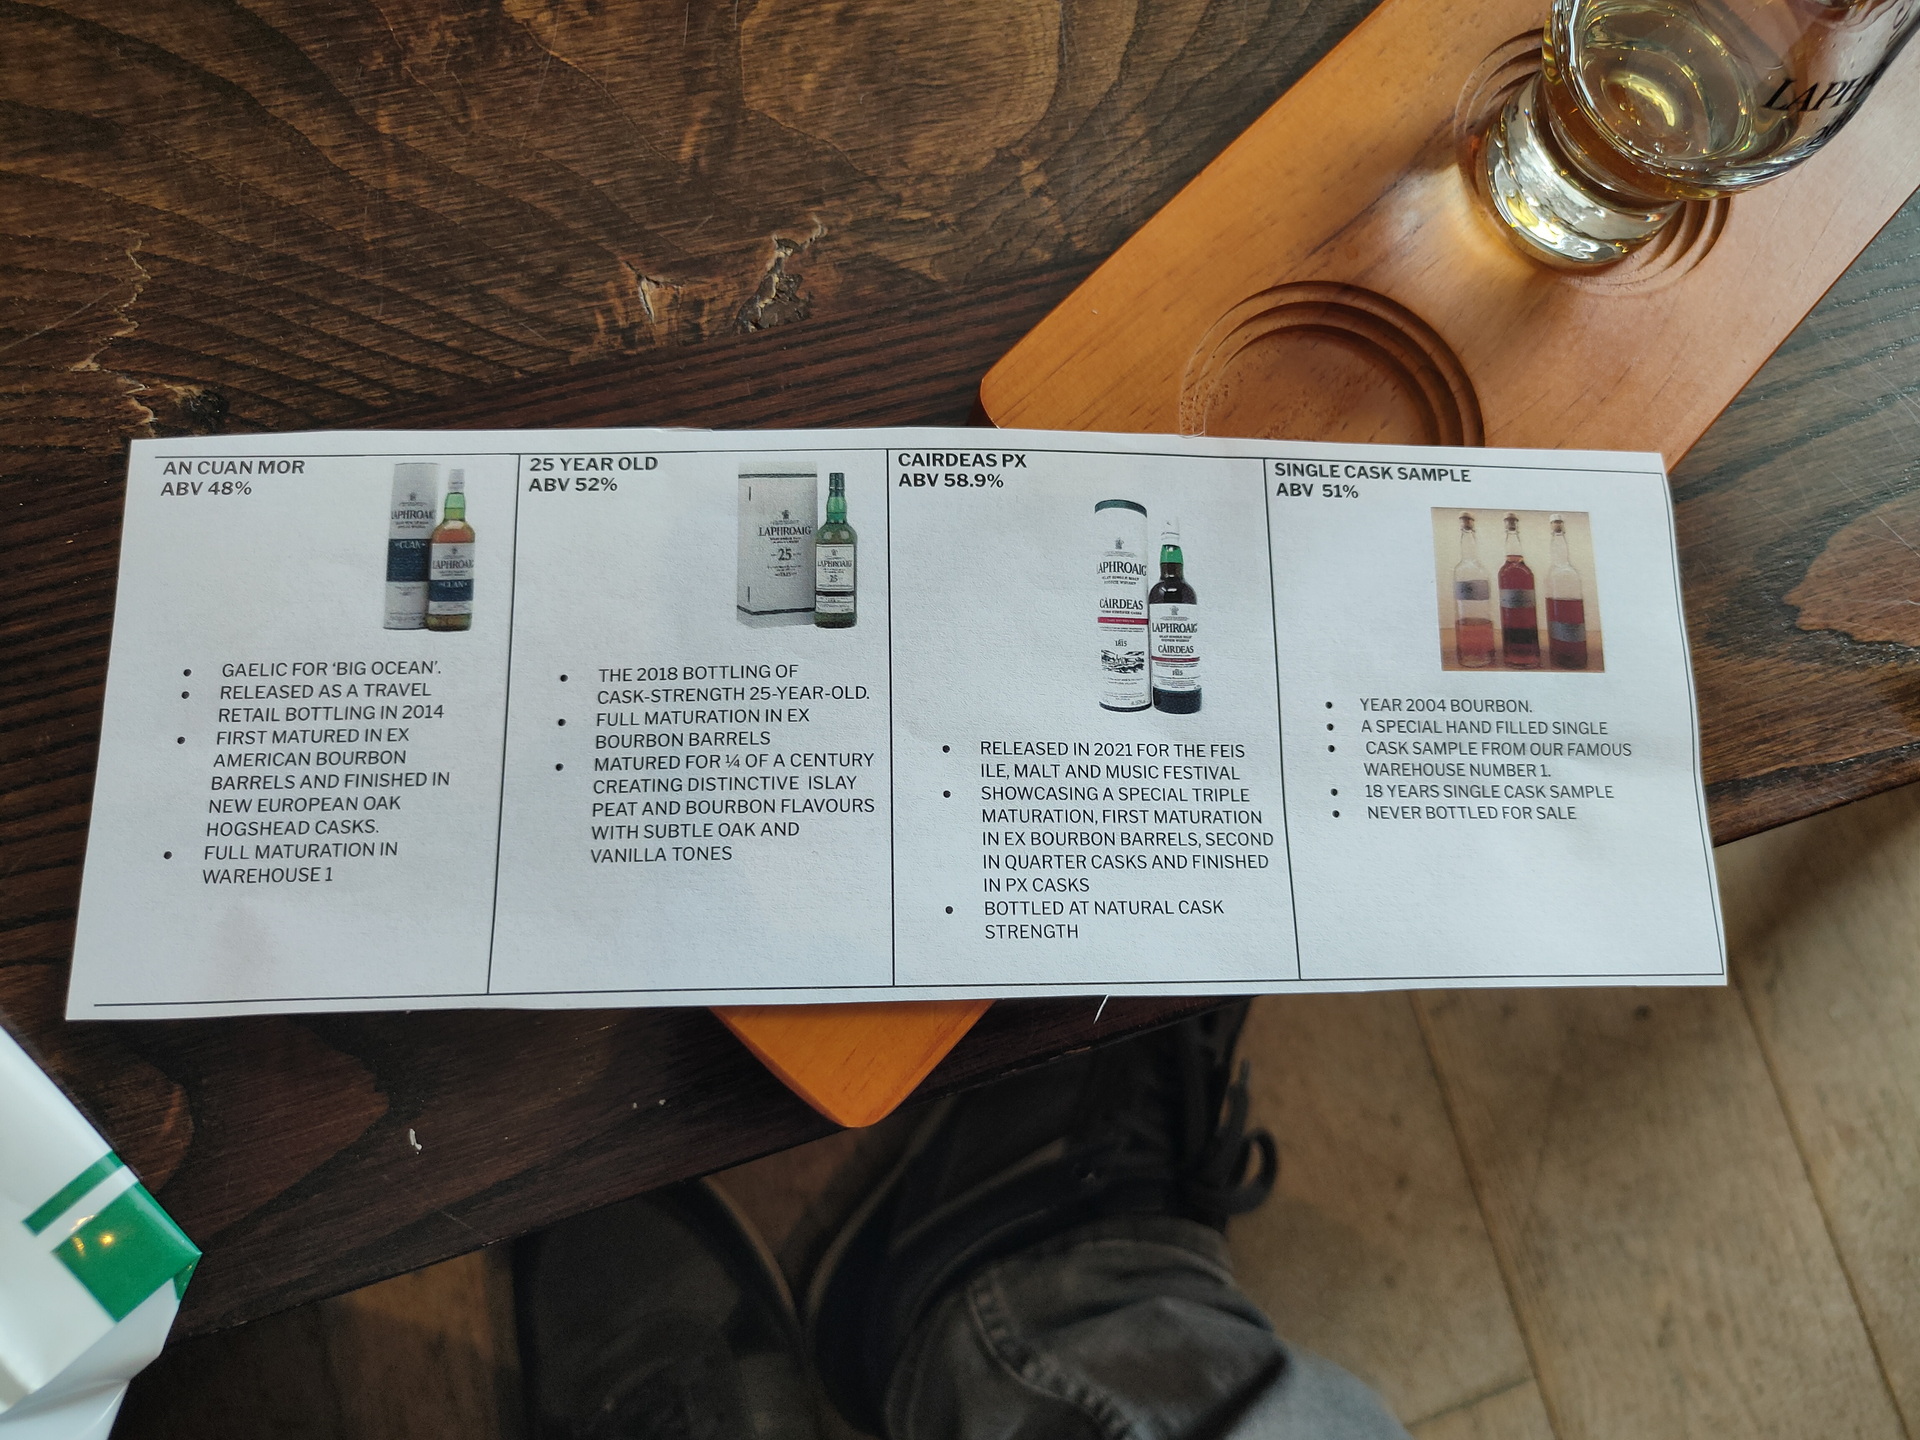
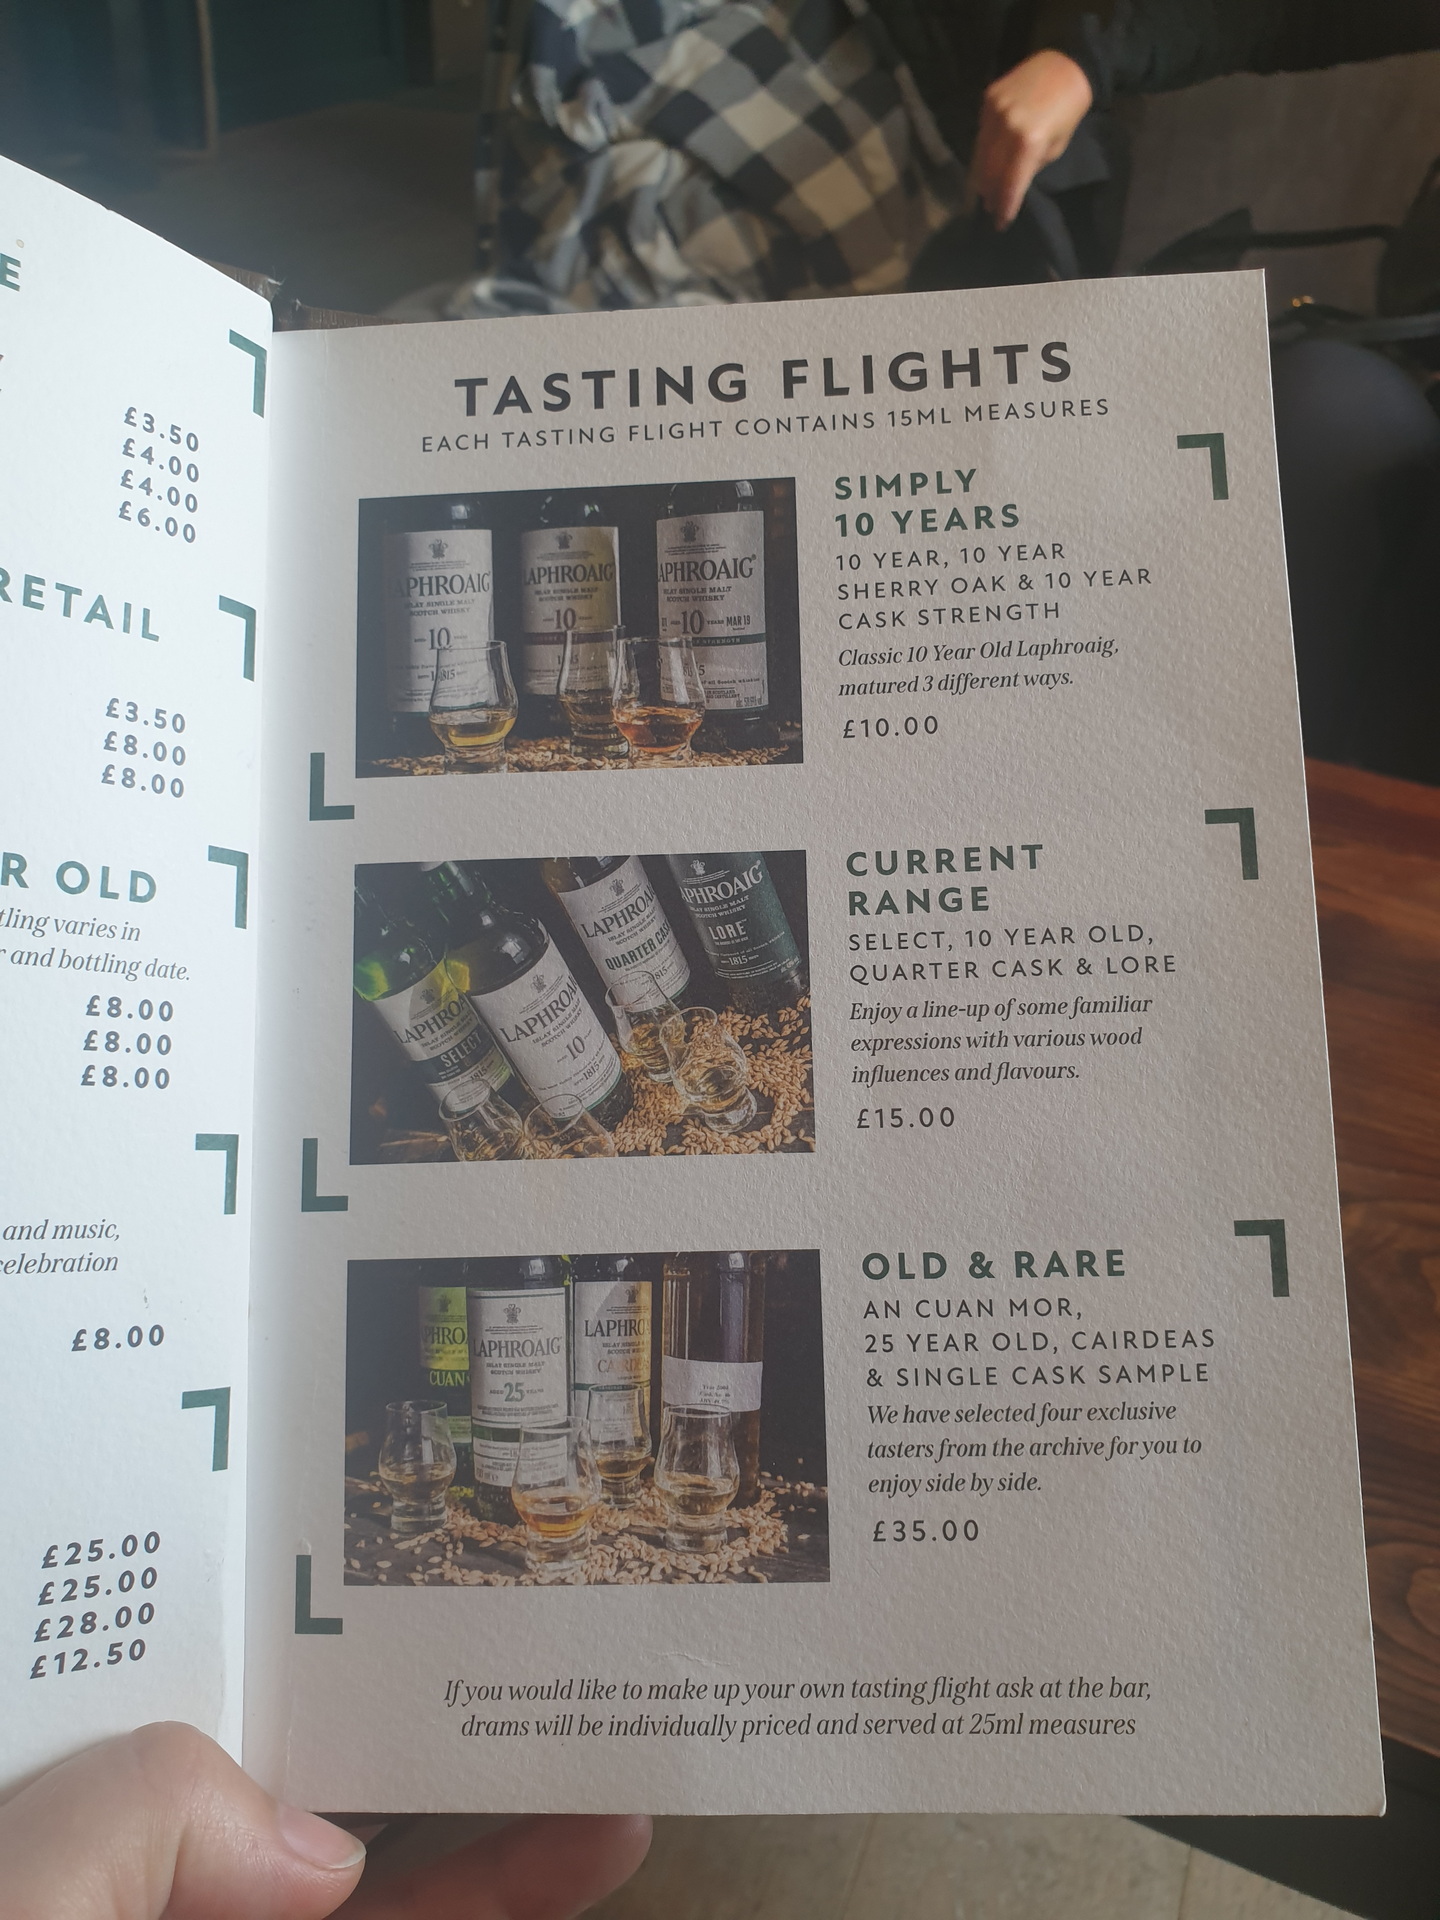
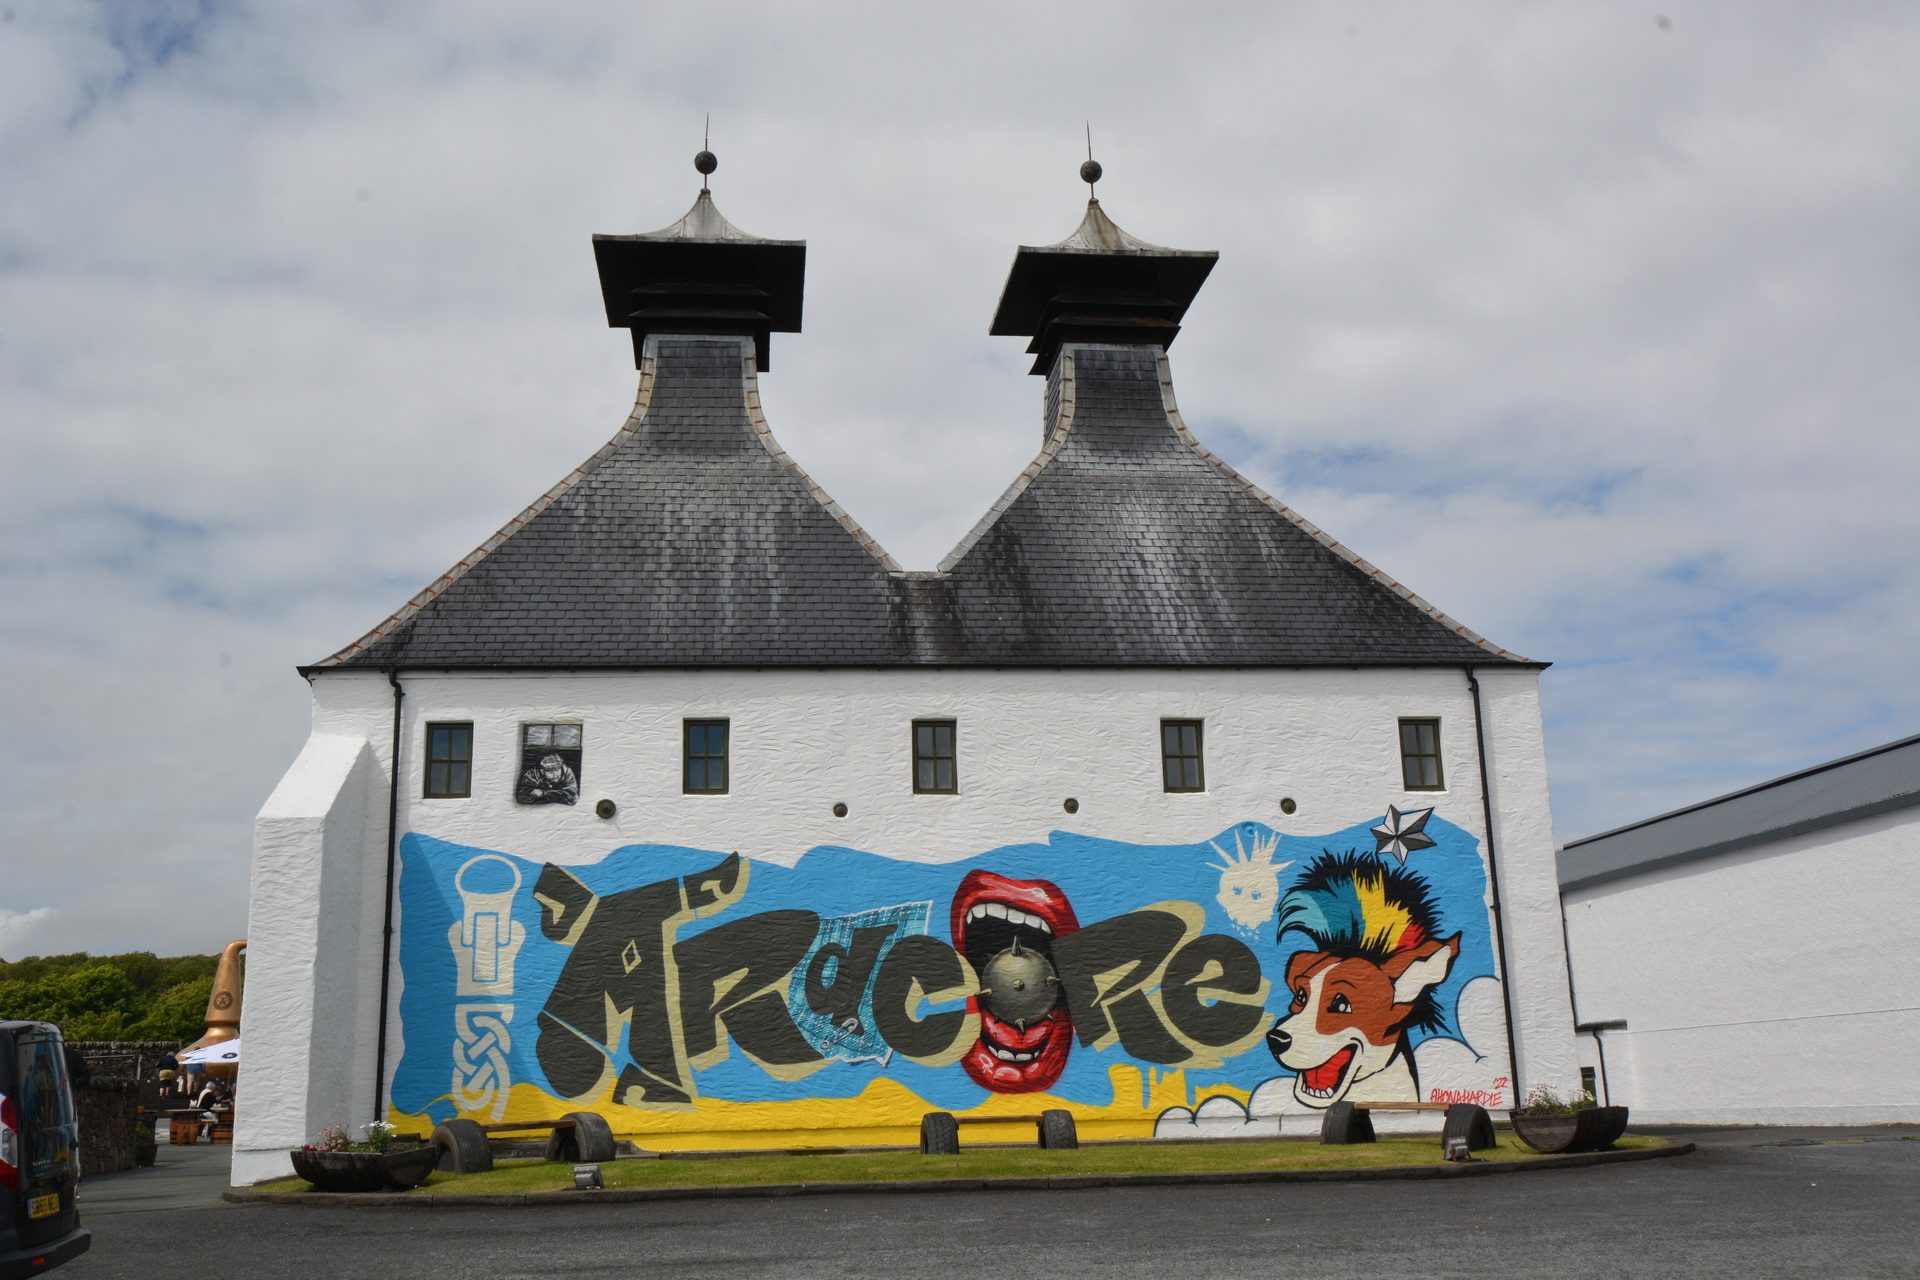
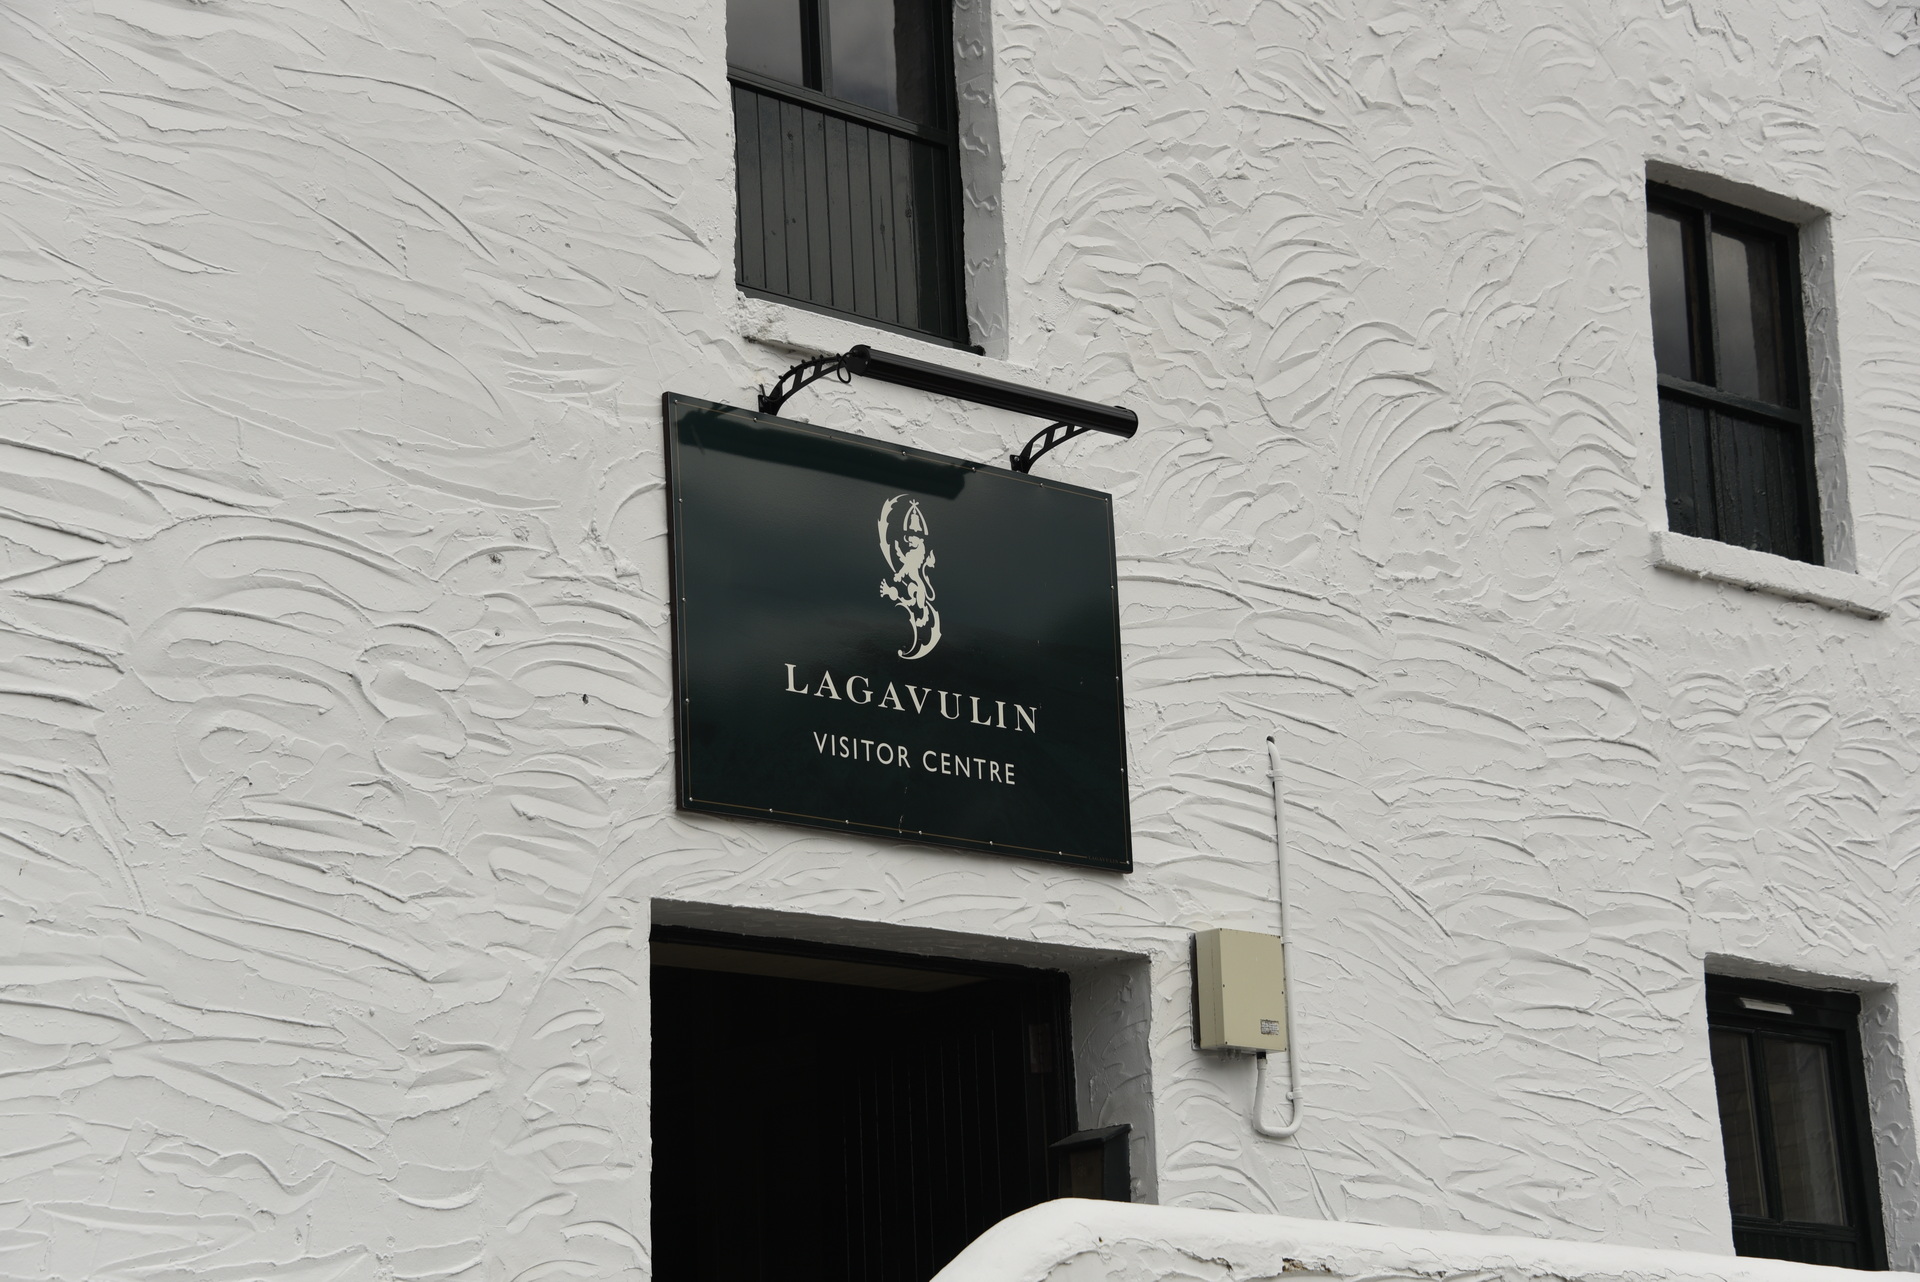
8 Juni – Laphroaig, Ardbeg, Lagavullin distillers (Isle of Islay)
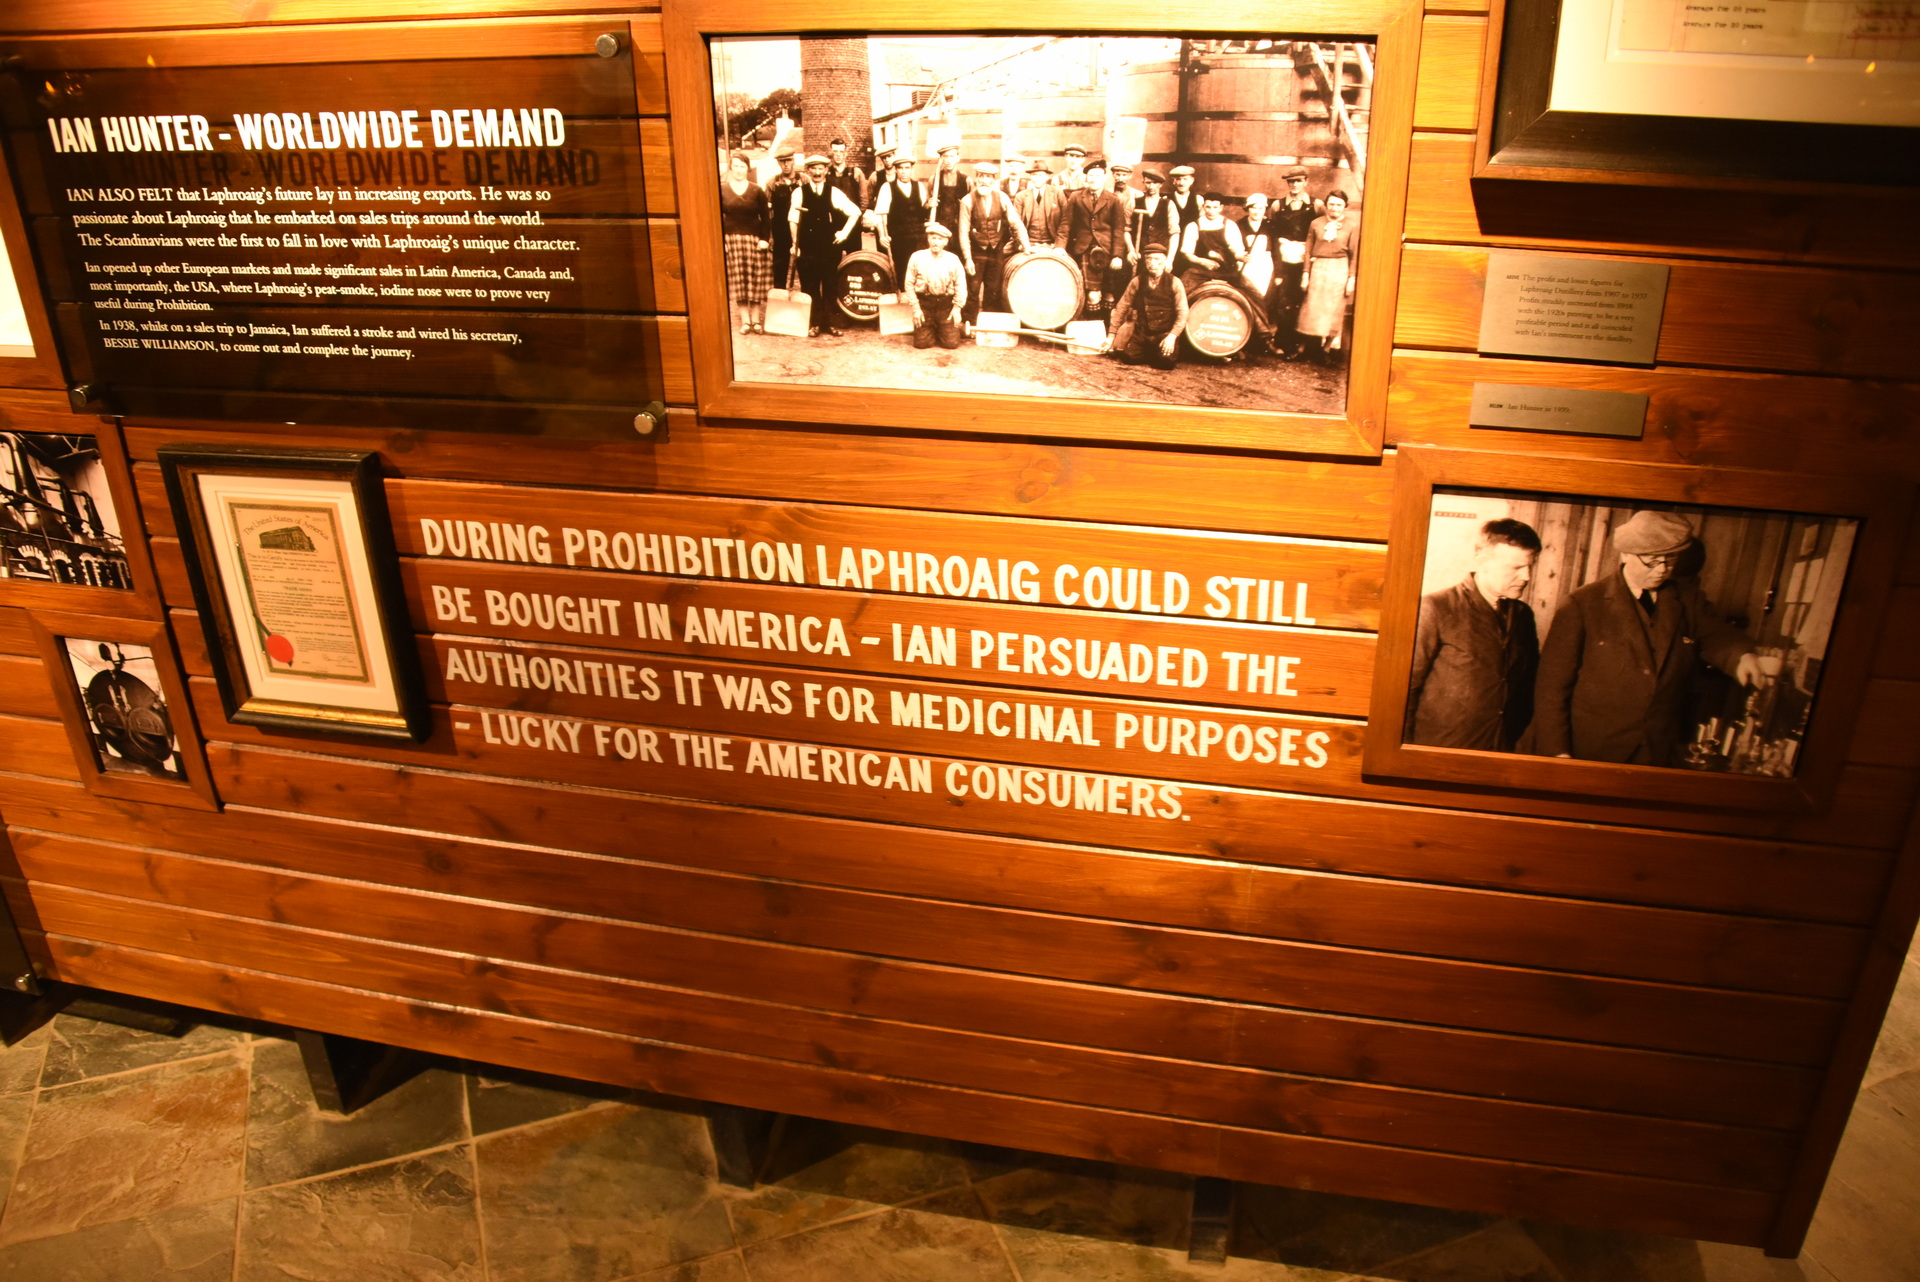
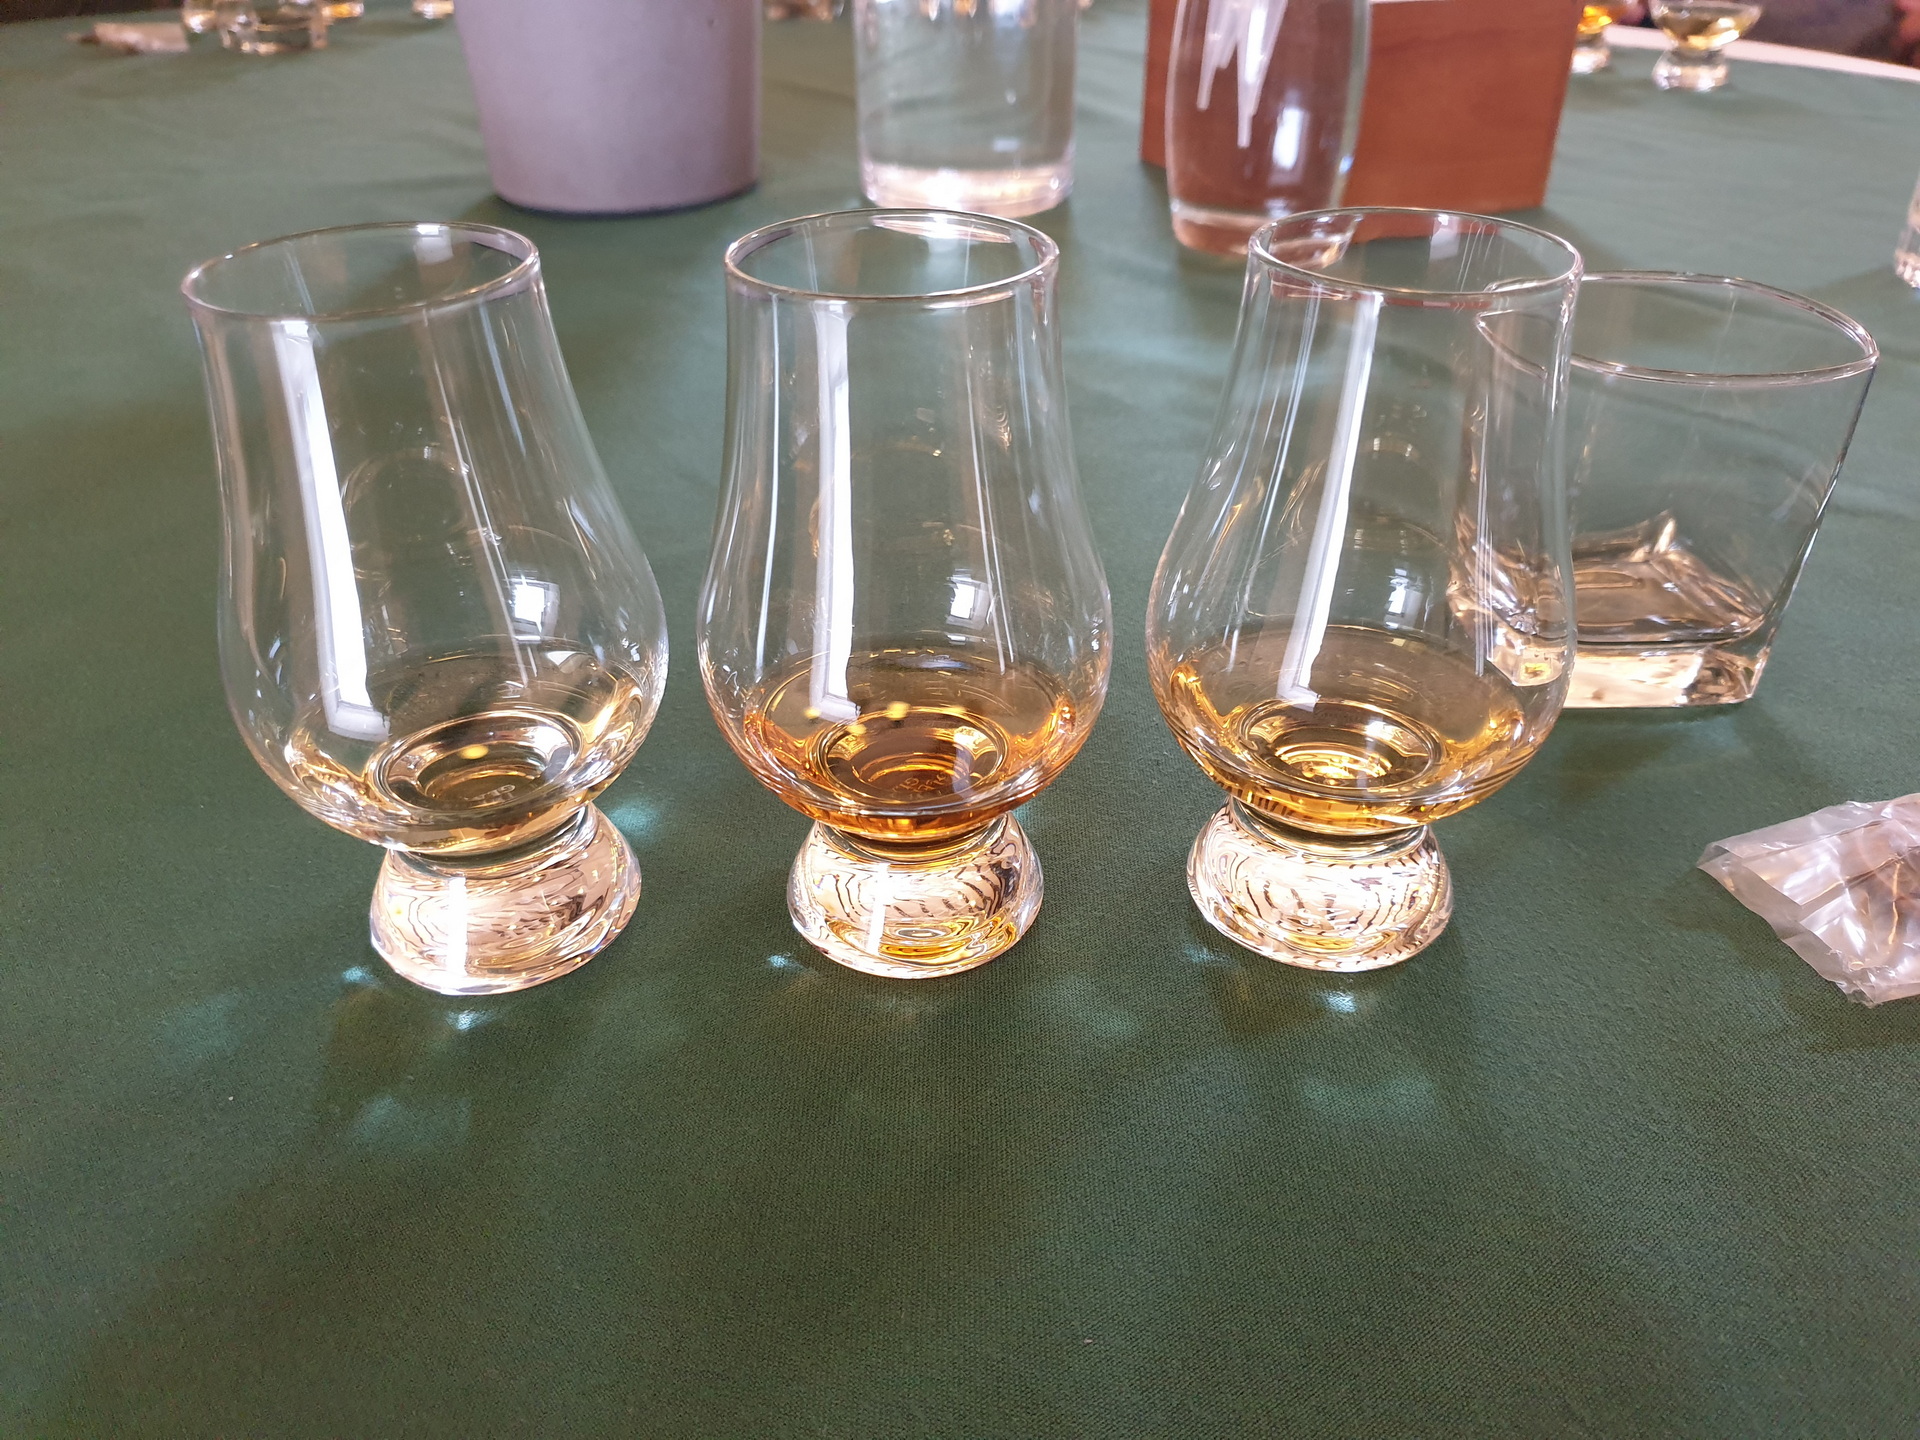
Na een ontbijt van 2 chokolade koekjes en een banaan, de eerste destileerderij Laphroaig bezocht. We zijn door het mini-museumpje gelopen met hierin een aantal informatieborden met hierop de geschiedenis van de distilleerderij. Vervolgens hebben we een taster genomen met 4 whisky’s. We hebben een andere taster in driver’s flesjes meegenomen, en de complimentary drink uit de festival fles. Hier een boek over distillers gekocht.
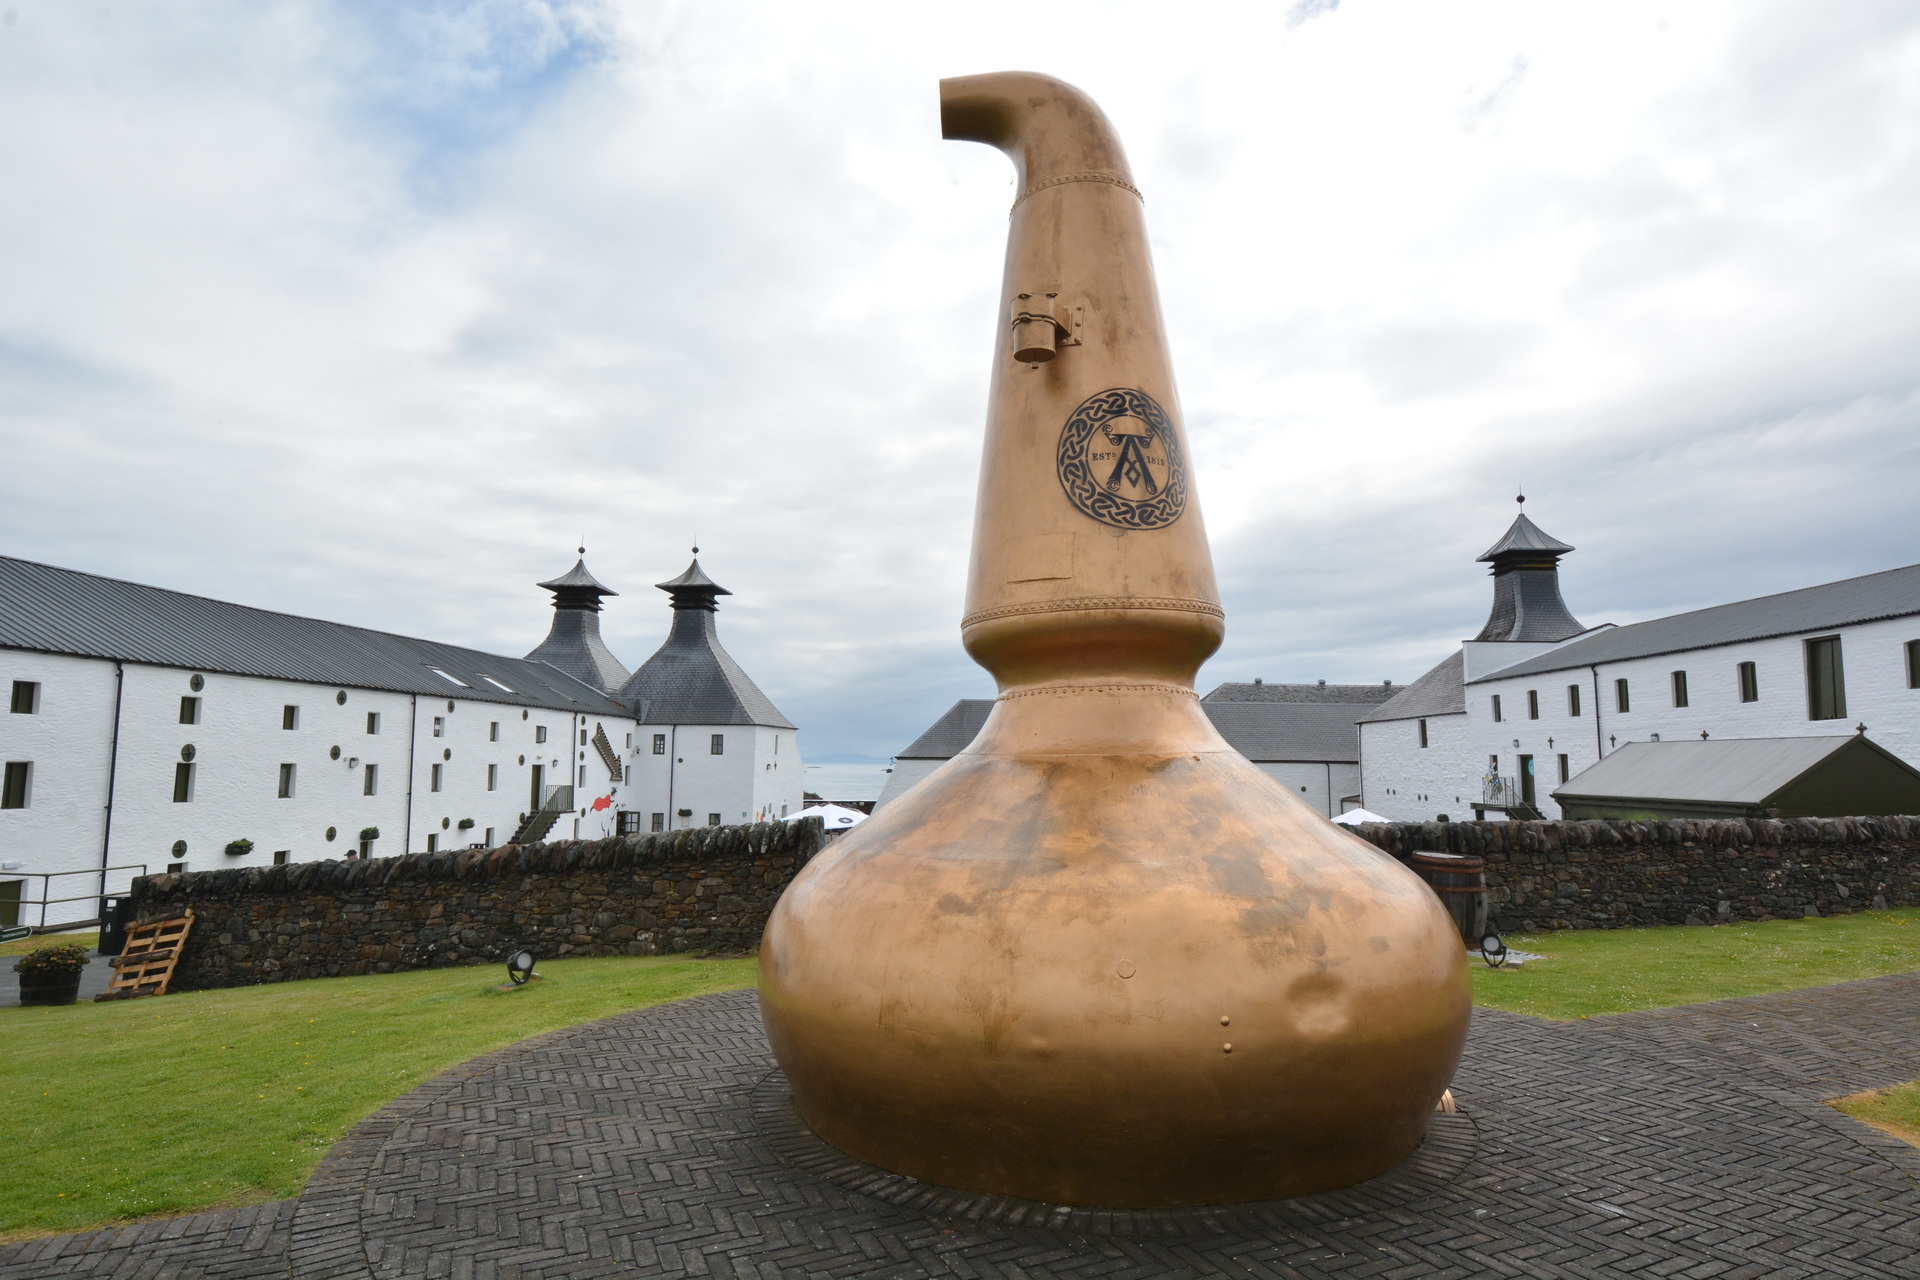
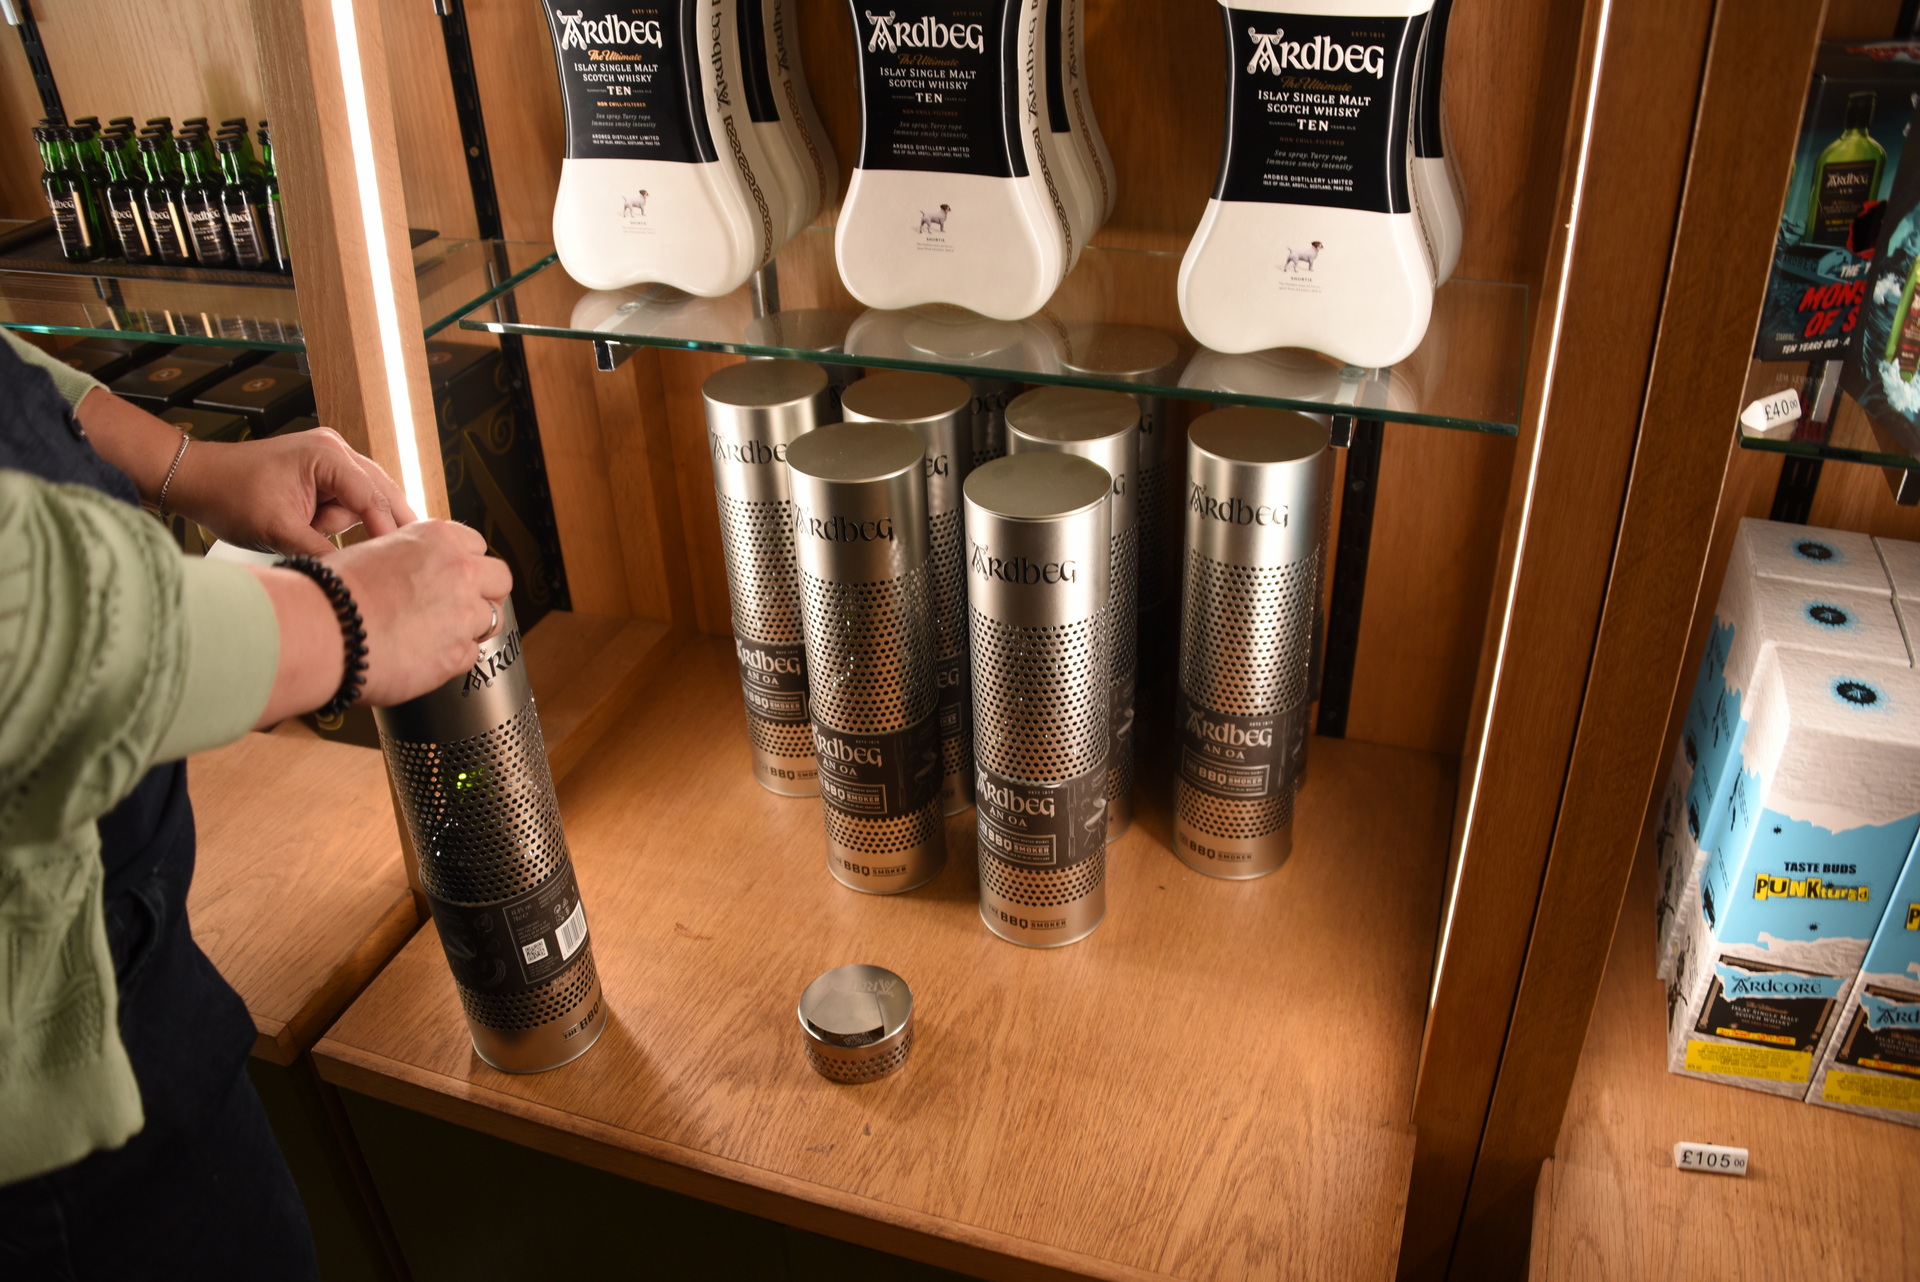
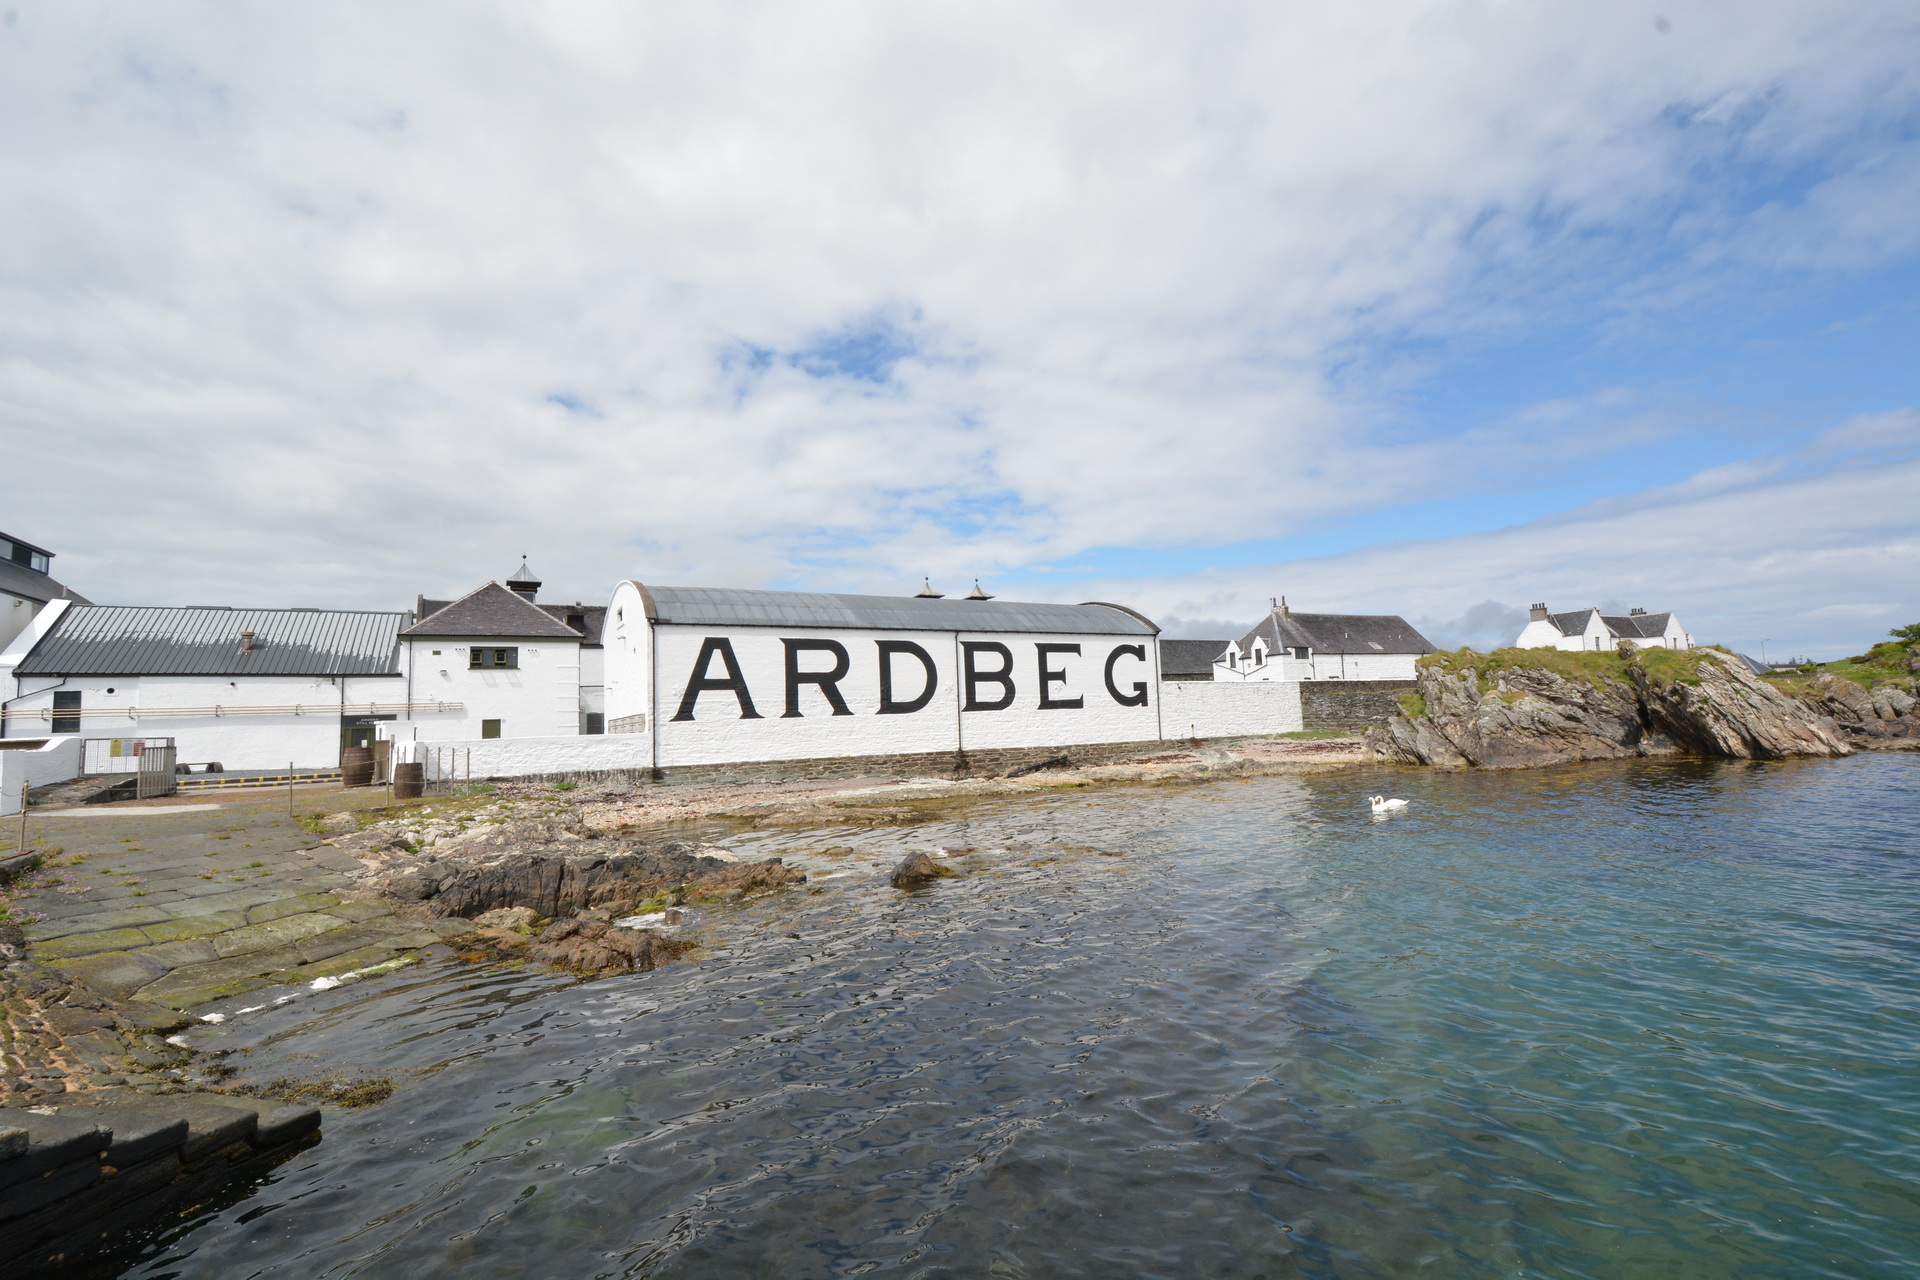
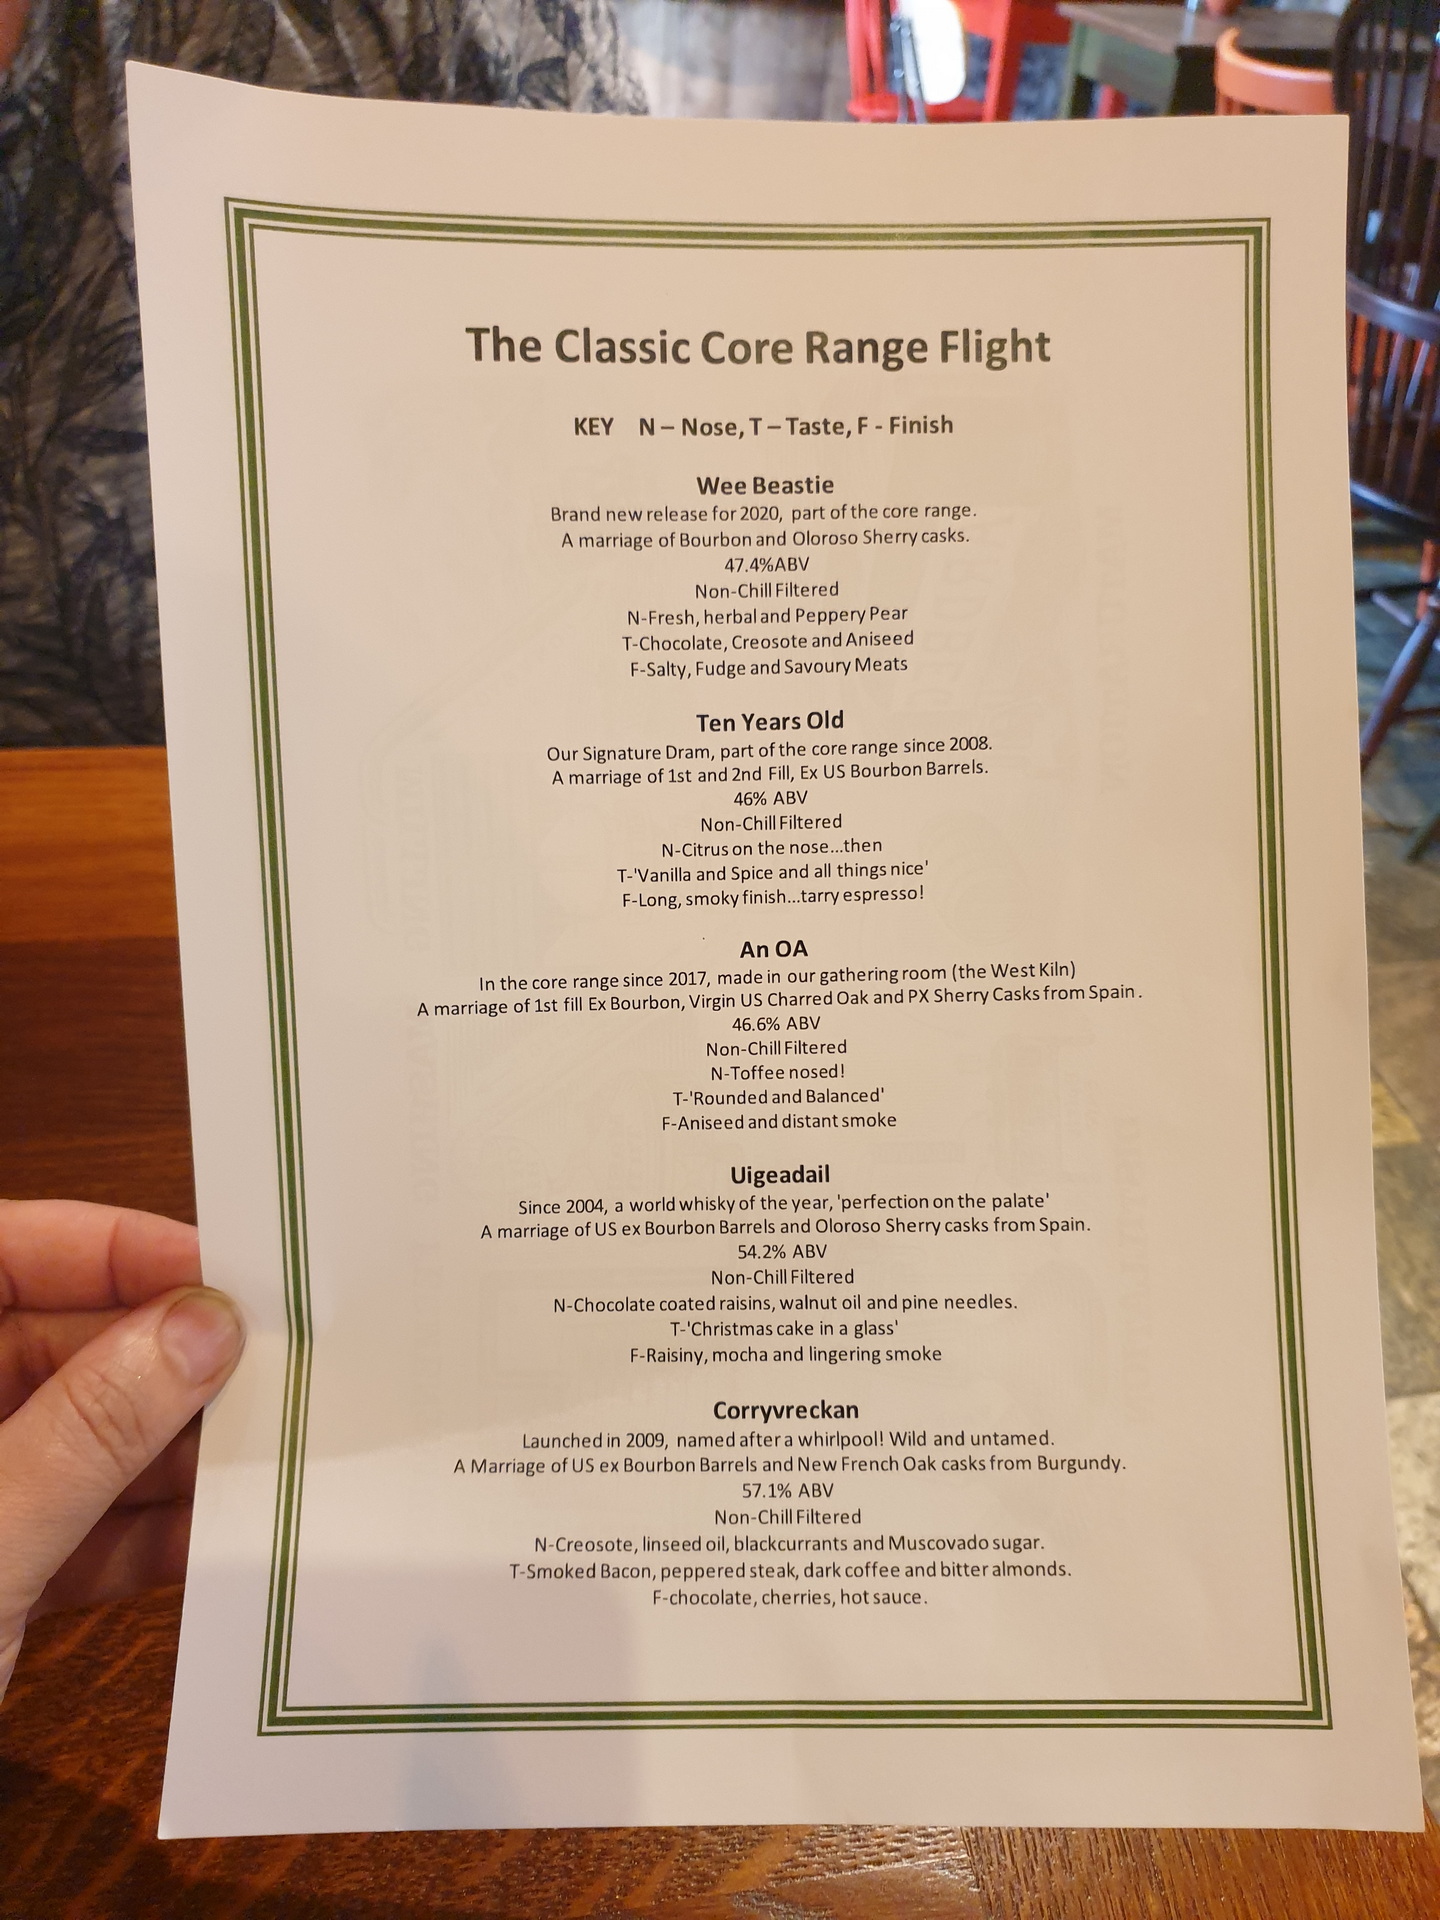
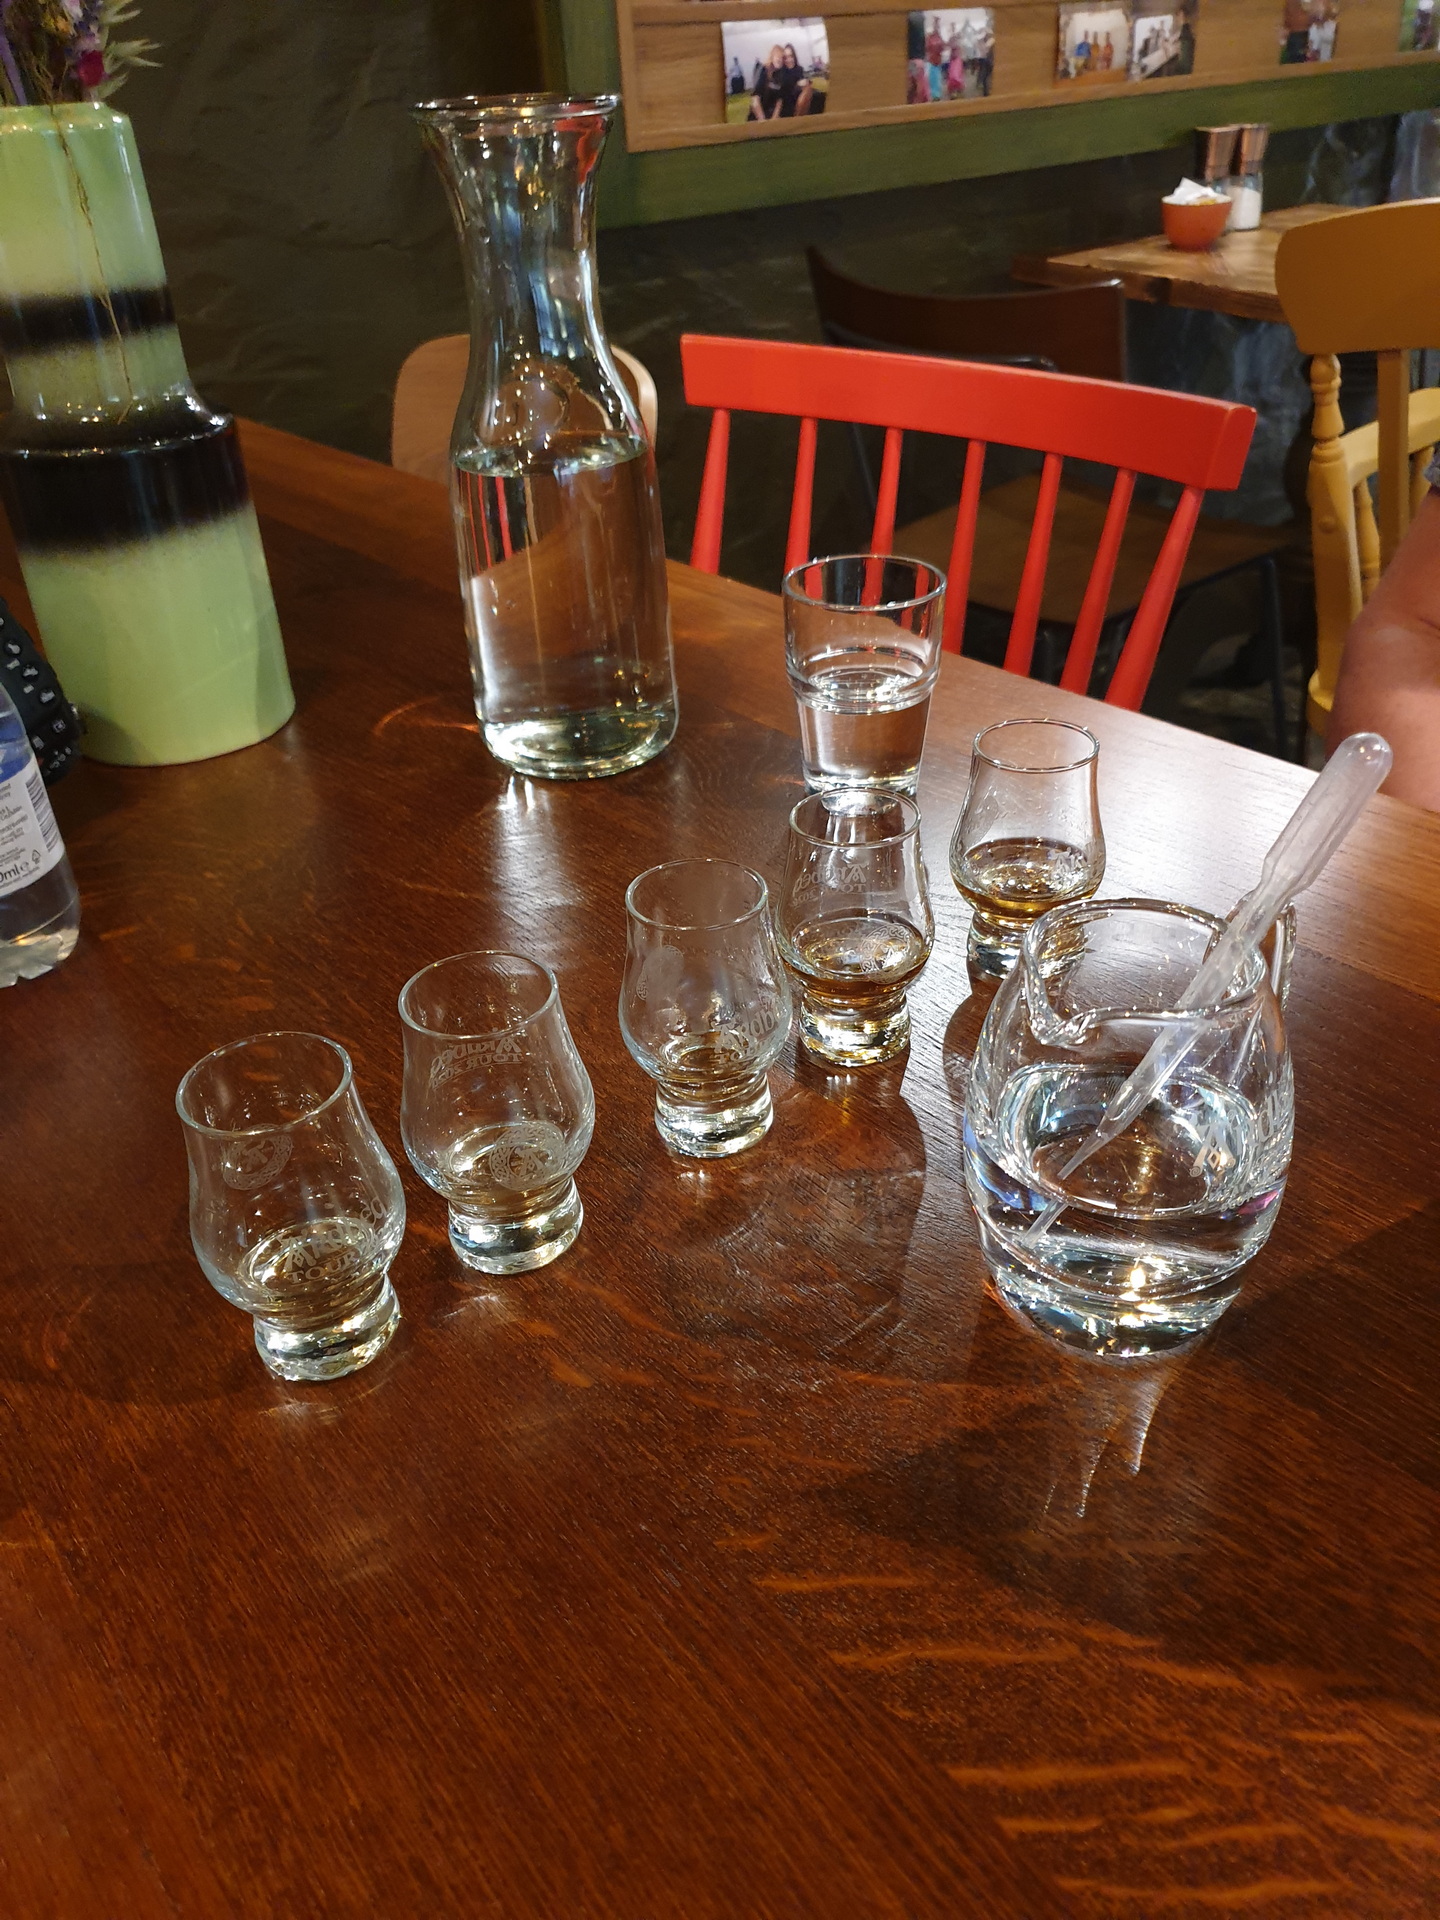
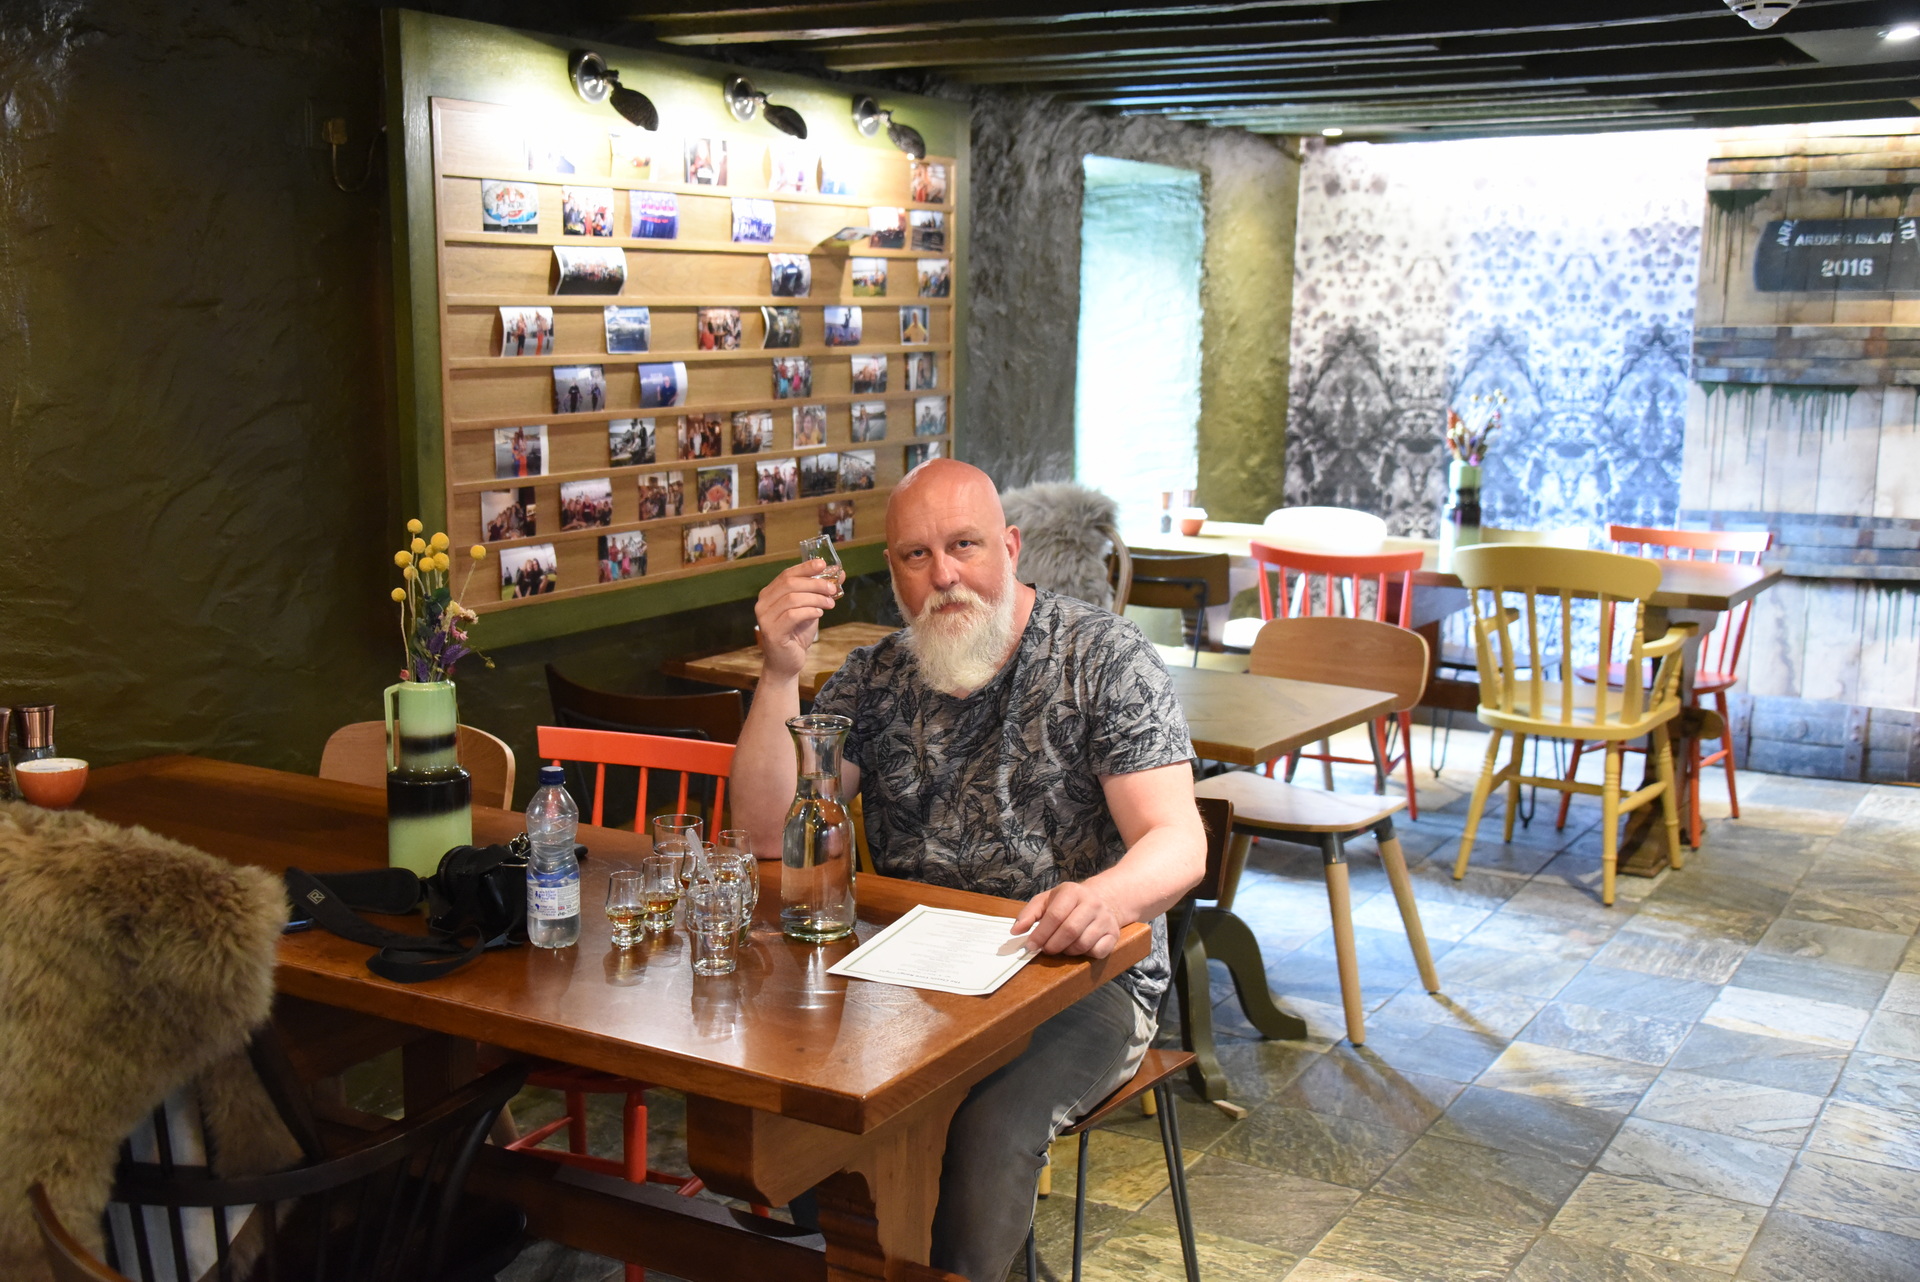
Rond 13en kwamen we aan bij de Ardbeg destileerderij, 7km verderop. Ook hier zijn we eerst door het shopje gelopen. We hebben hier een CD en tunebook van Fraser Shaw gekocht. Vervolgens hebben we een broodje gehaald bij de foodtruck die buiten stond, en hebben we deze buiten opgegeten (gelukkig was het nog steeds droog). Ook hier hebben we weer een taster genomen van 5 whisky’s.
BBQ Smoker kokerSláinte !
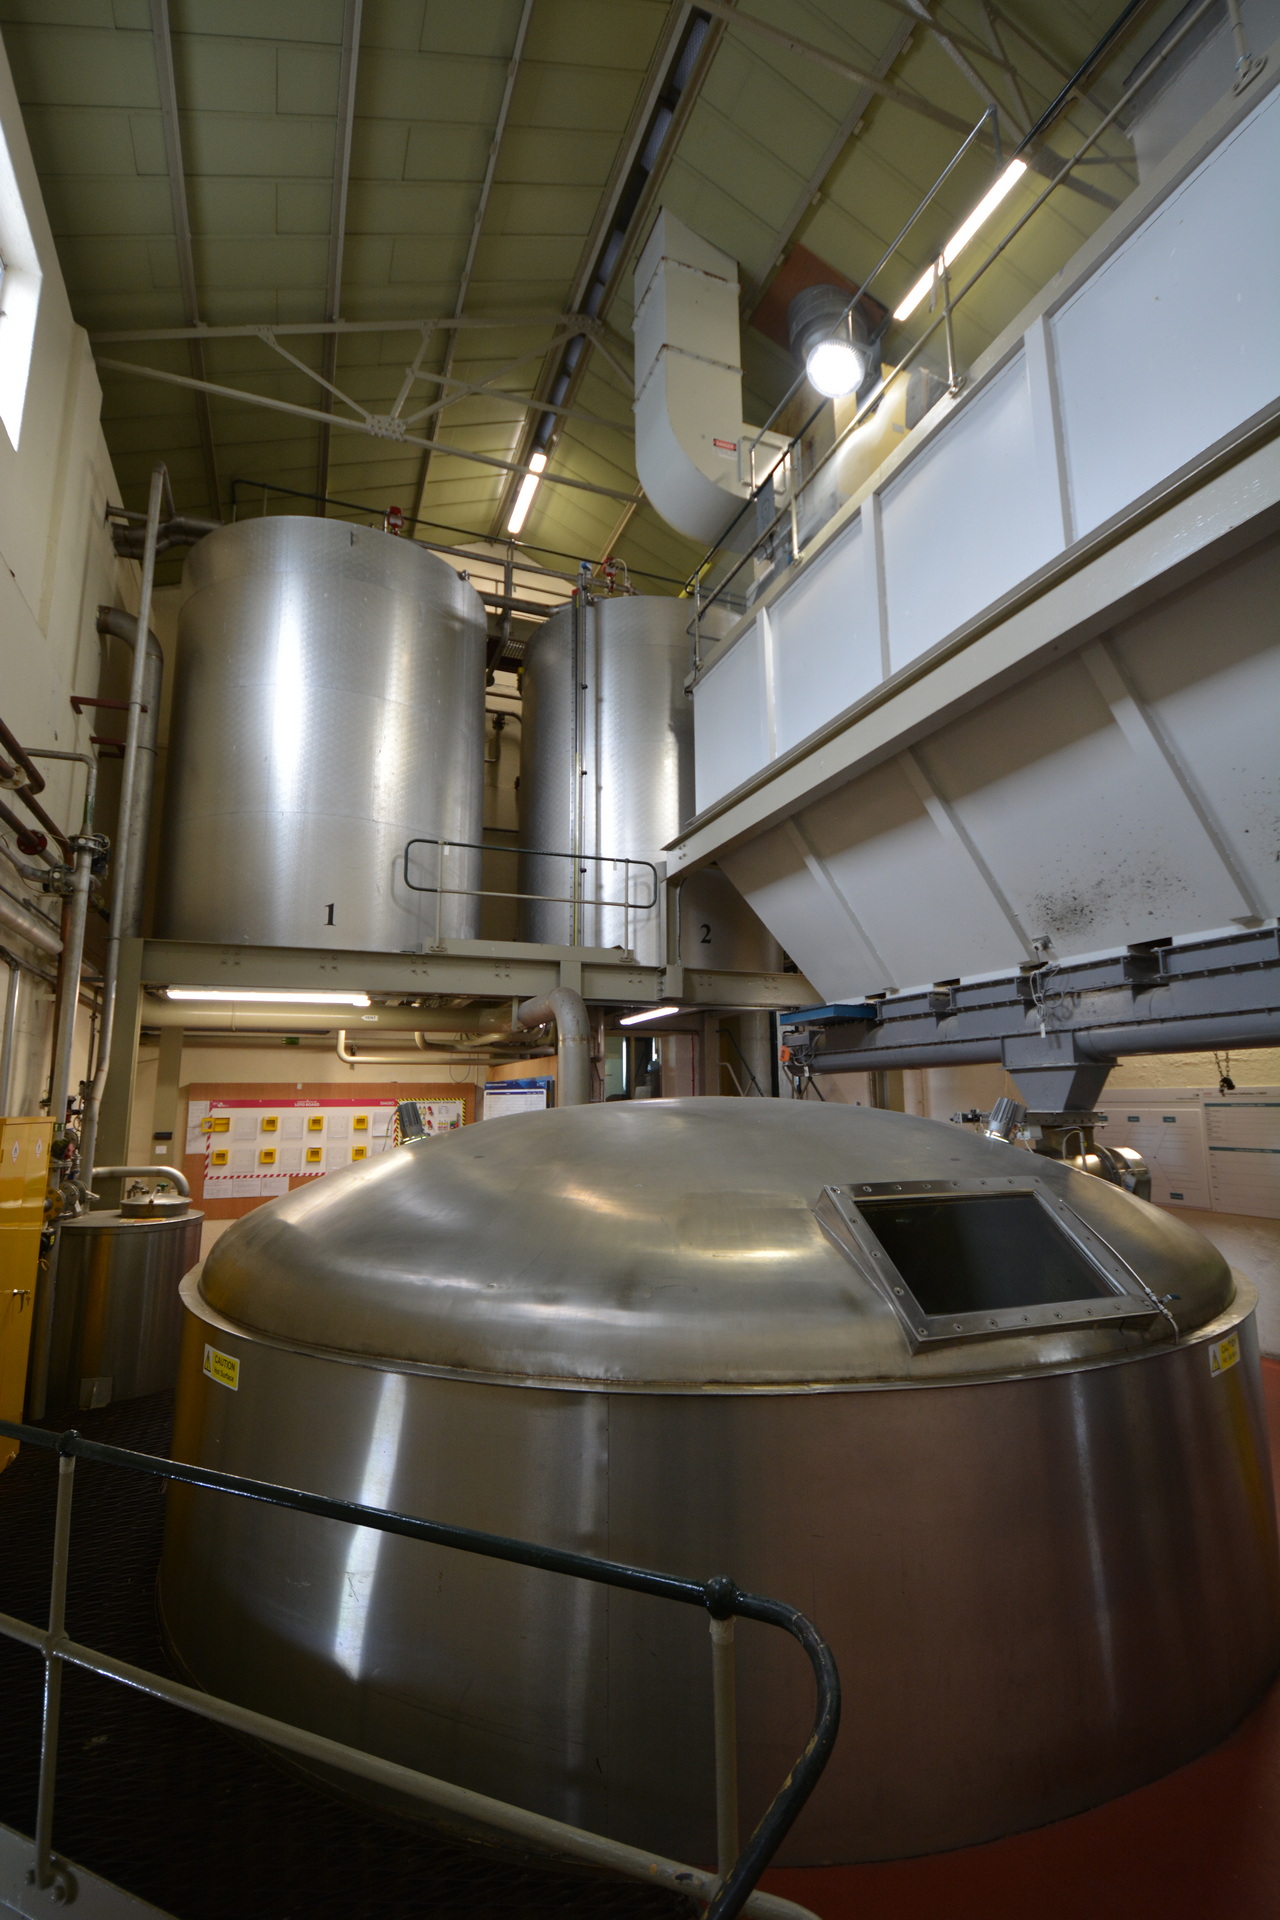
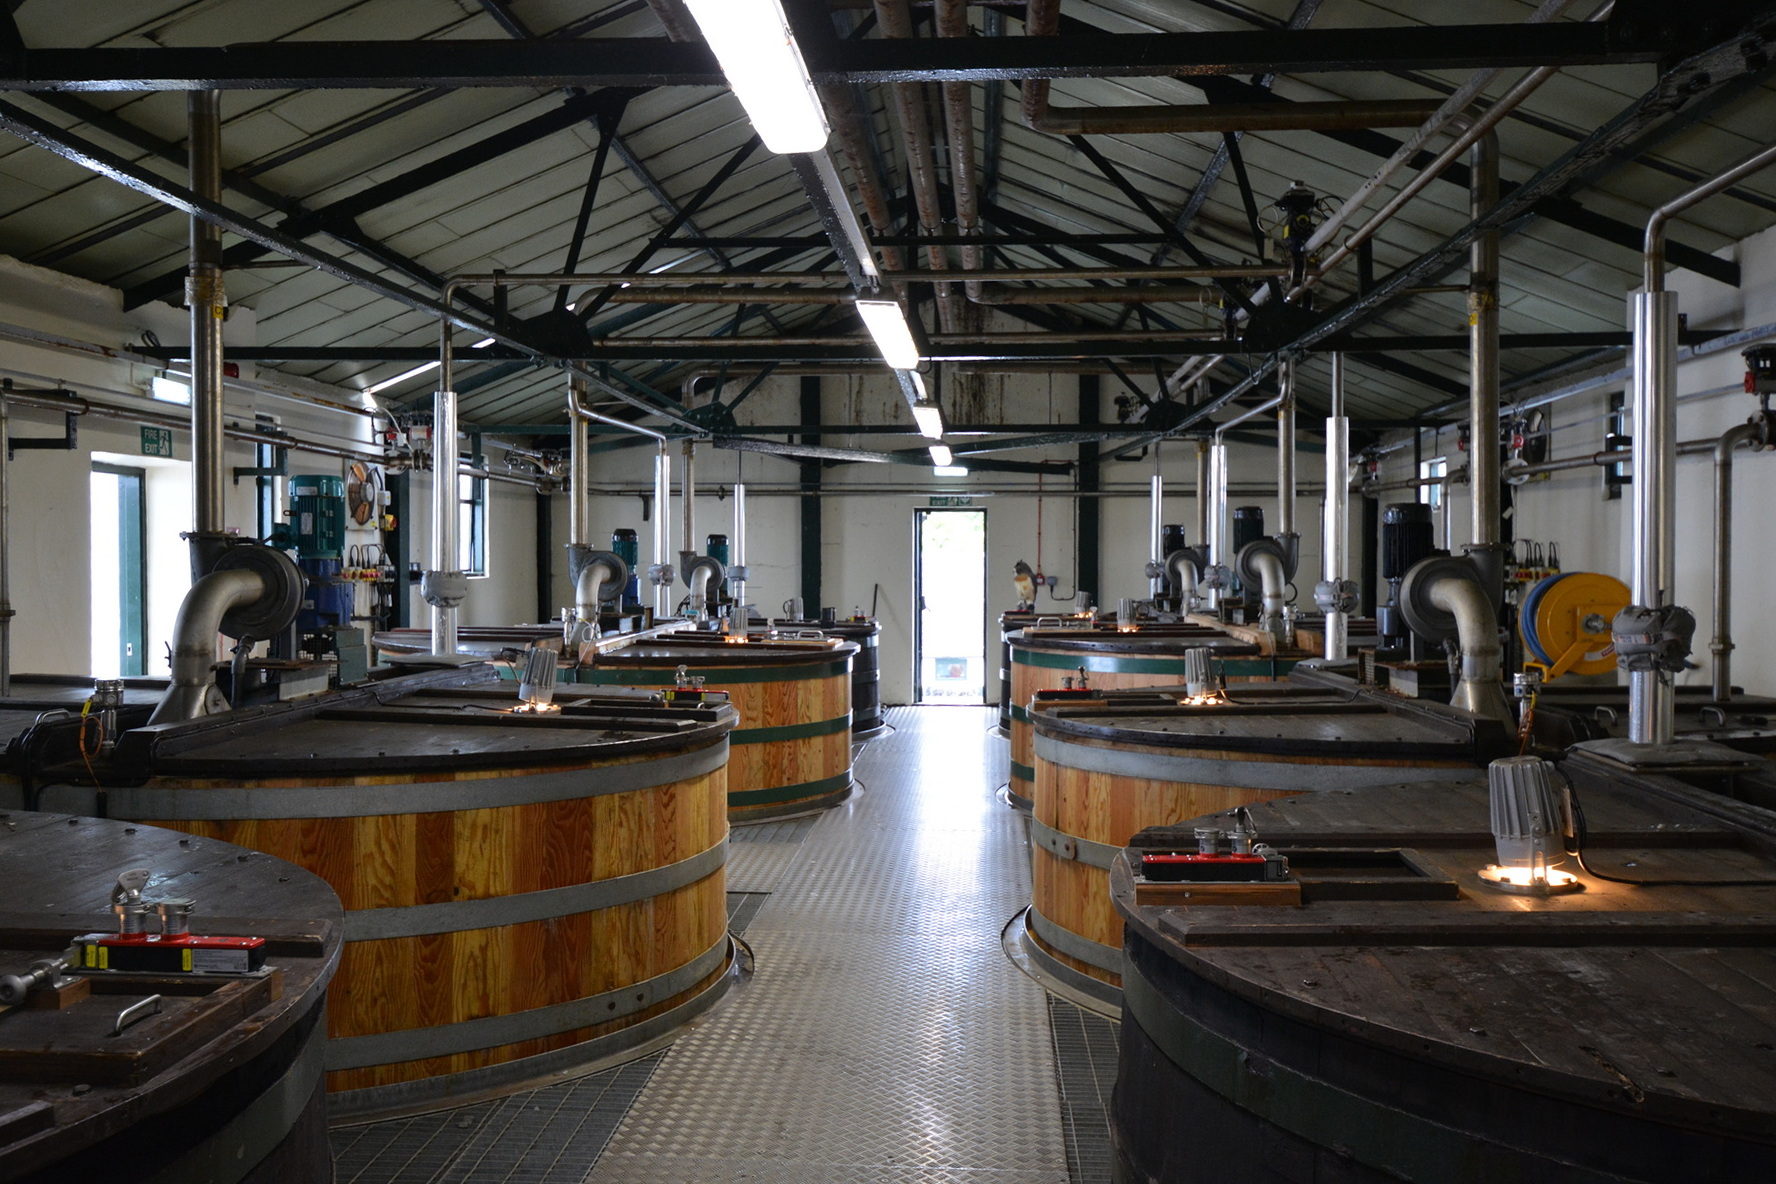
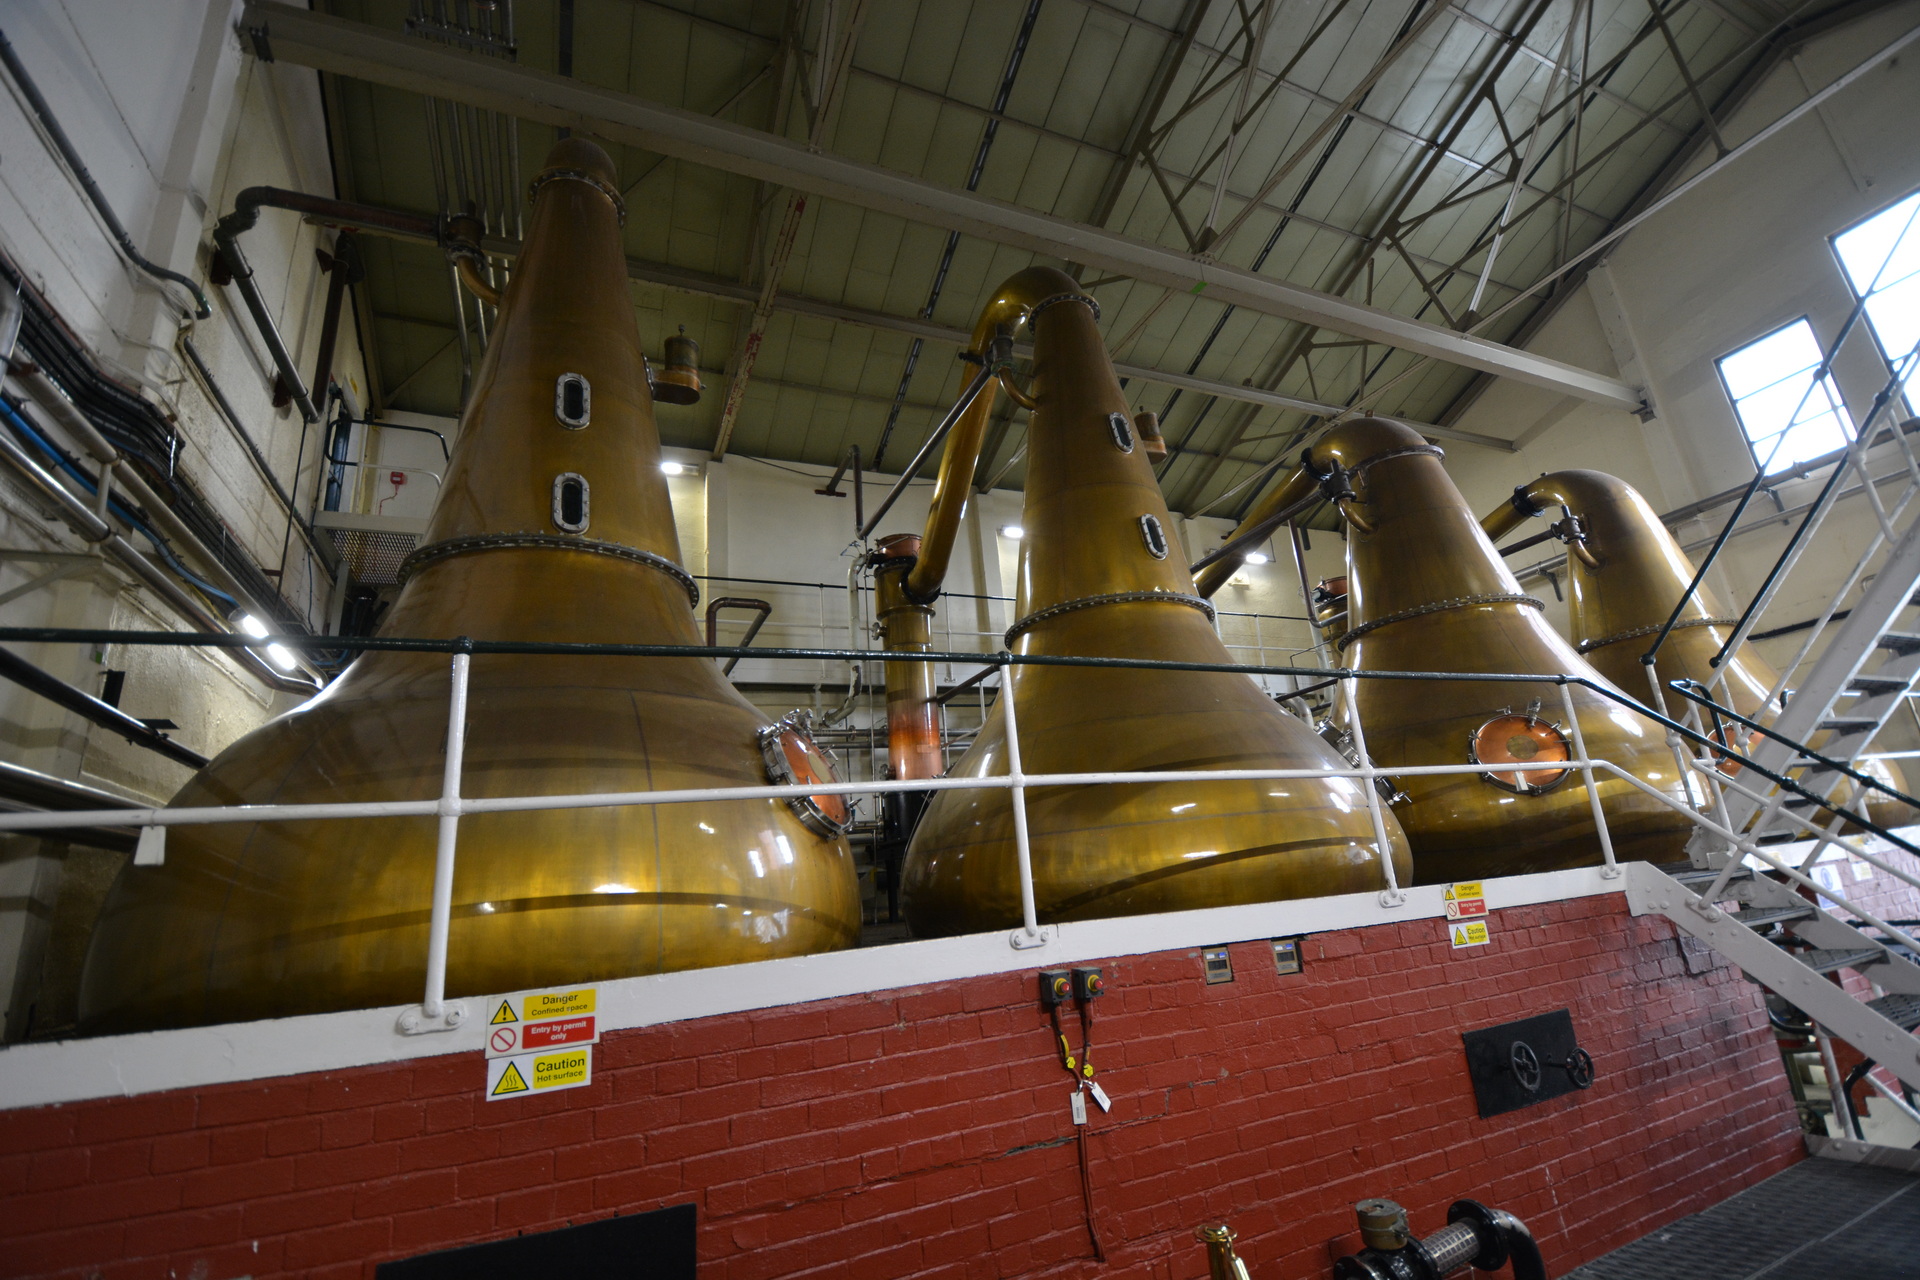
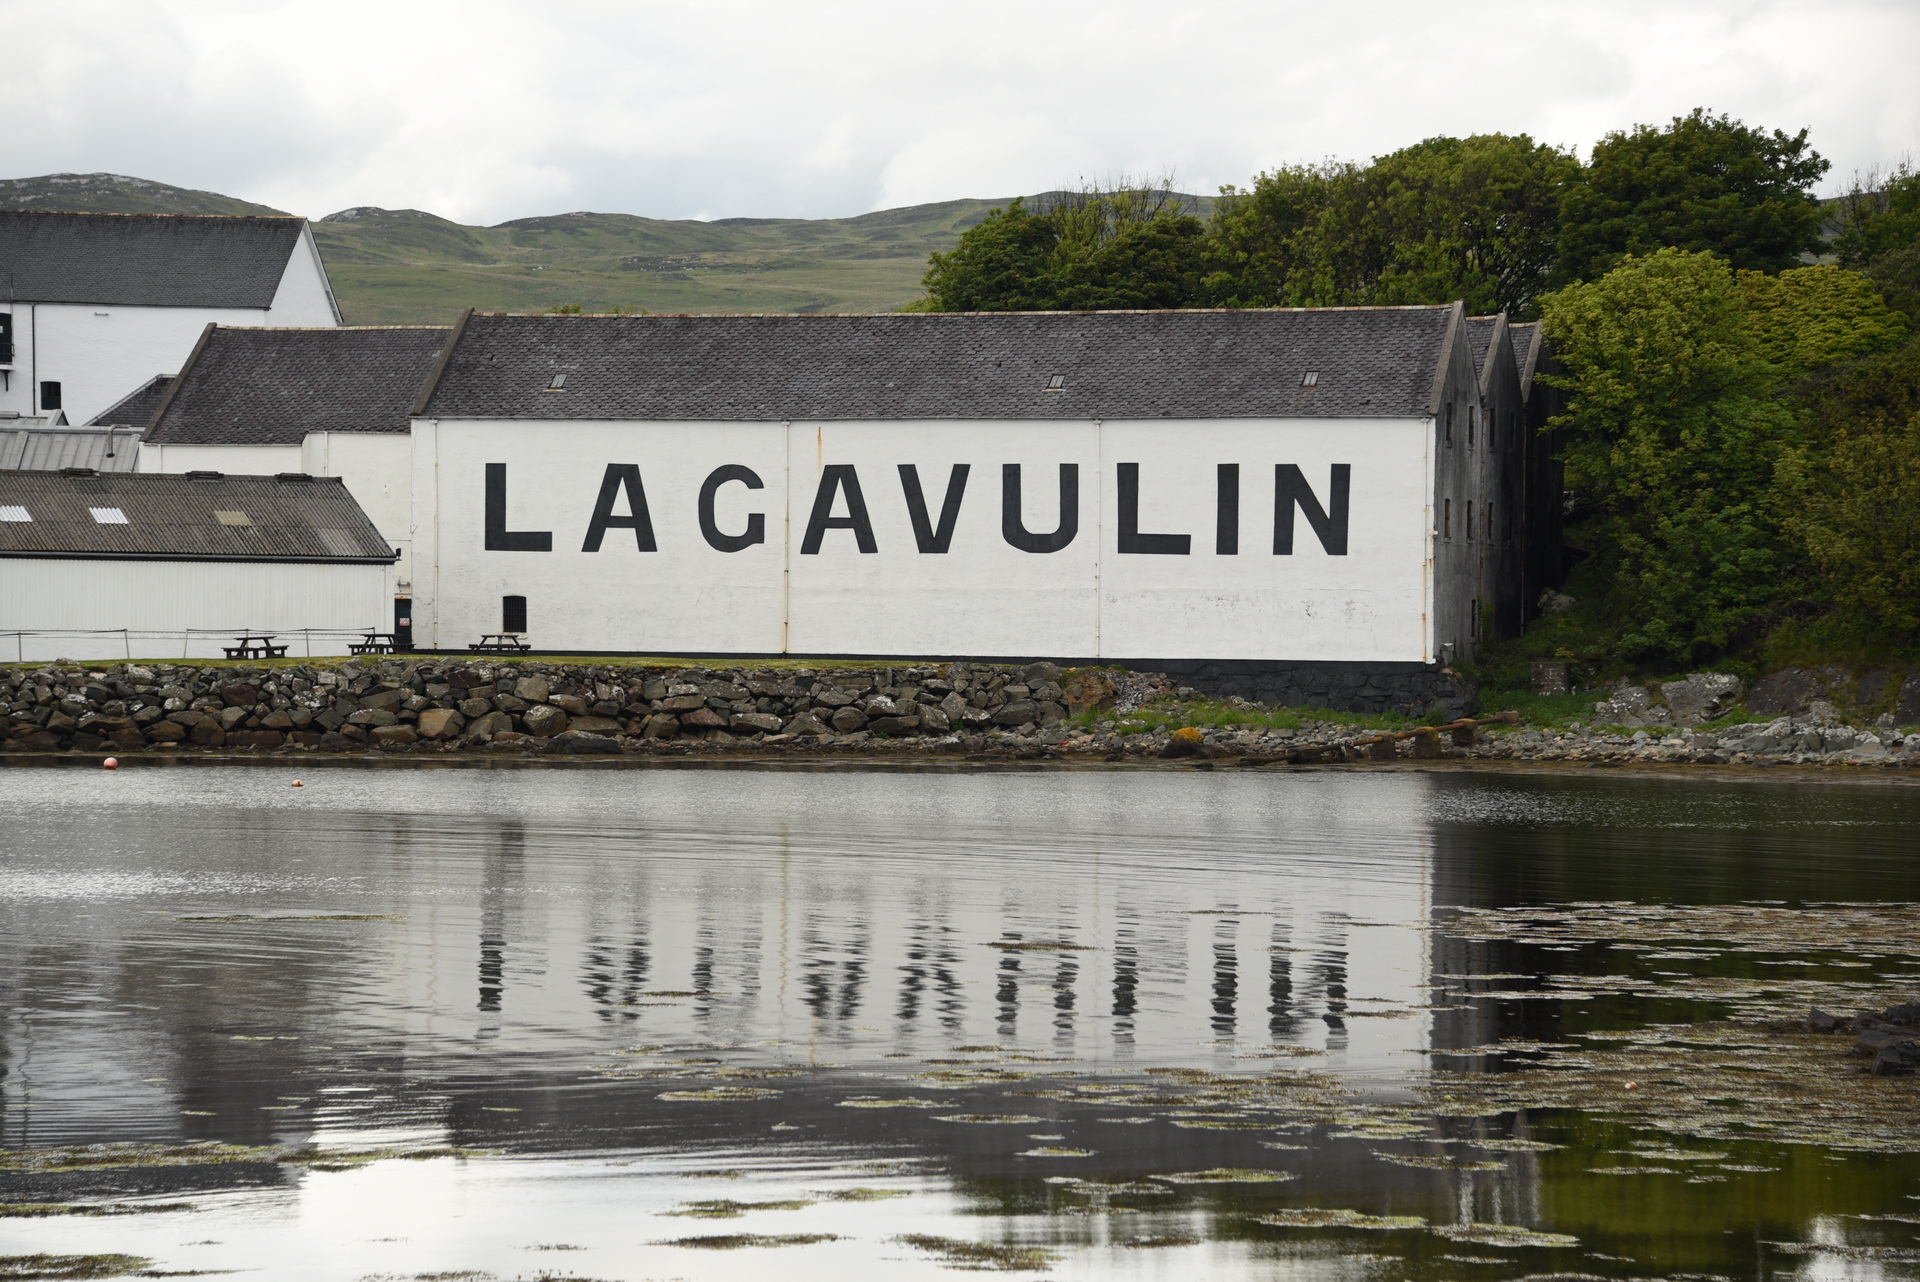
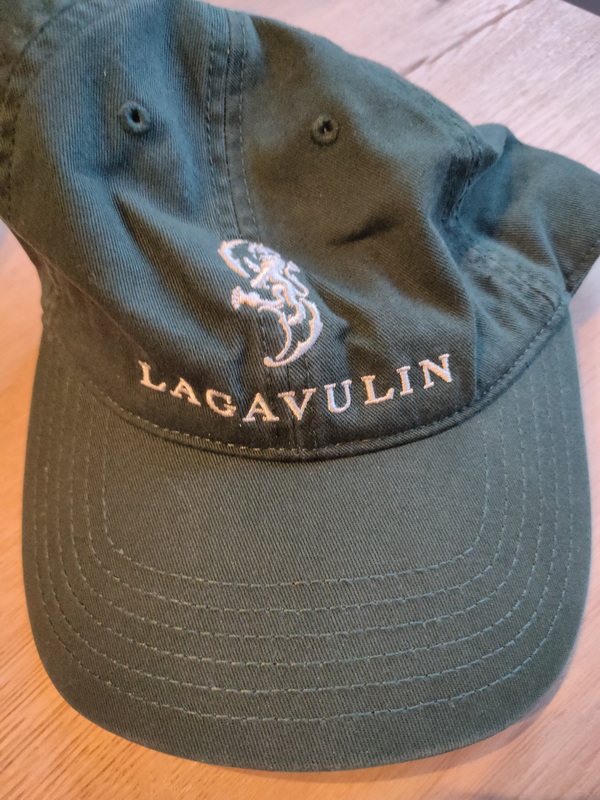
Daarna zijn we weer 1.5km terug gereden naar de Lagavulin destileerderij. Nadat we weer even in de souveniershop hadden rondgekeken (een Lagavulin petje gekocht) meldde we ons voor de rondleiding. Om 15.30 ging de rondleiding van start een heeft Beth ons een uurtje door de distillery heengeleidt. De rondleiding eindigde met een tasting met 3 whisky’s: de 8 jaar, de 16 jaar, en de Festival fles van dit jaar. We waren het er over eens dat we deze laatste wel een beetje scherp in smaak vonden. Coline kon haar 3 tasters meenemen in driver’s flesjes (Zij was deze dag de BOB) . Na de rondleiding zijn we nog even naar de resten van Dunyvaig Castle gelopen. Vanaf hier had je namelijk een mooi uitzicht op de Lagavulin distillery, opnieuw met de naam in grote zwarte letters op de witte muur van het warehouse. We hebben de ruine beklommen, waarbij we een groot gat moesten overbruggen.
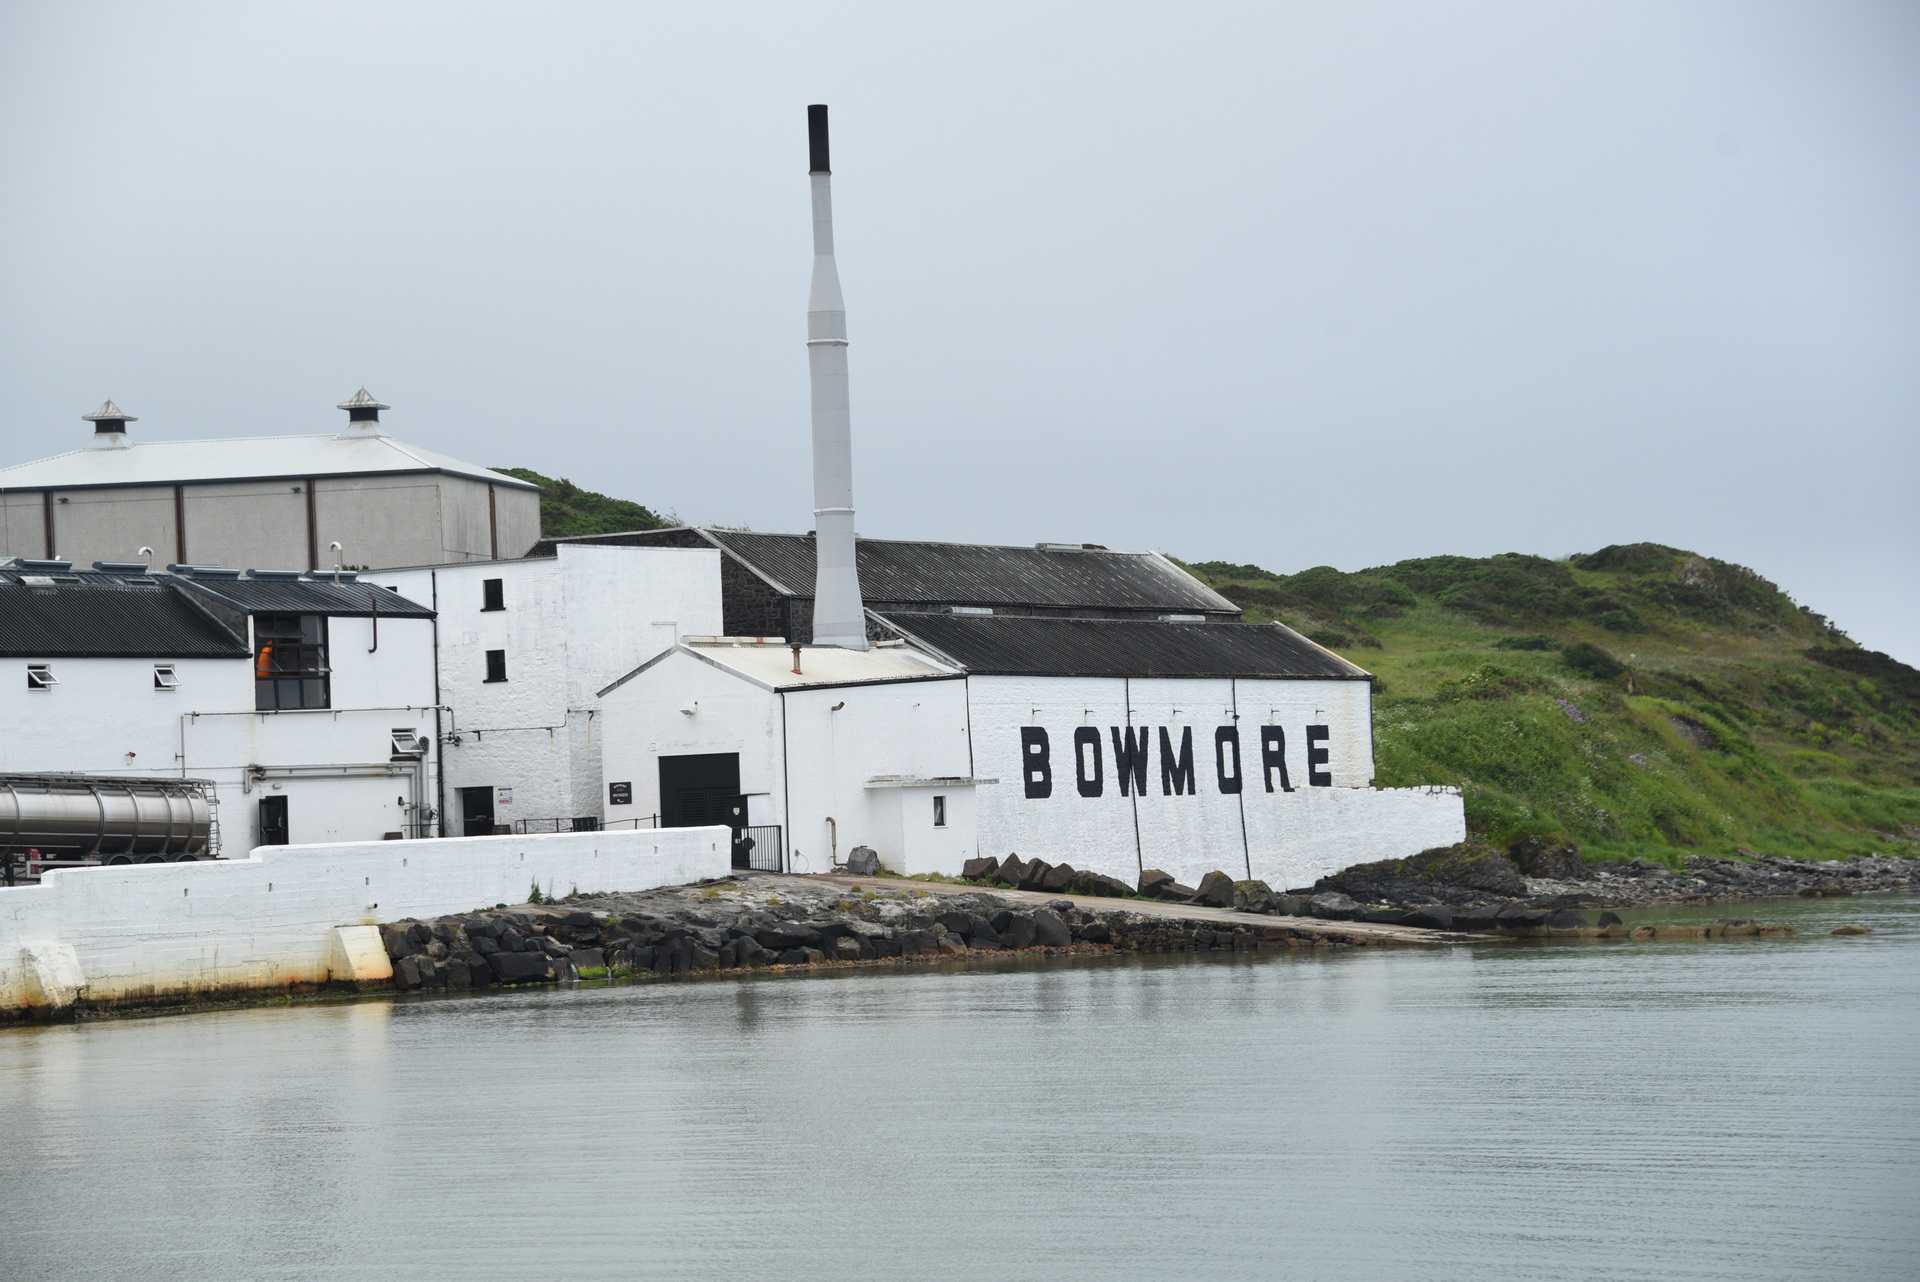
Savonds nog even fotos gemaakt van de Bowmore destileerderij.
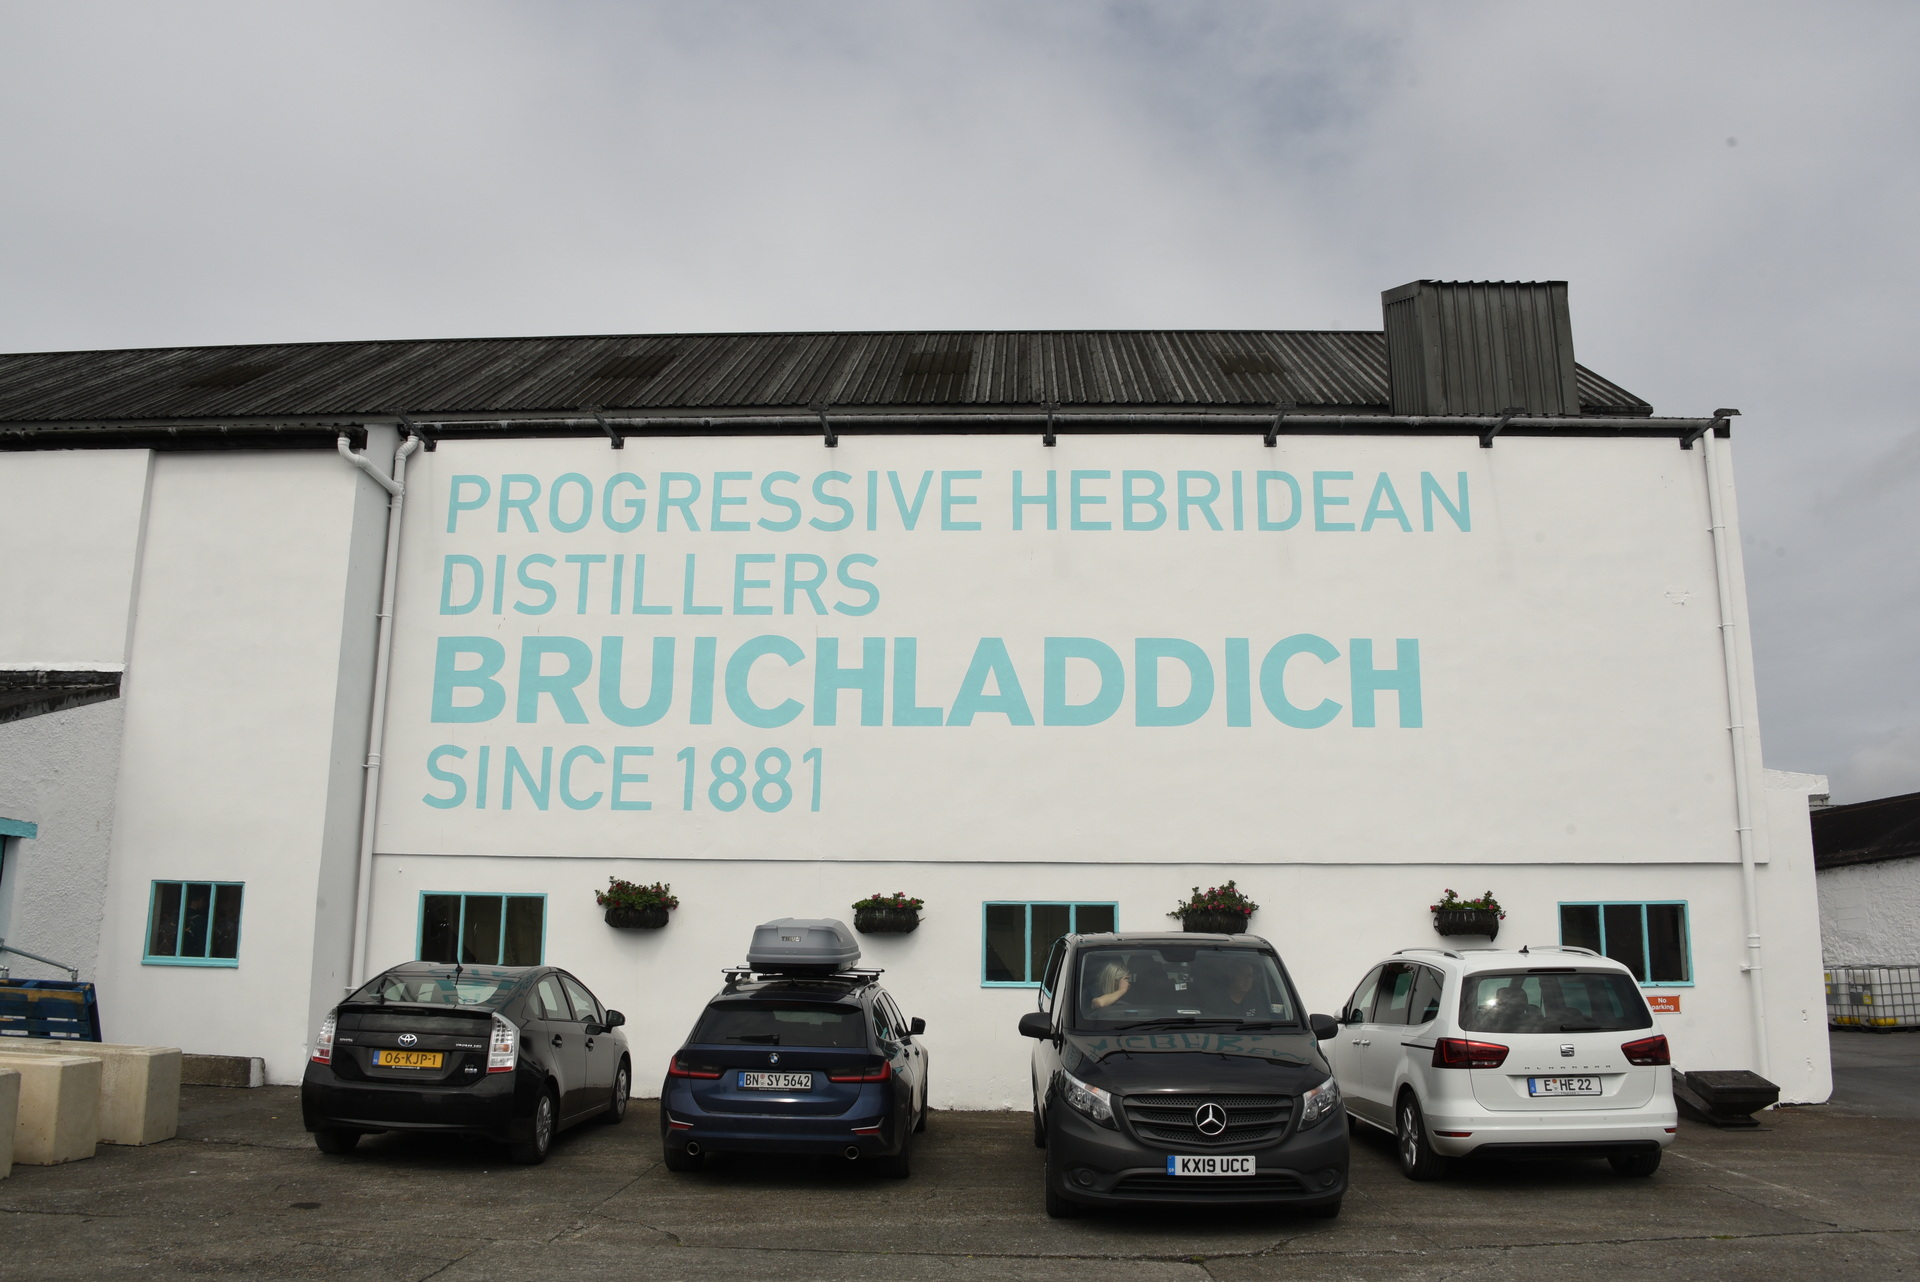
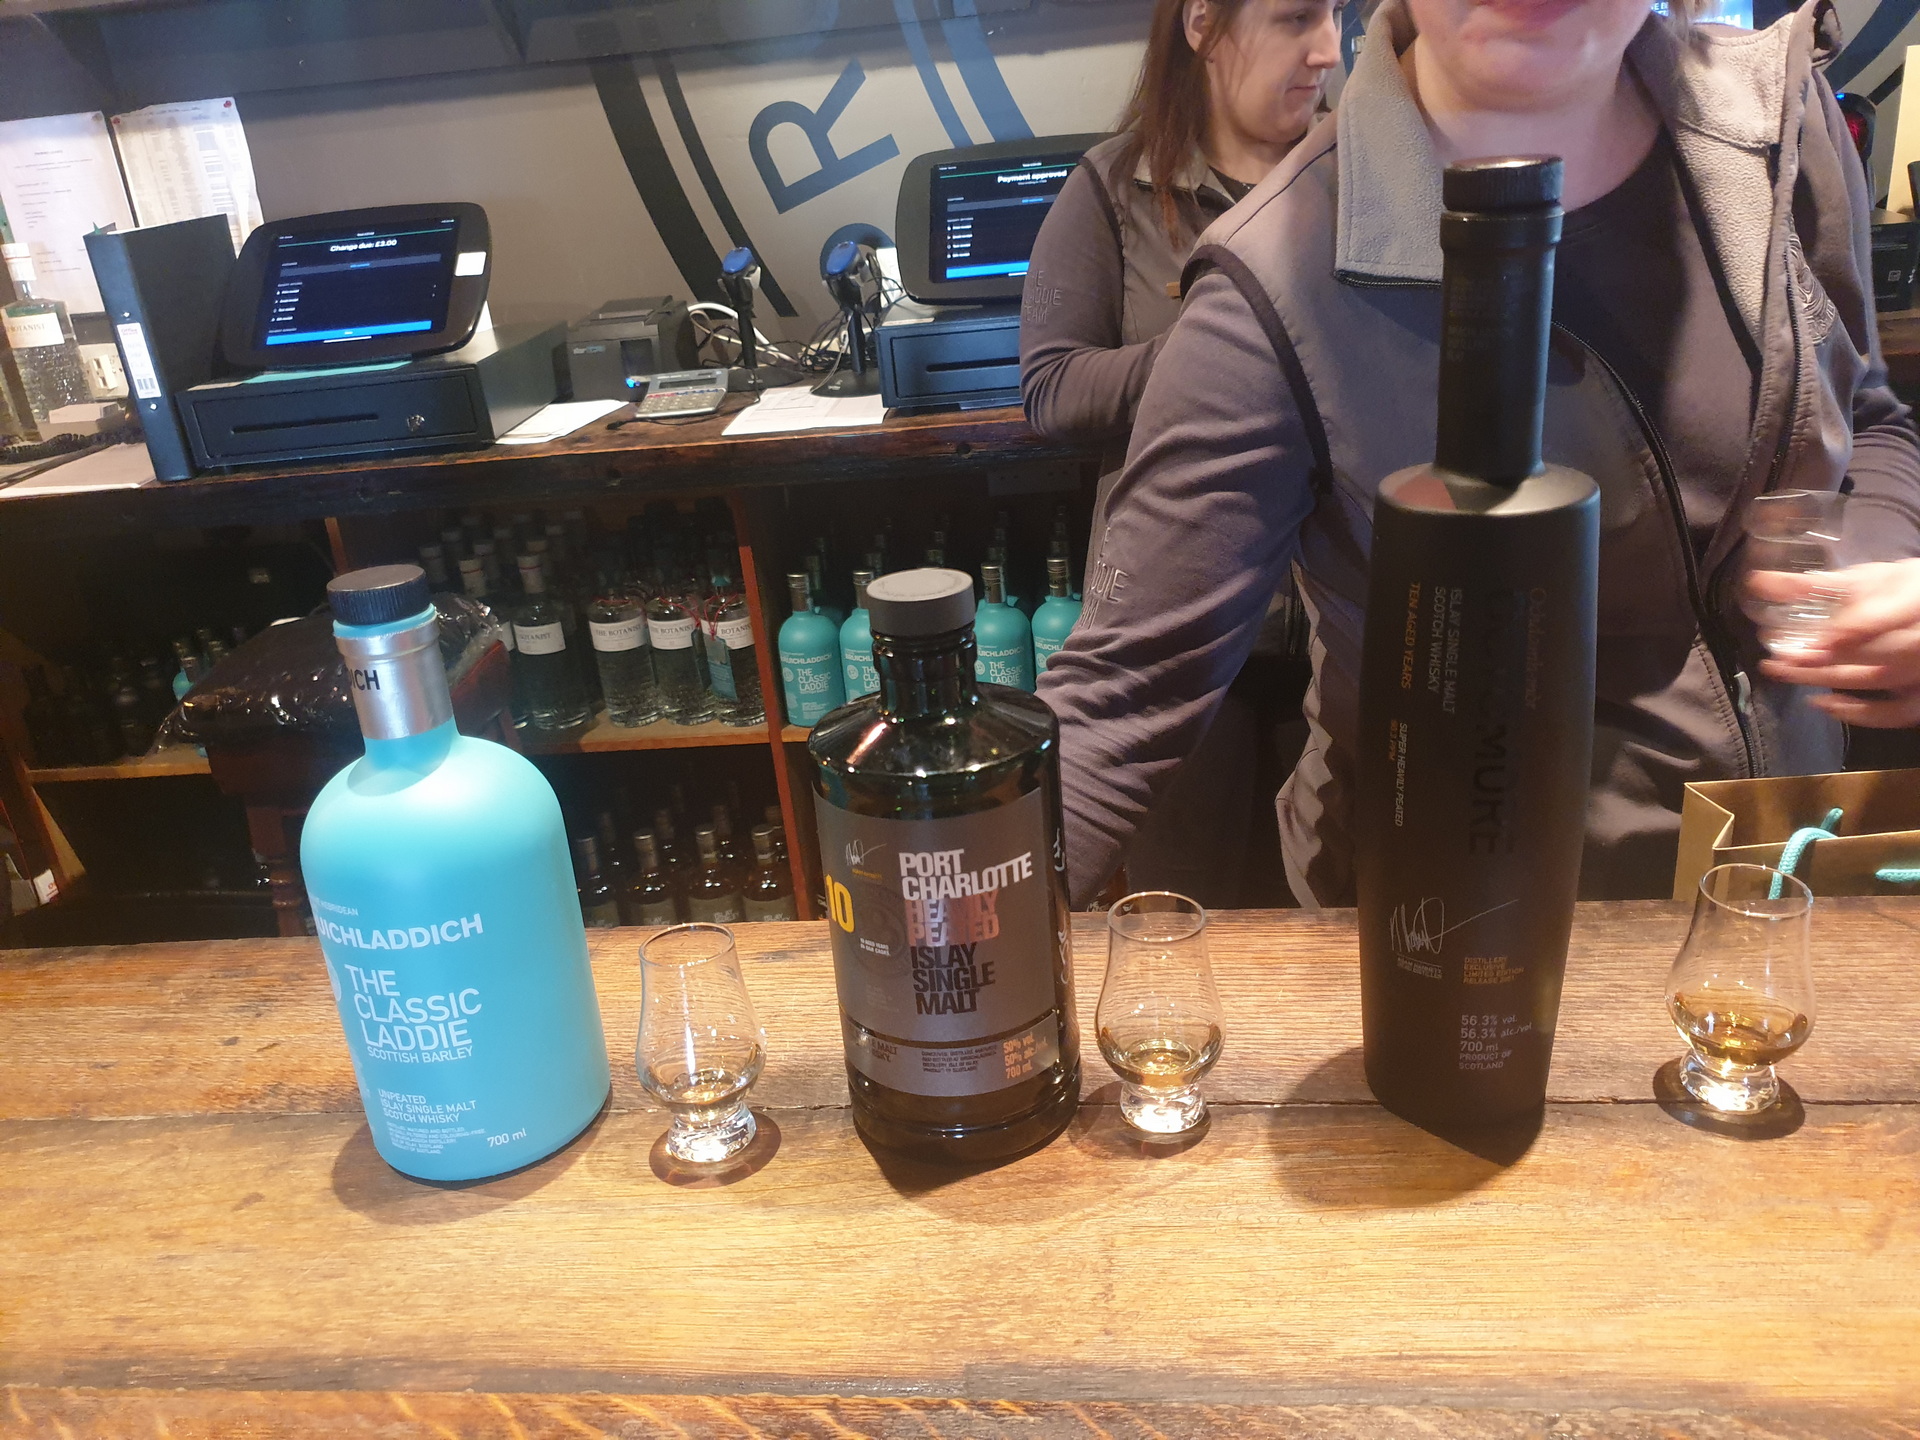
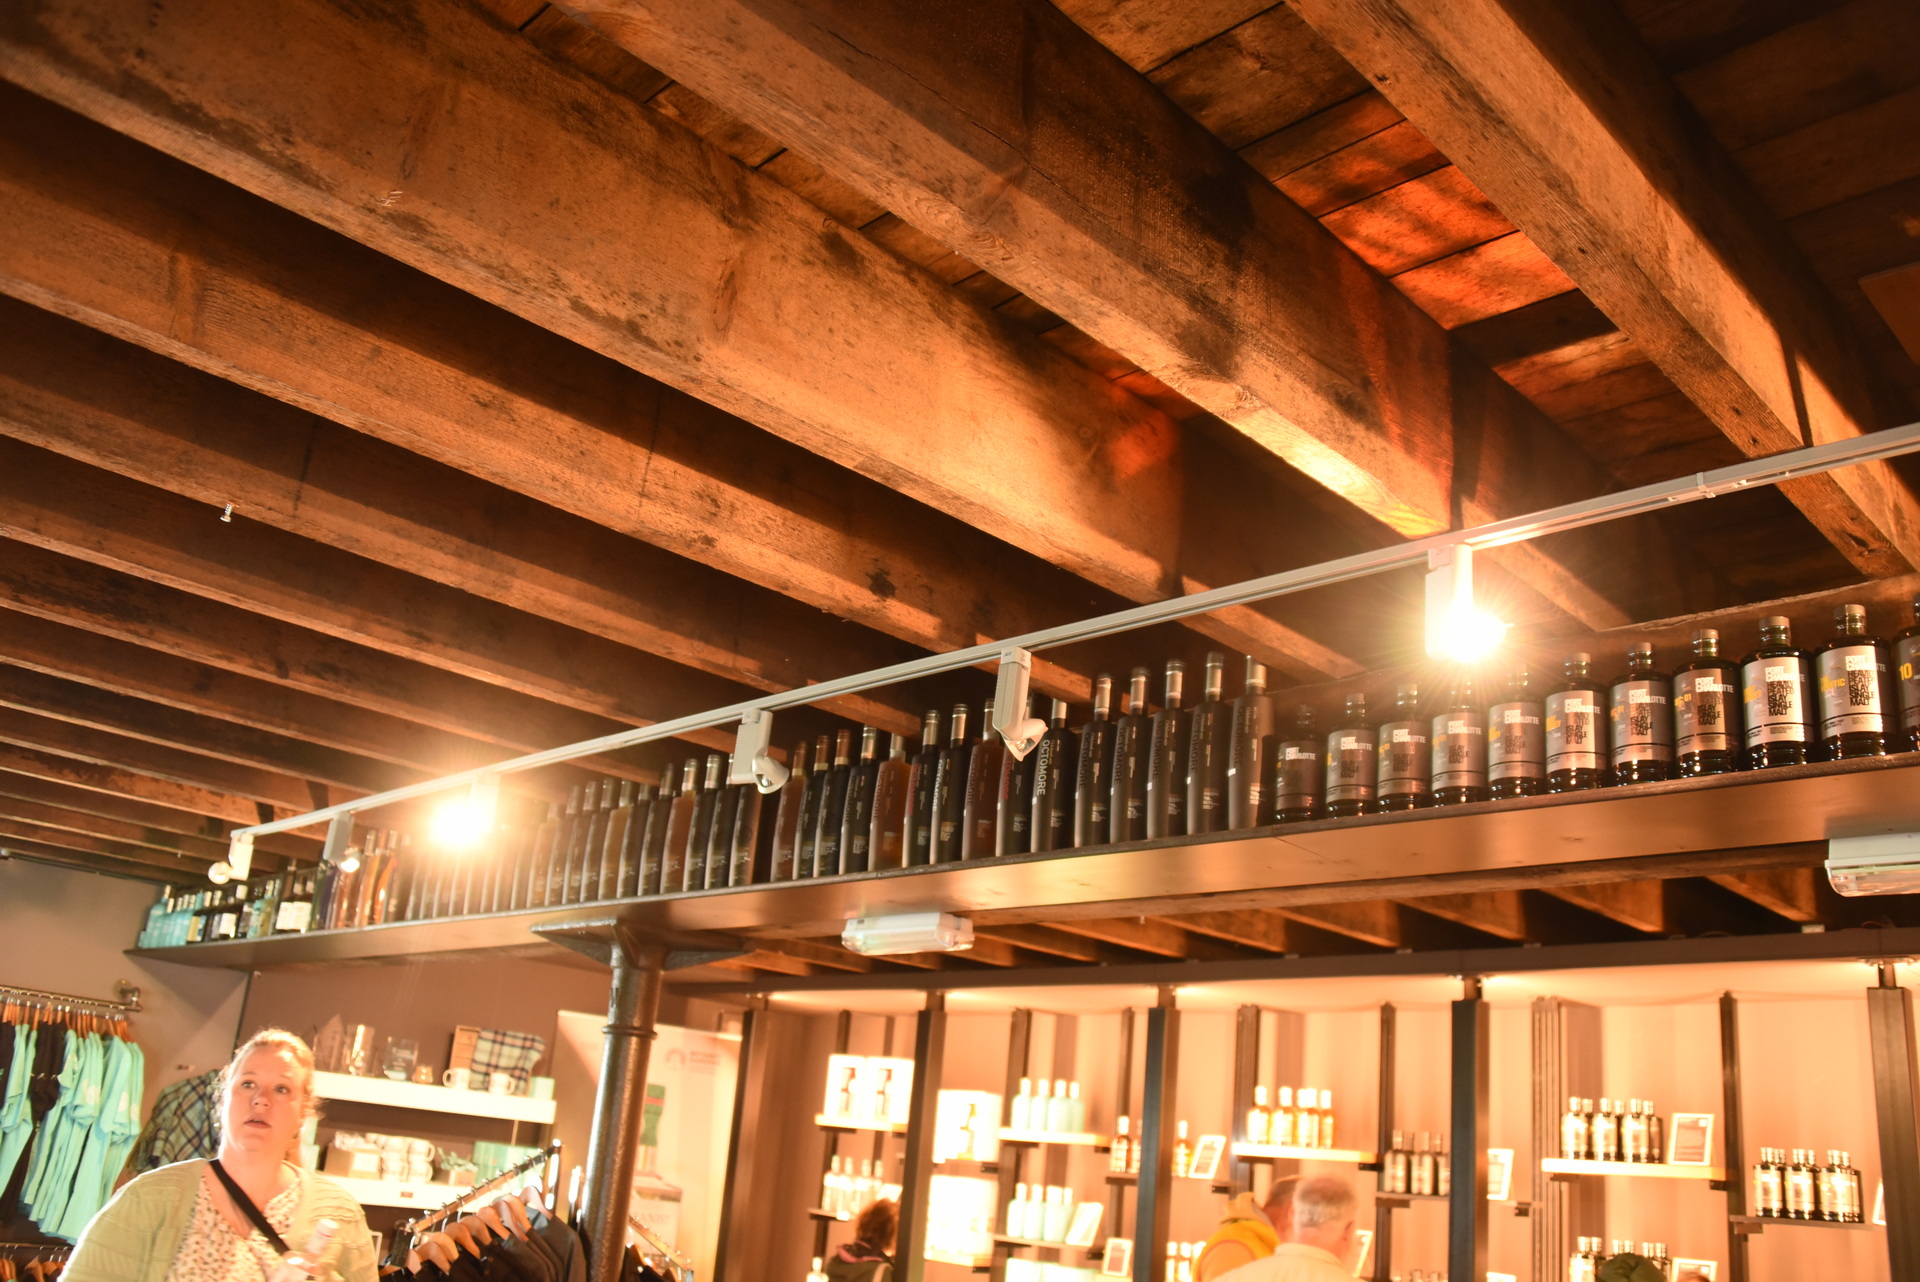
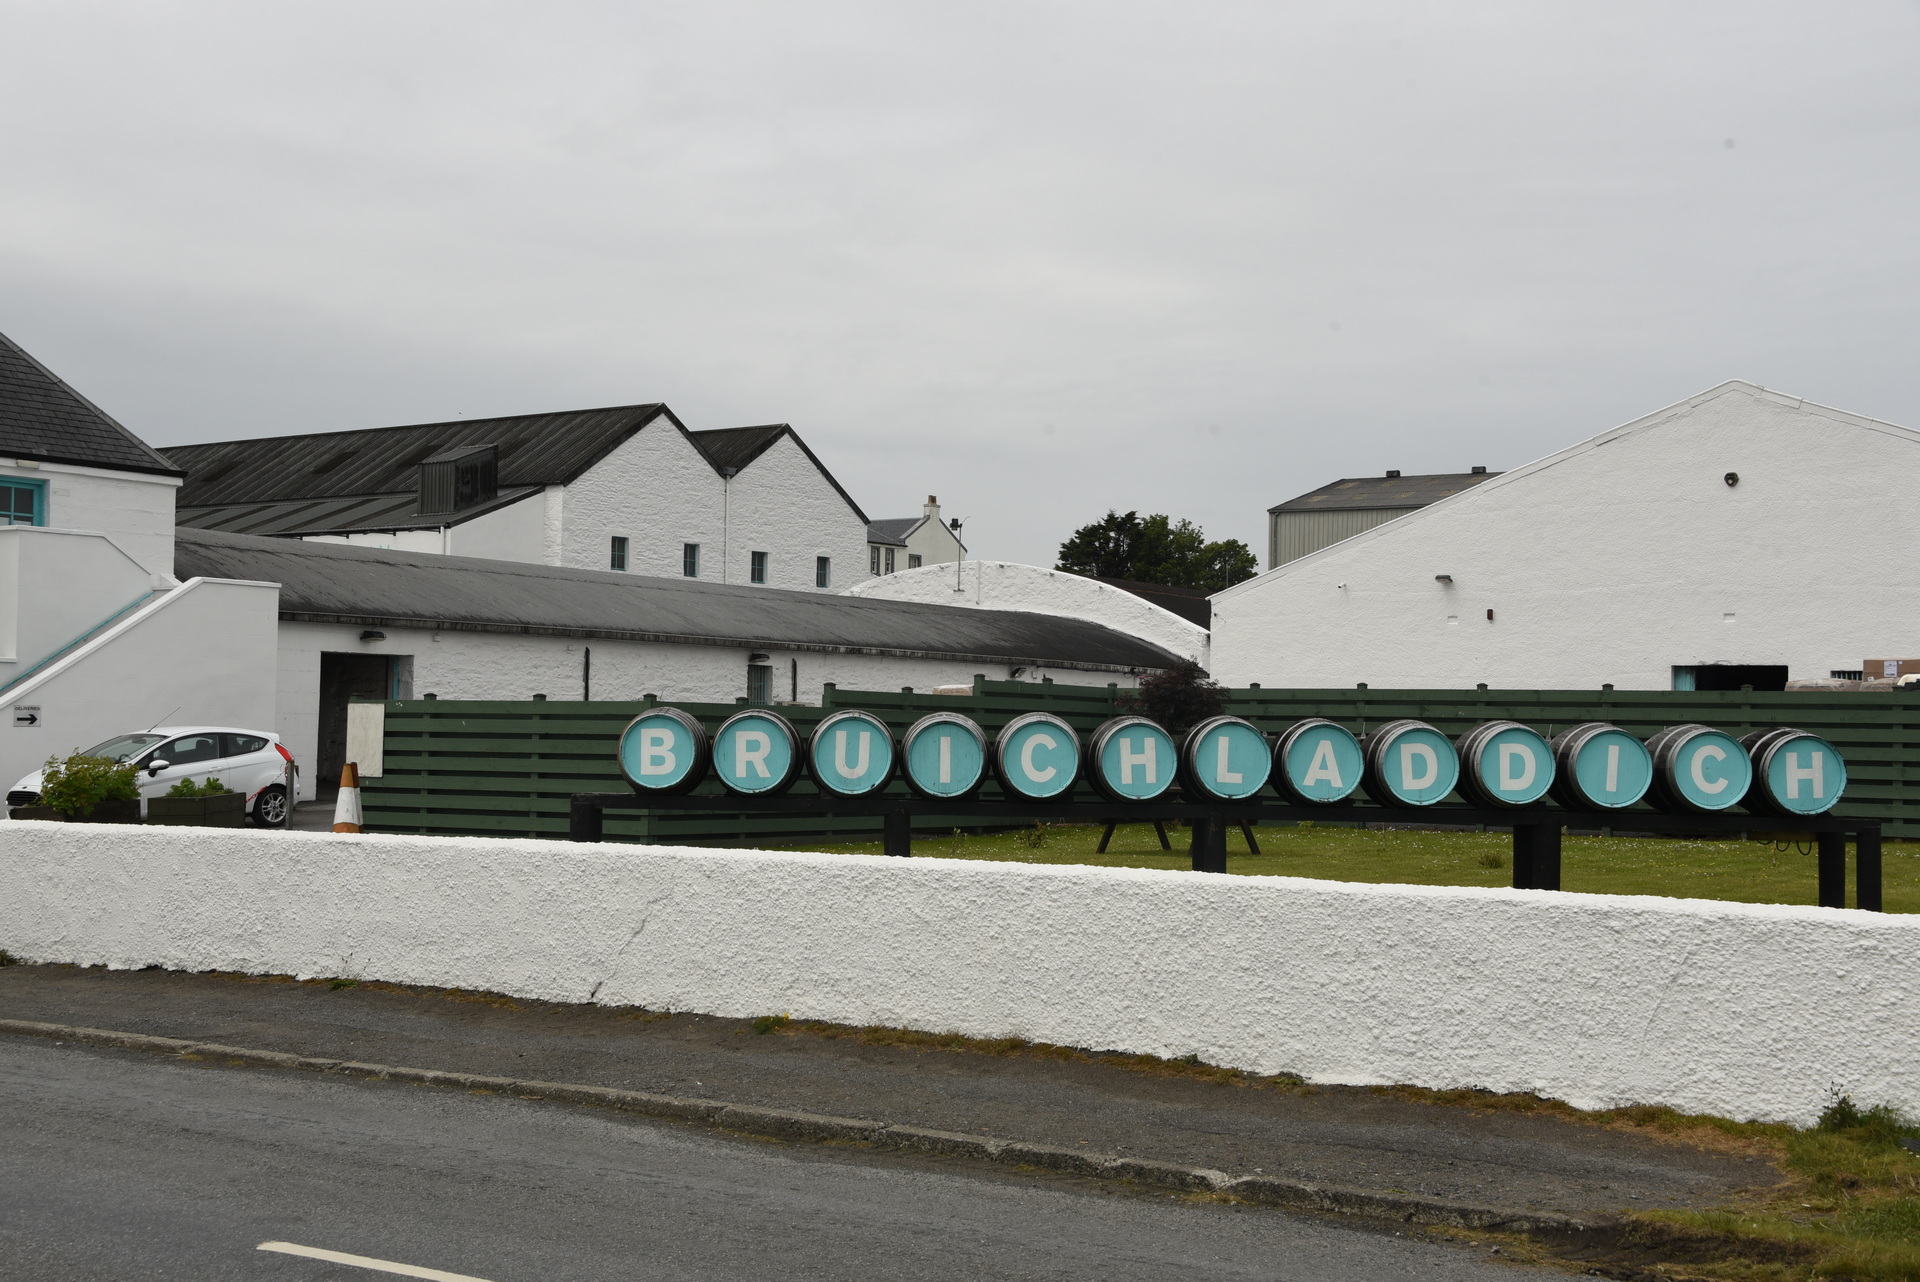
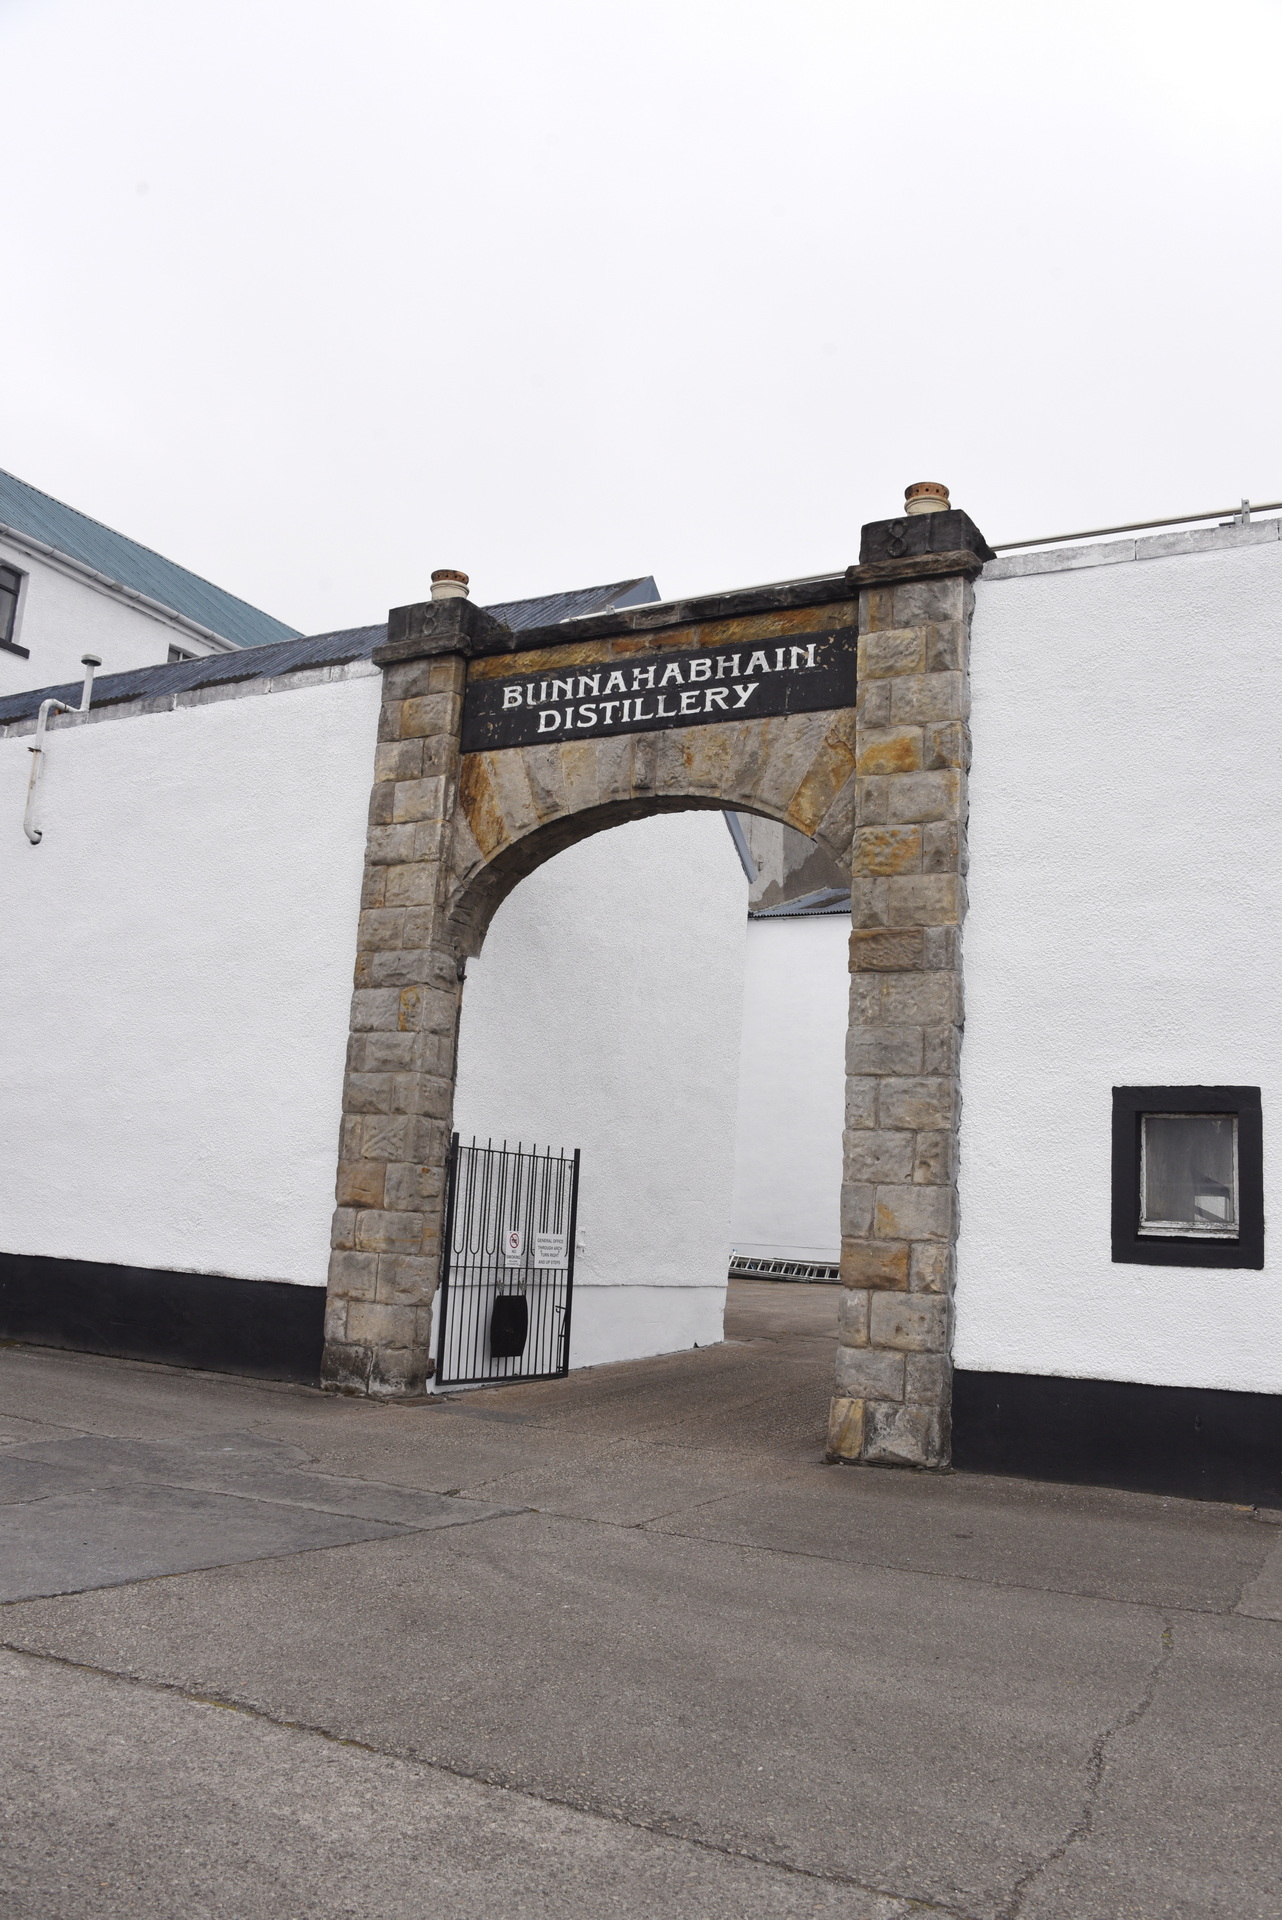
9 Juni – Bruichladdich, Kilchoman, Ardnahoe, Bunnahabhain distillers (Isle of Islay)
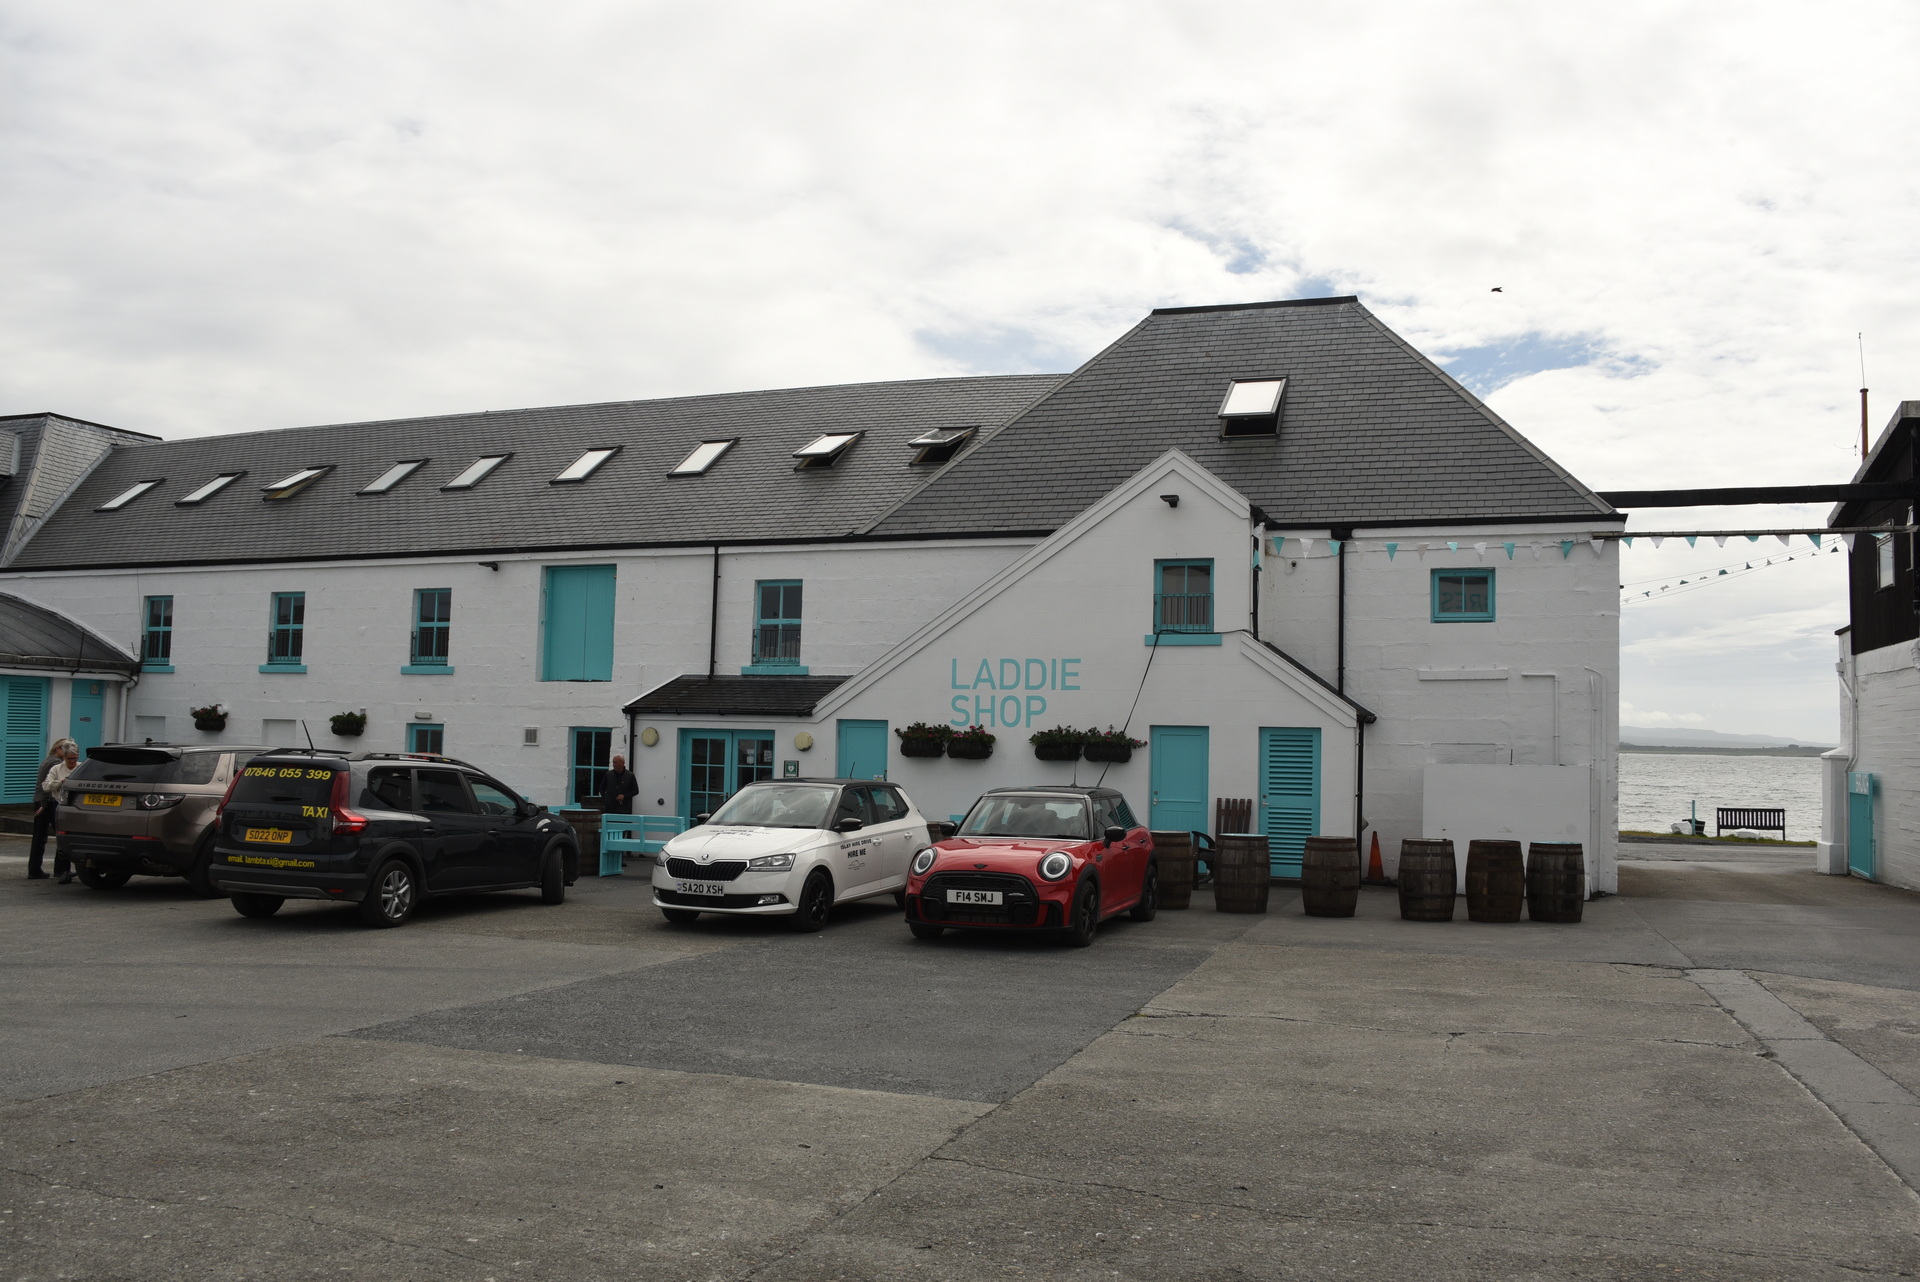
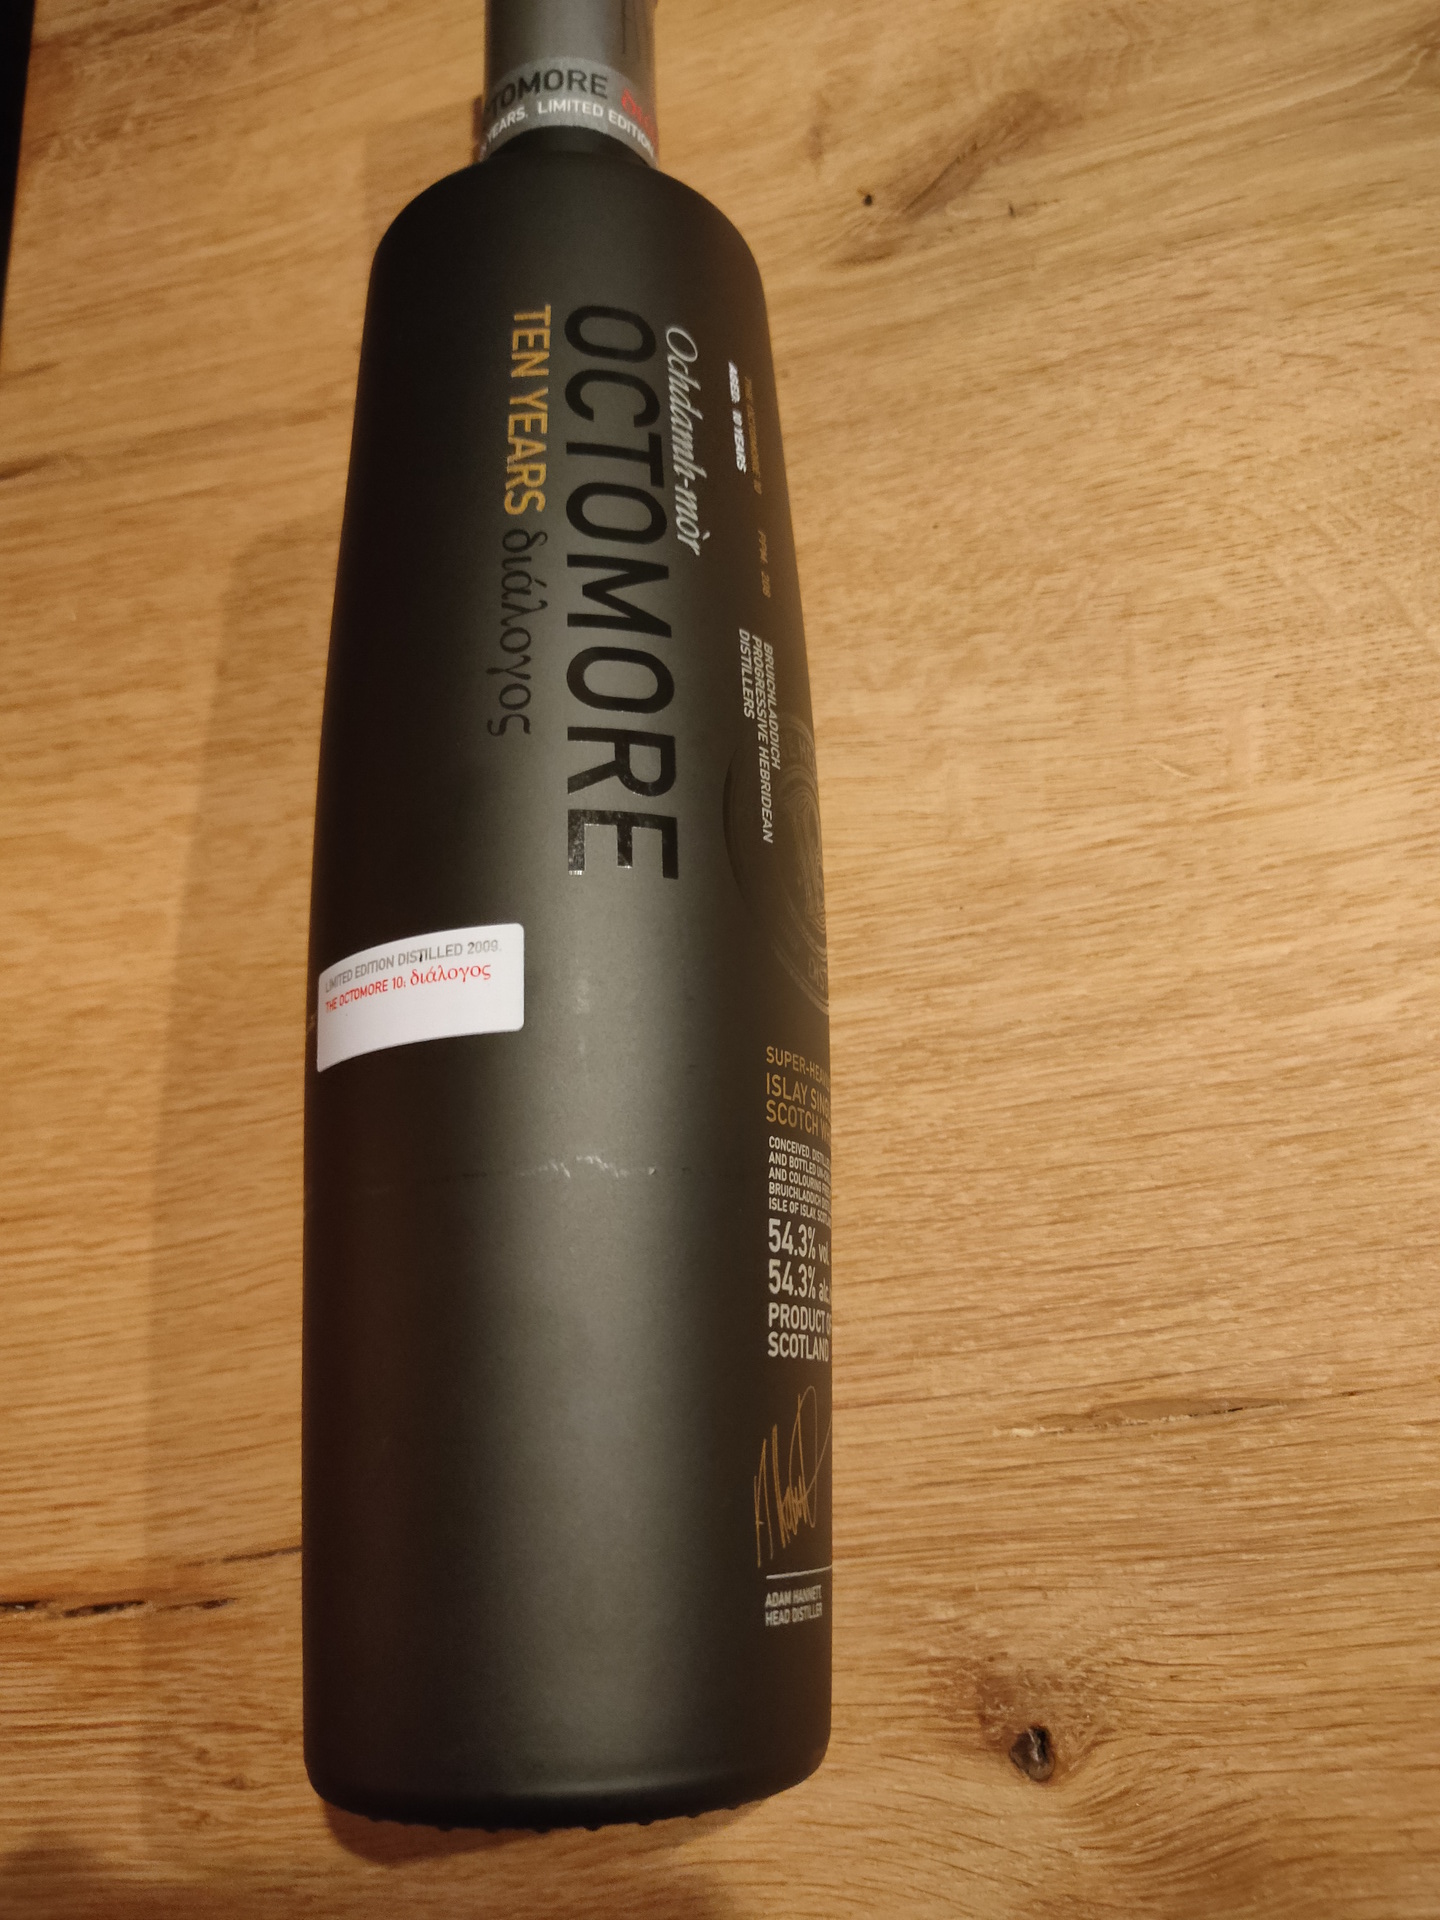
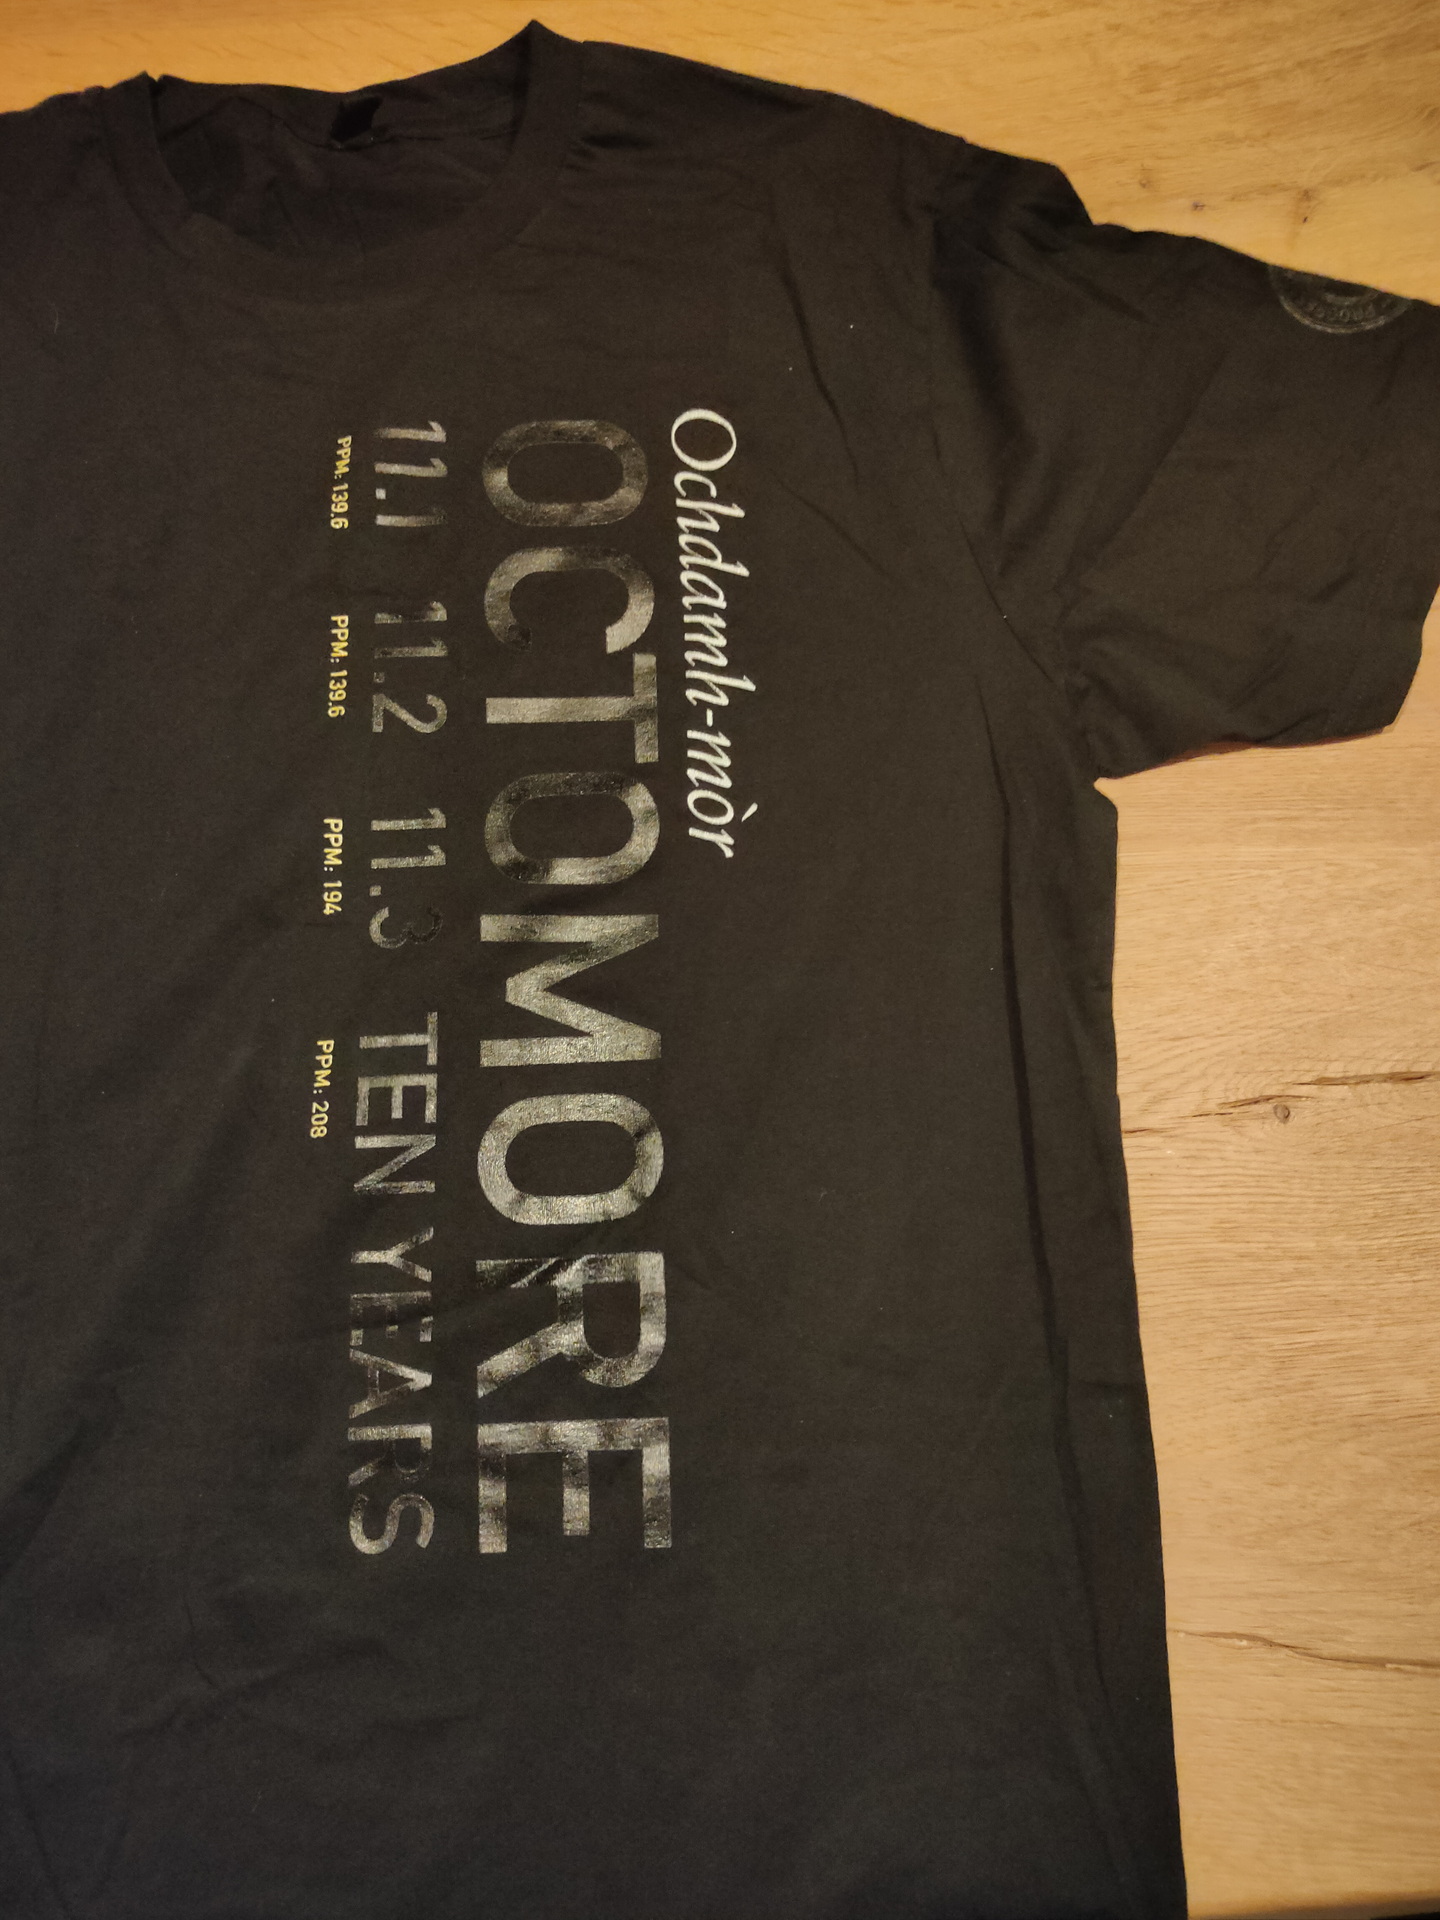
Rond 11en zijn we vervolgens naar de Bruichladdich distillery gereden. Hier hebben we een bezoekje gebracht aan de shop. We hebben een kleine (gratis) tasting gedaan met 3 whisky’s: de bruchladdie, de 10 year Port Charlotte, en de Octomore 5th edition. Het meisje achter de sampling bar was erg enthousiast en vertelde veel. Later hebben we ook nog de botanist gin geproefd. we hebben een fles octomore (208ppm), een flesje Octomore-BBQ saus, een fles botanist gin, en een T-shirt gekocht.
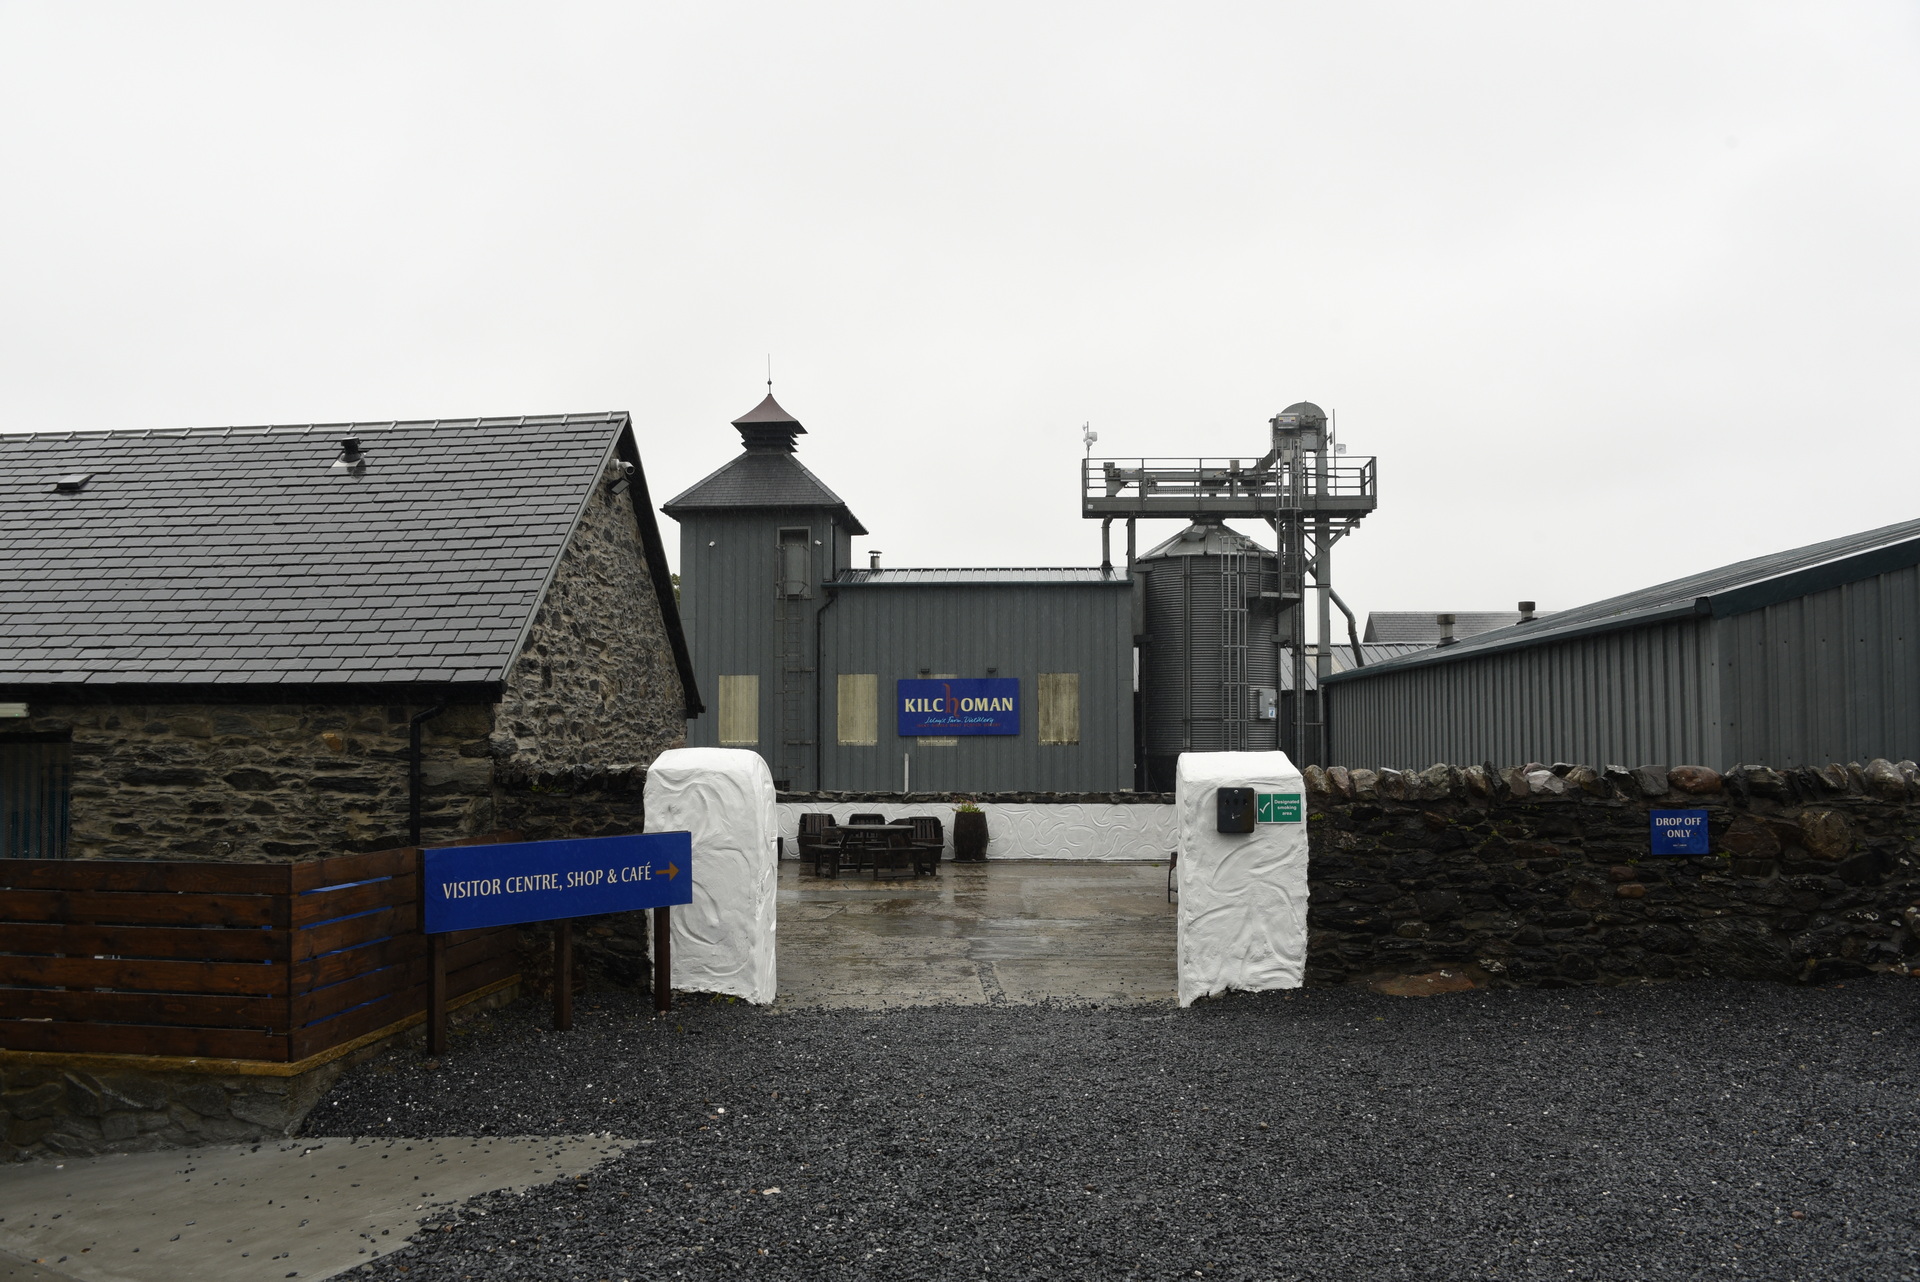
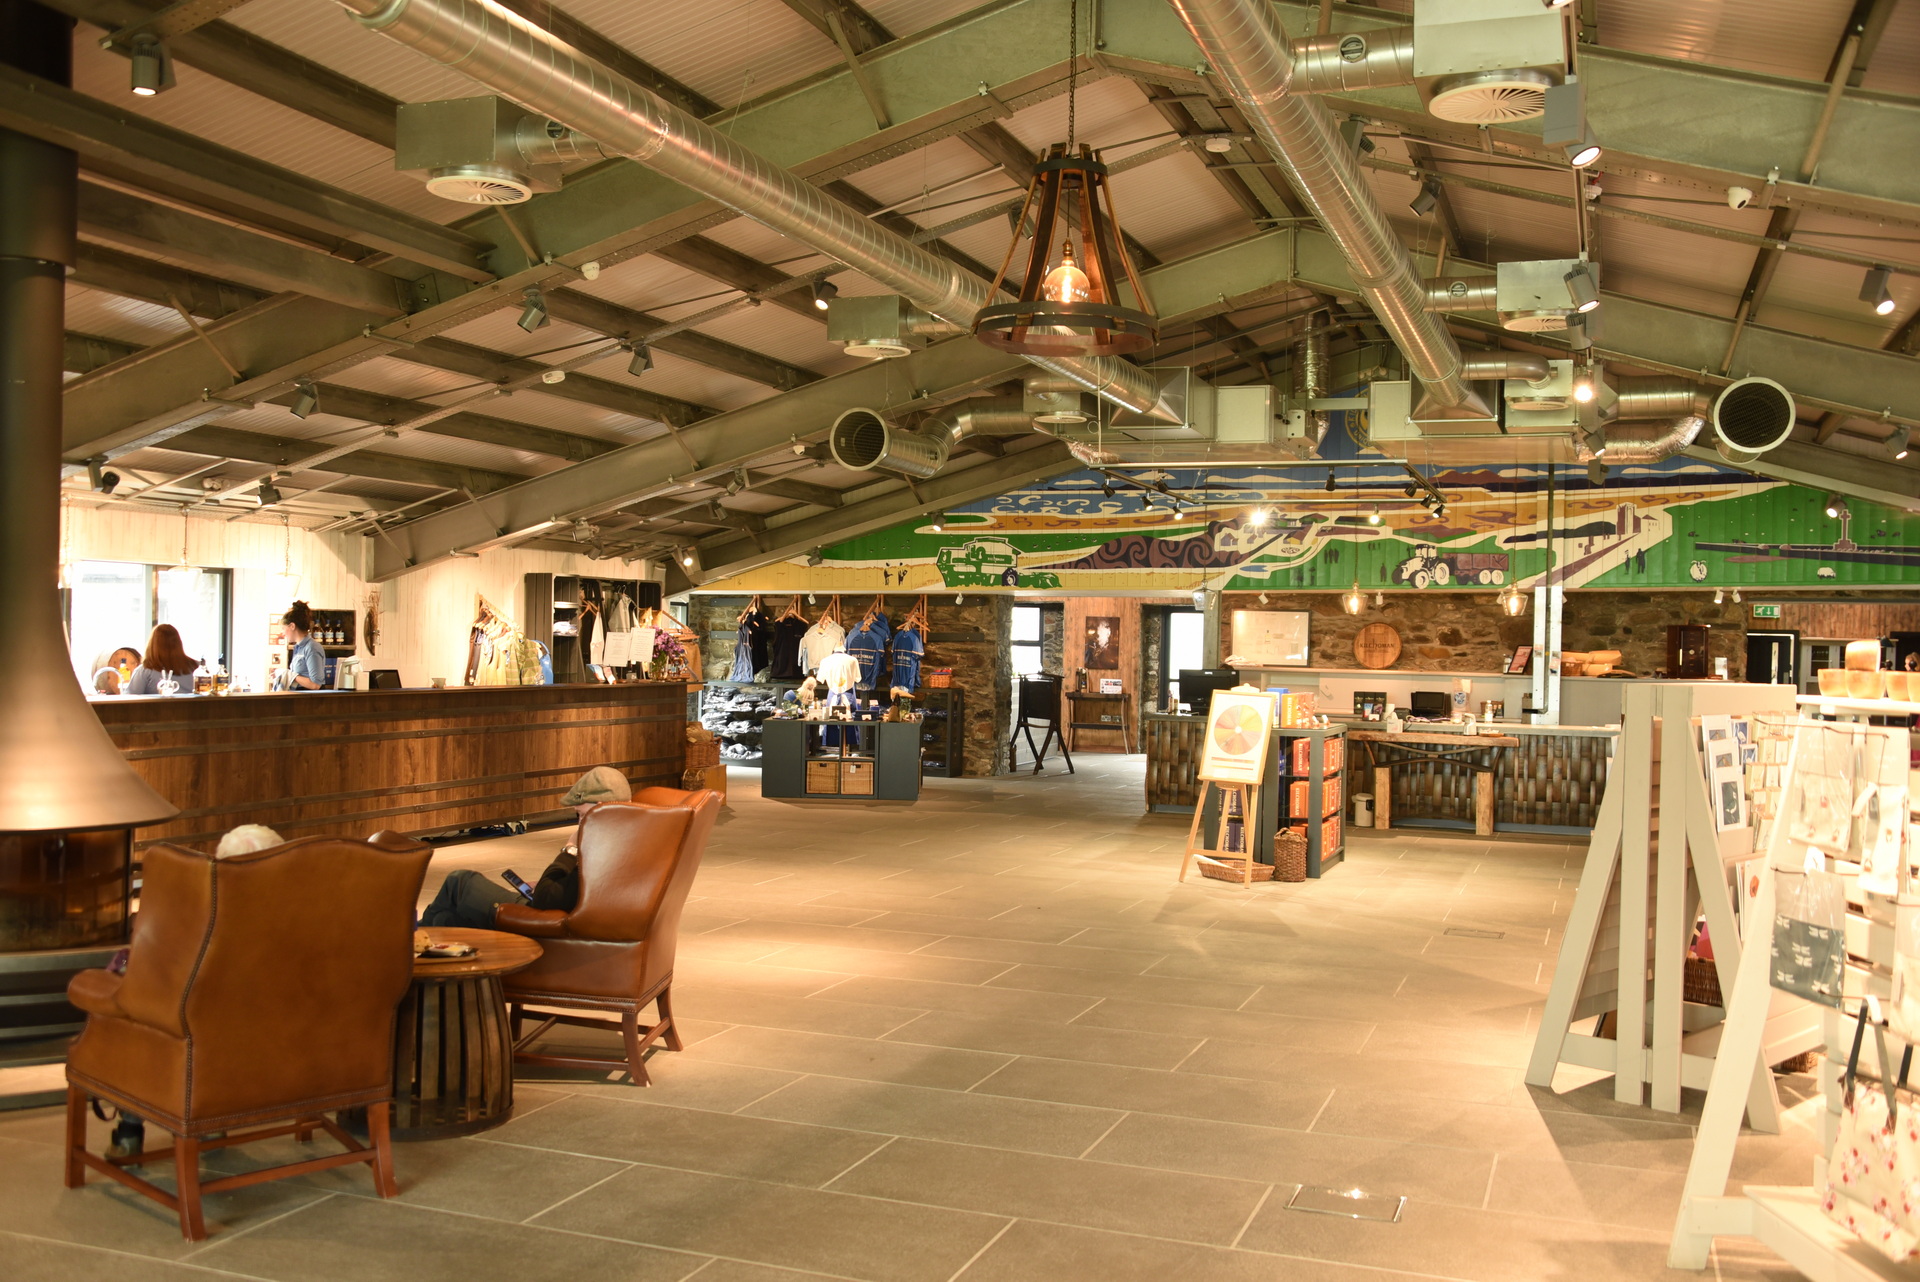
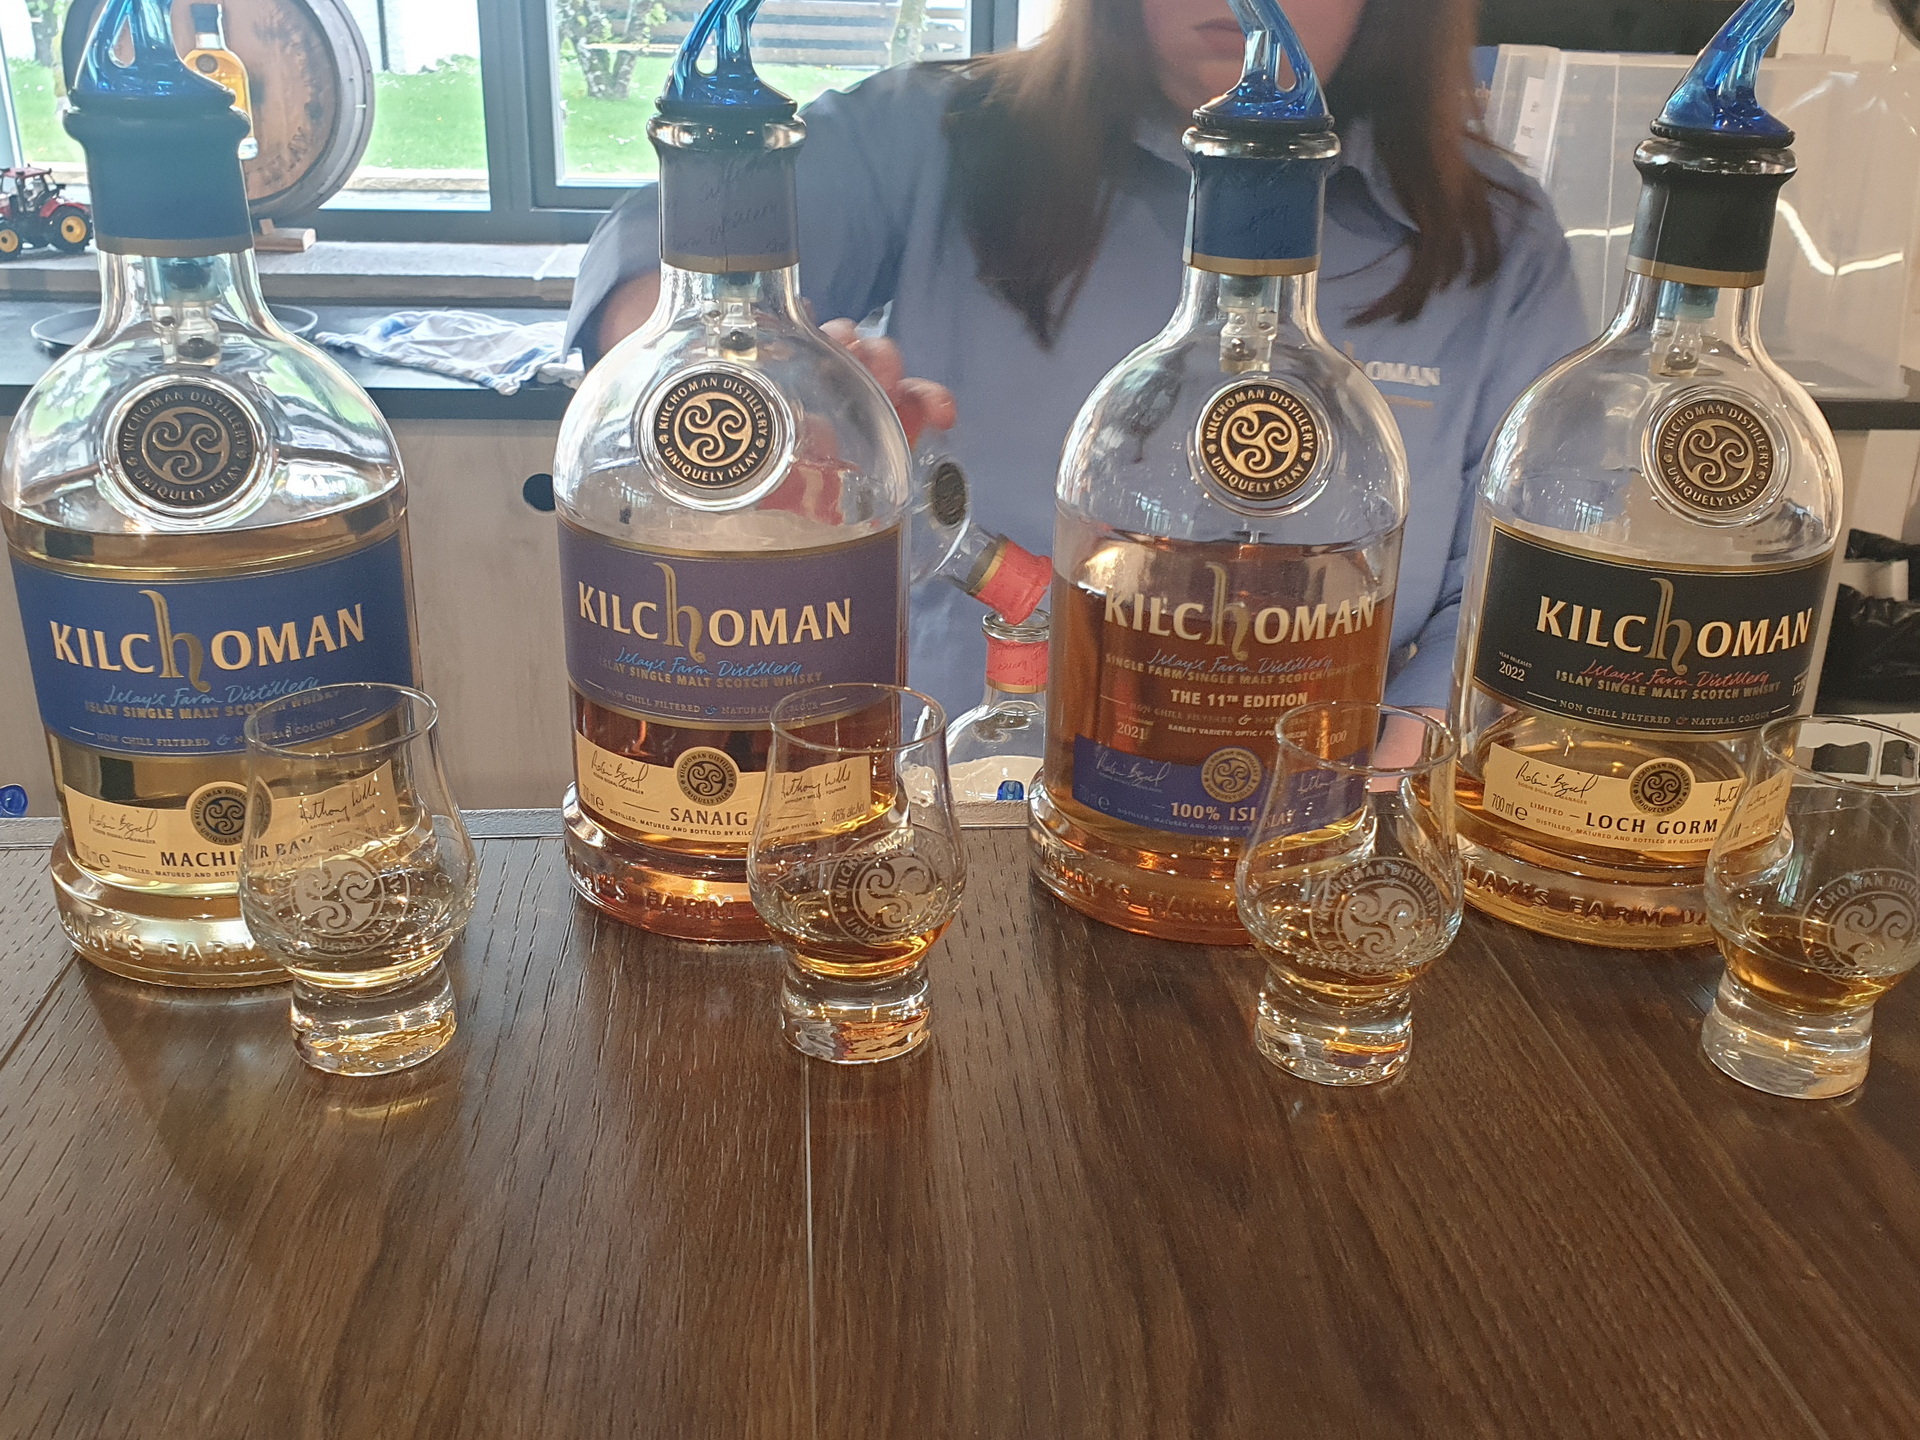
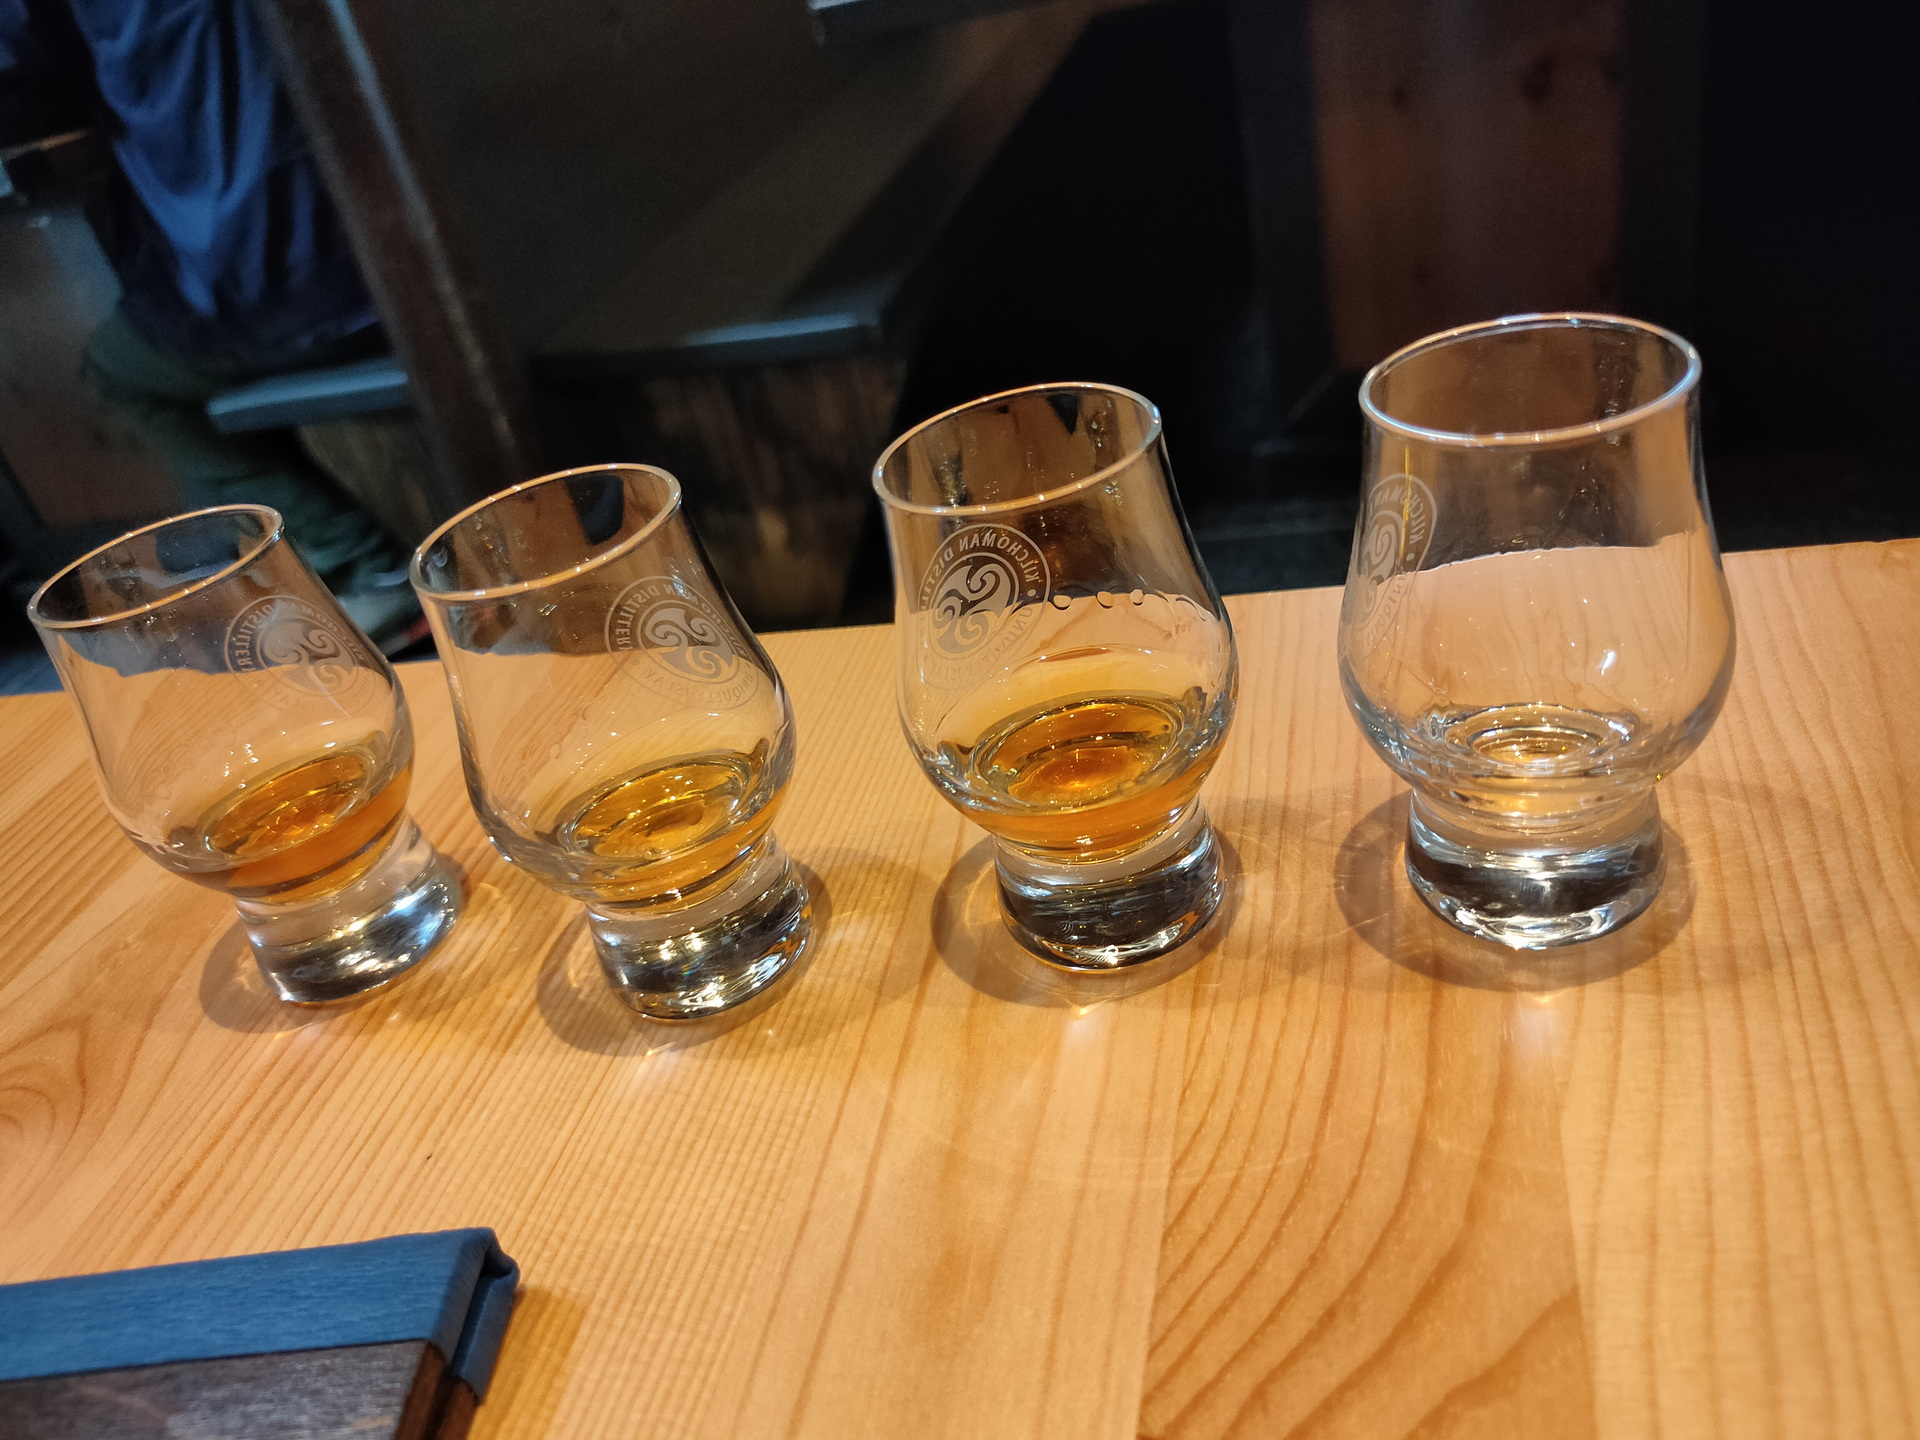
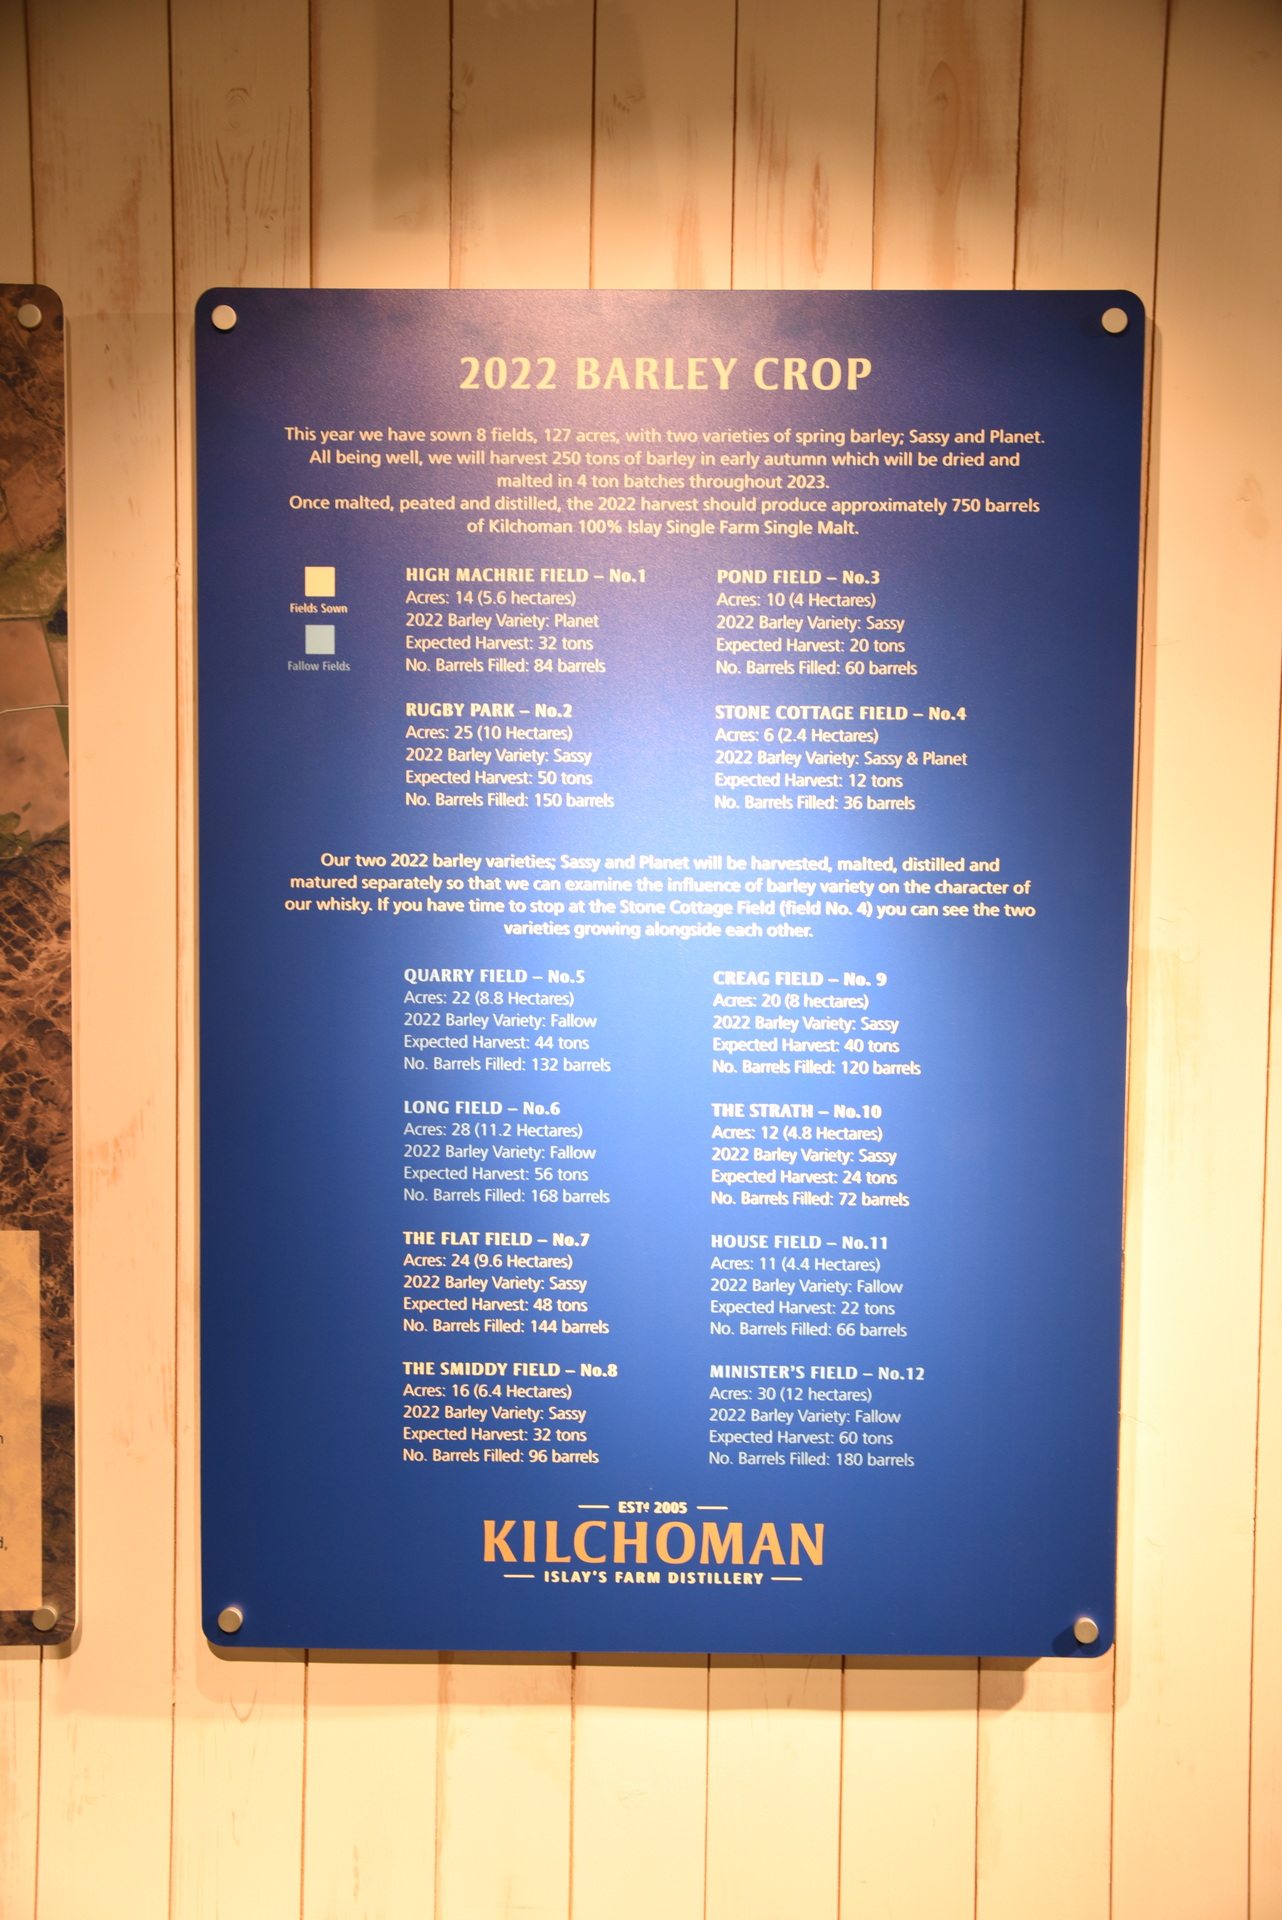
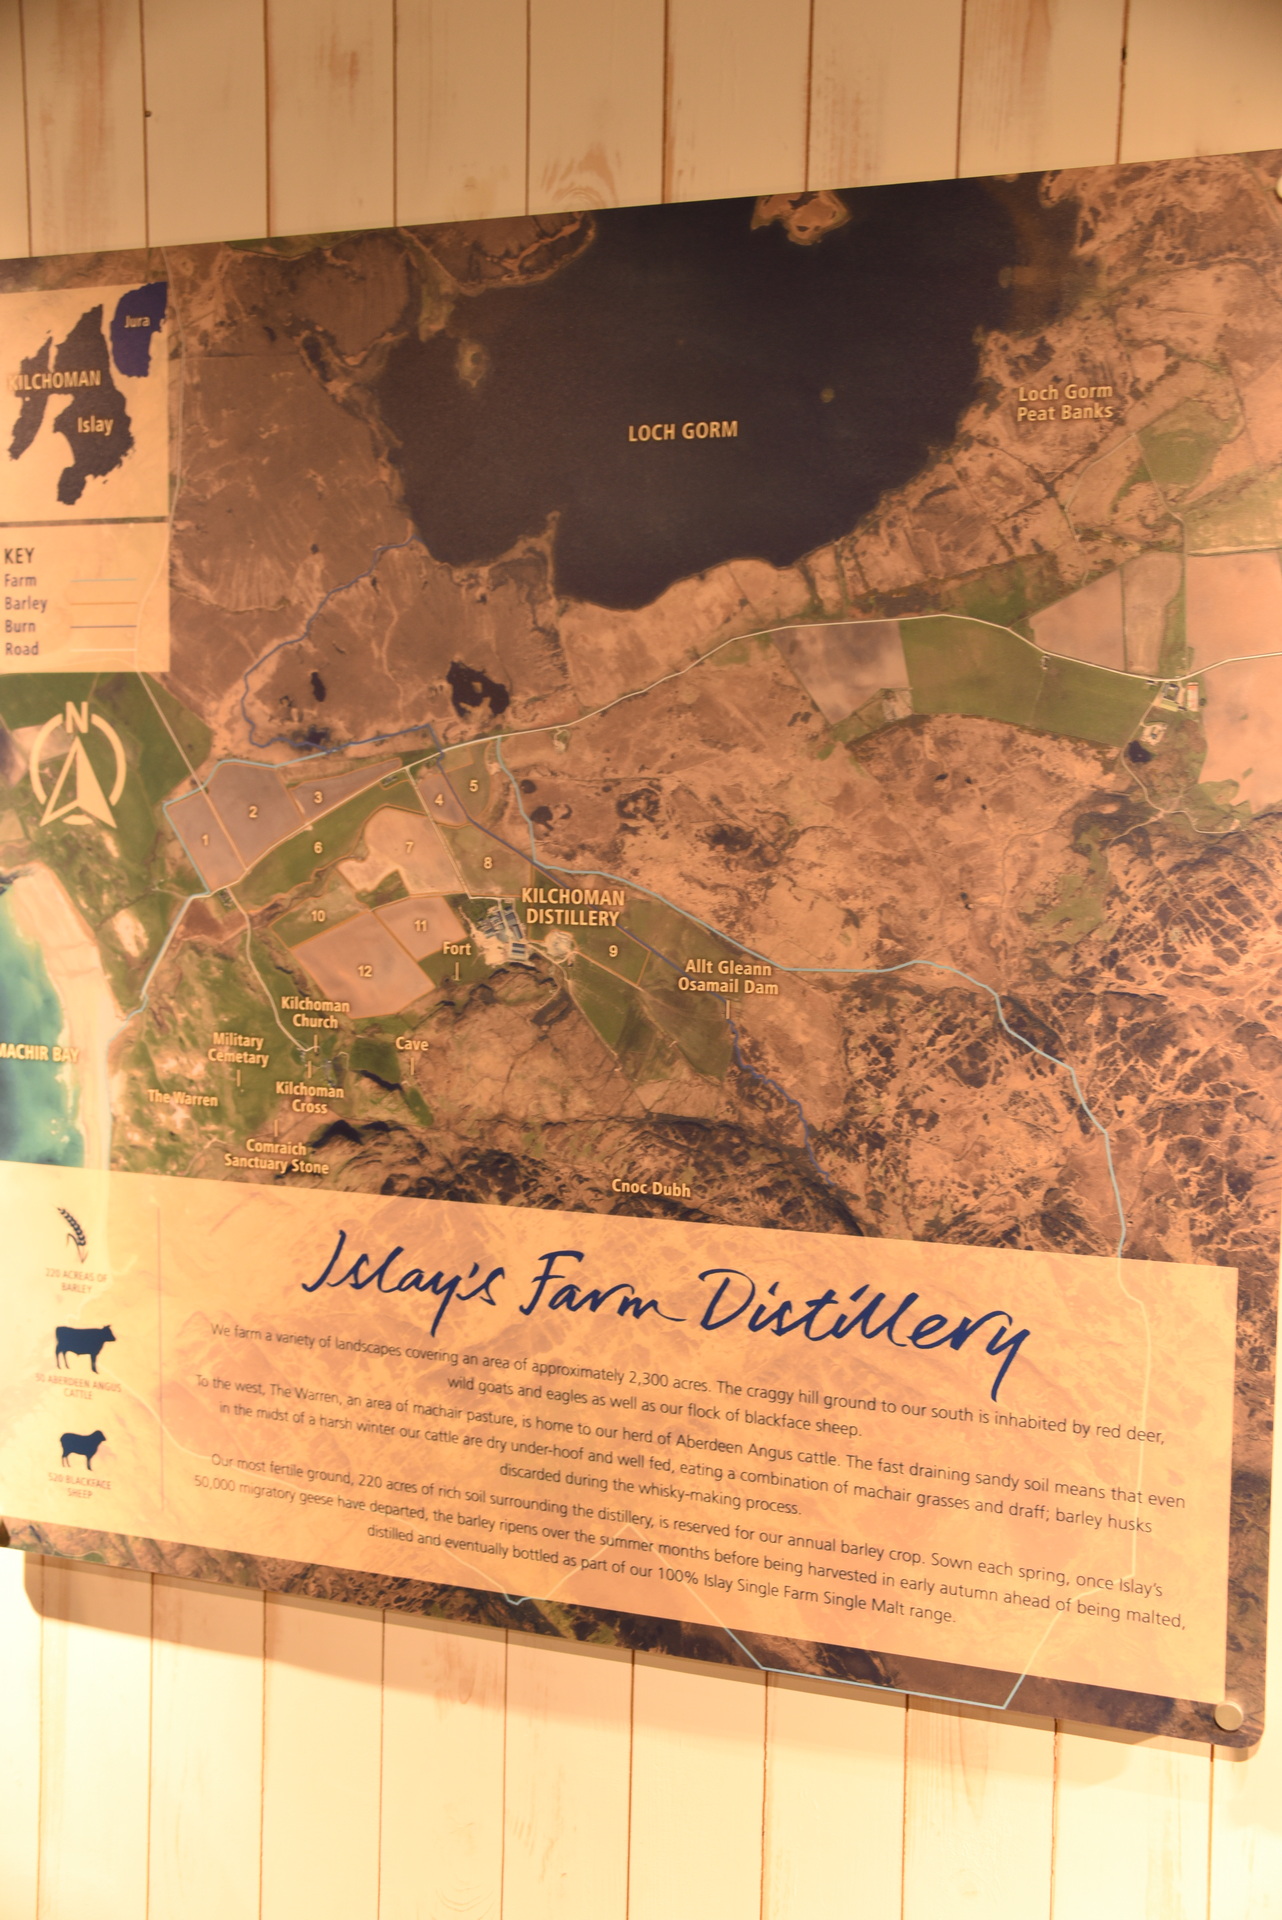
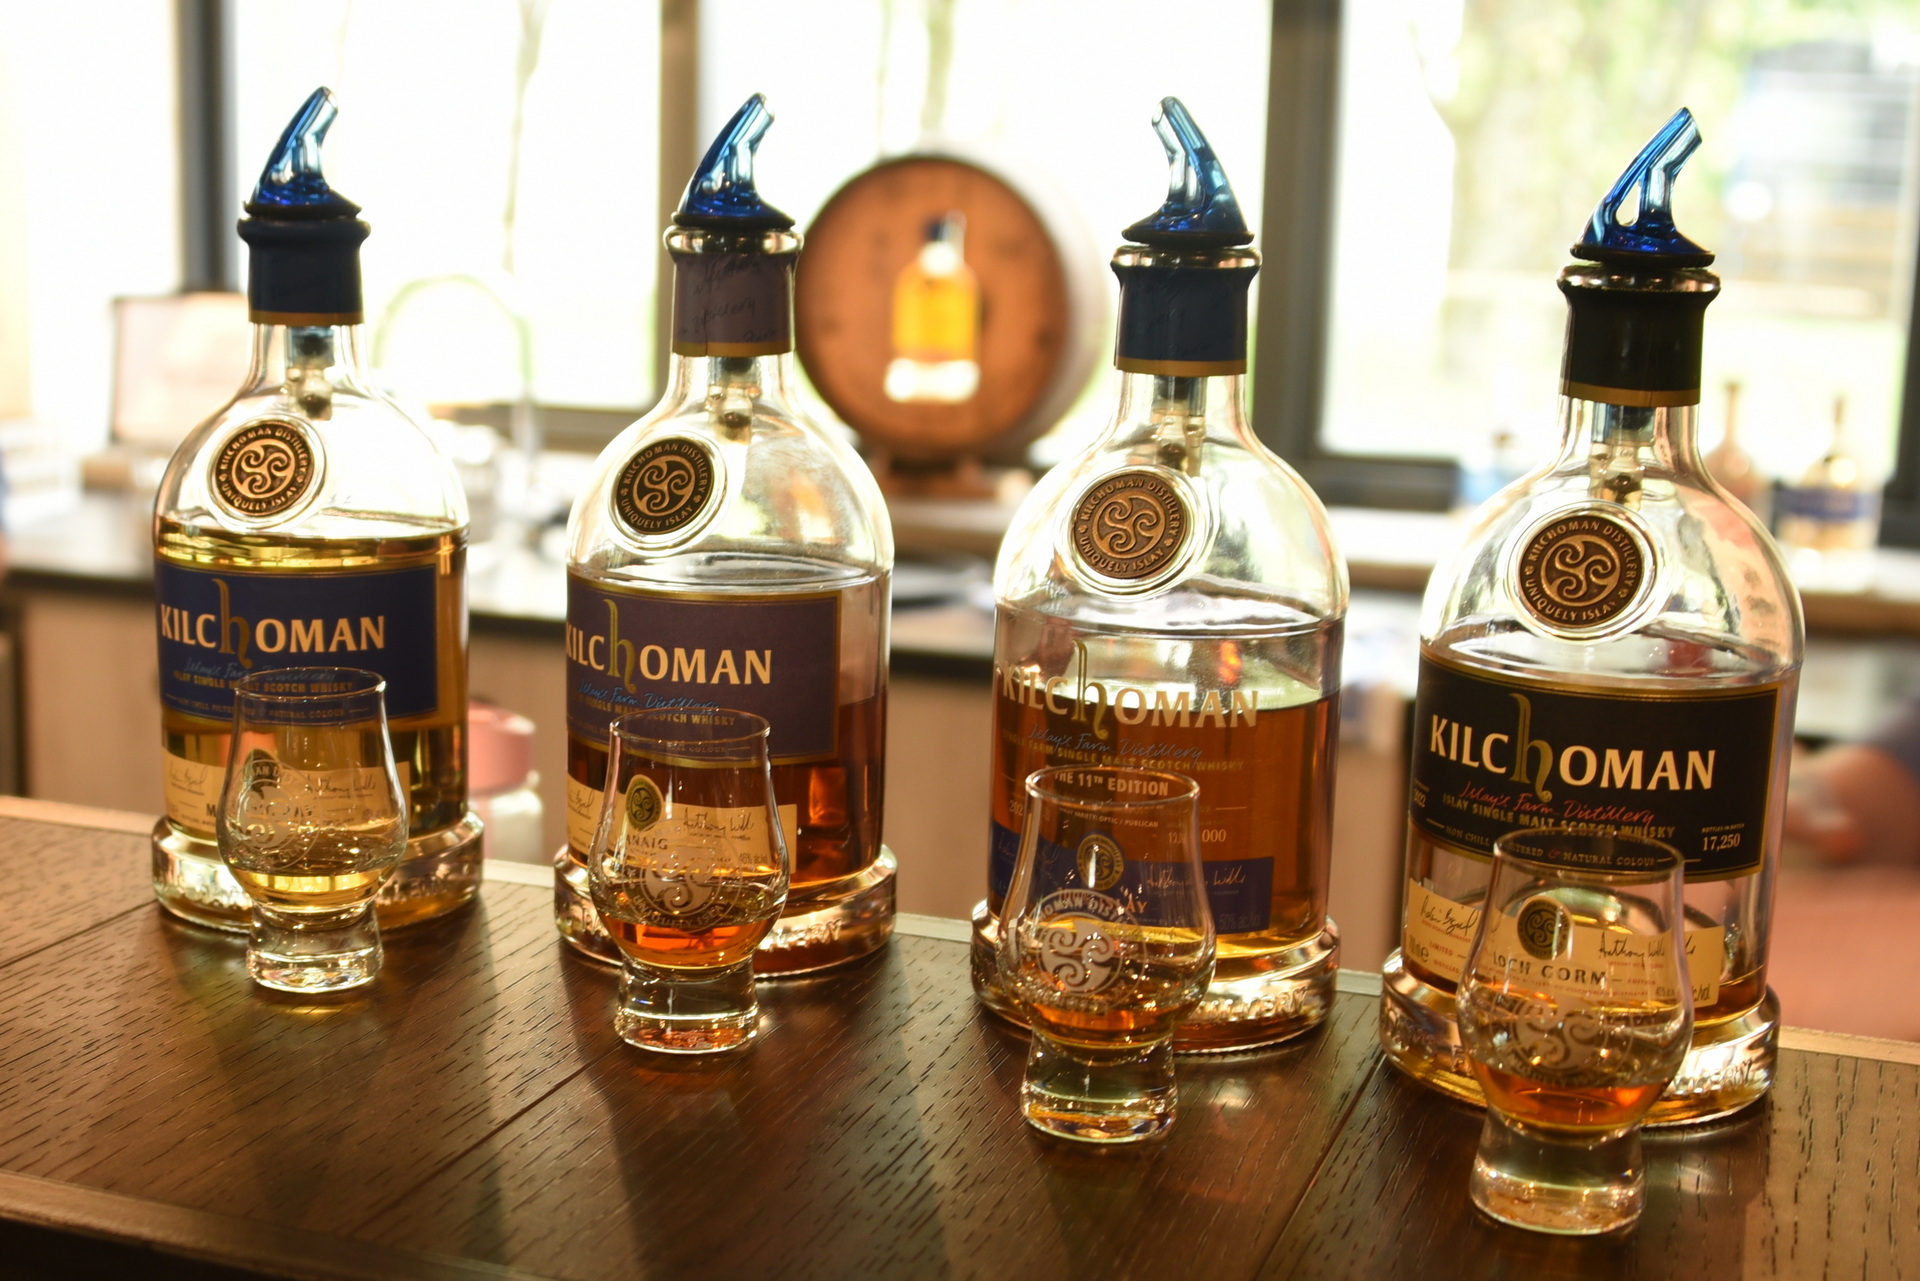
We zijn doorgereden naar de Kilchoman distillery. Hier kwamen we rond 14.15 aan. Het was inmiddels wel lunchtijd, dus we waren blij verrast dat ze hier een groot visitors centre hadden met een restaurant gedeelte. Terwijl we wachtte op een vrij tafeltje hebben we ook een tasting gedaan met een core range met 4 samplers.
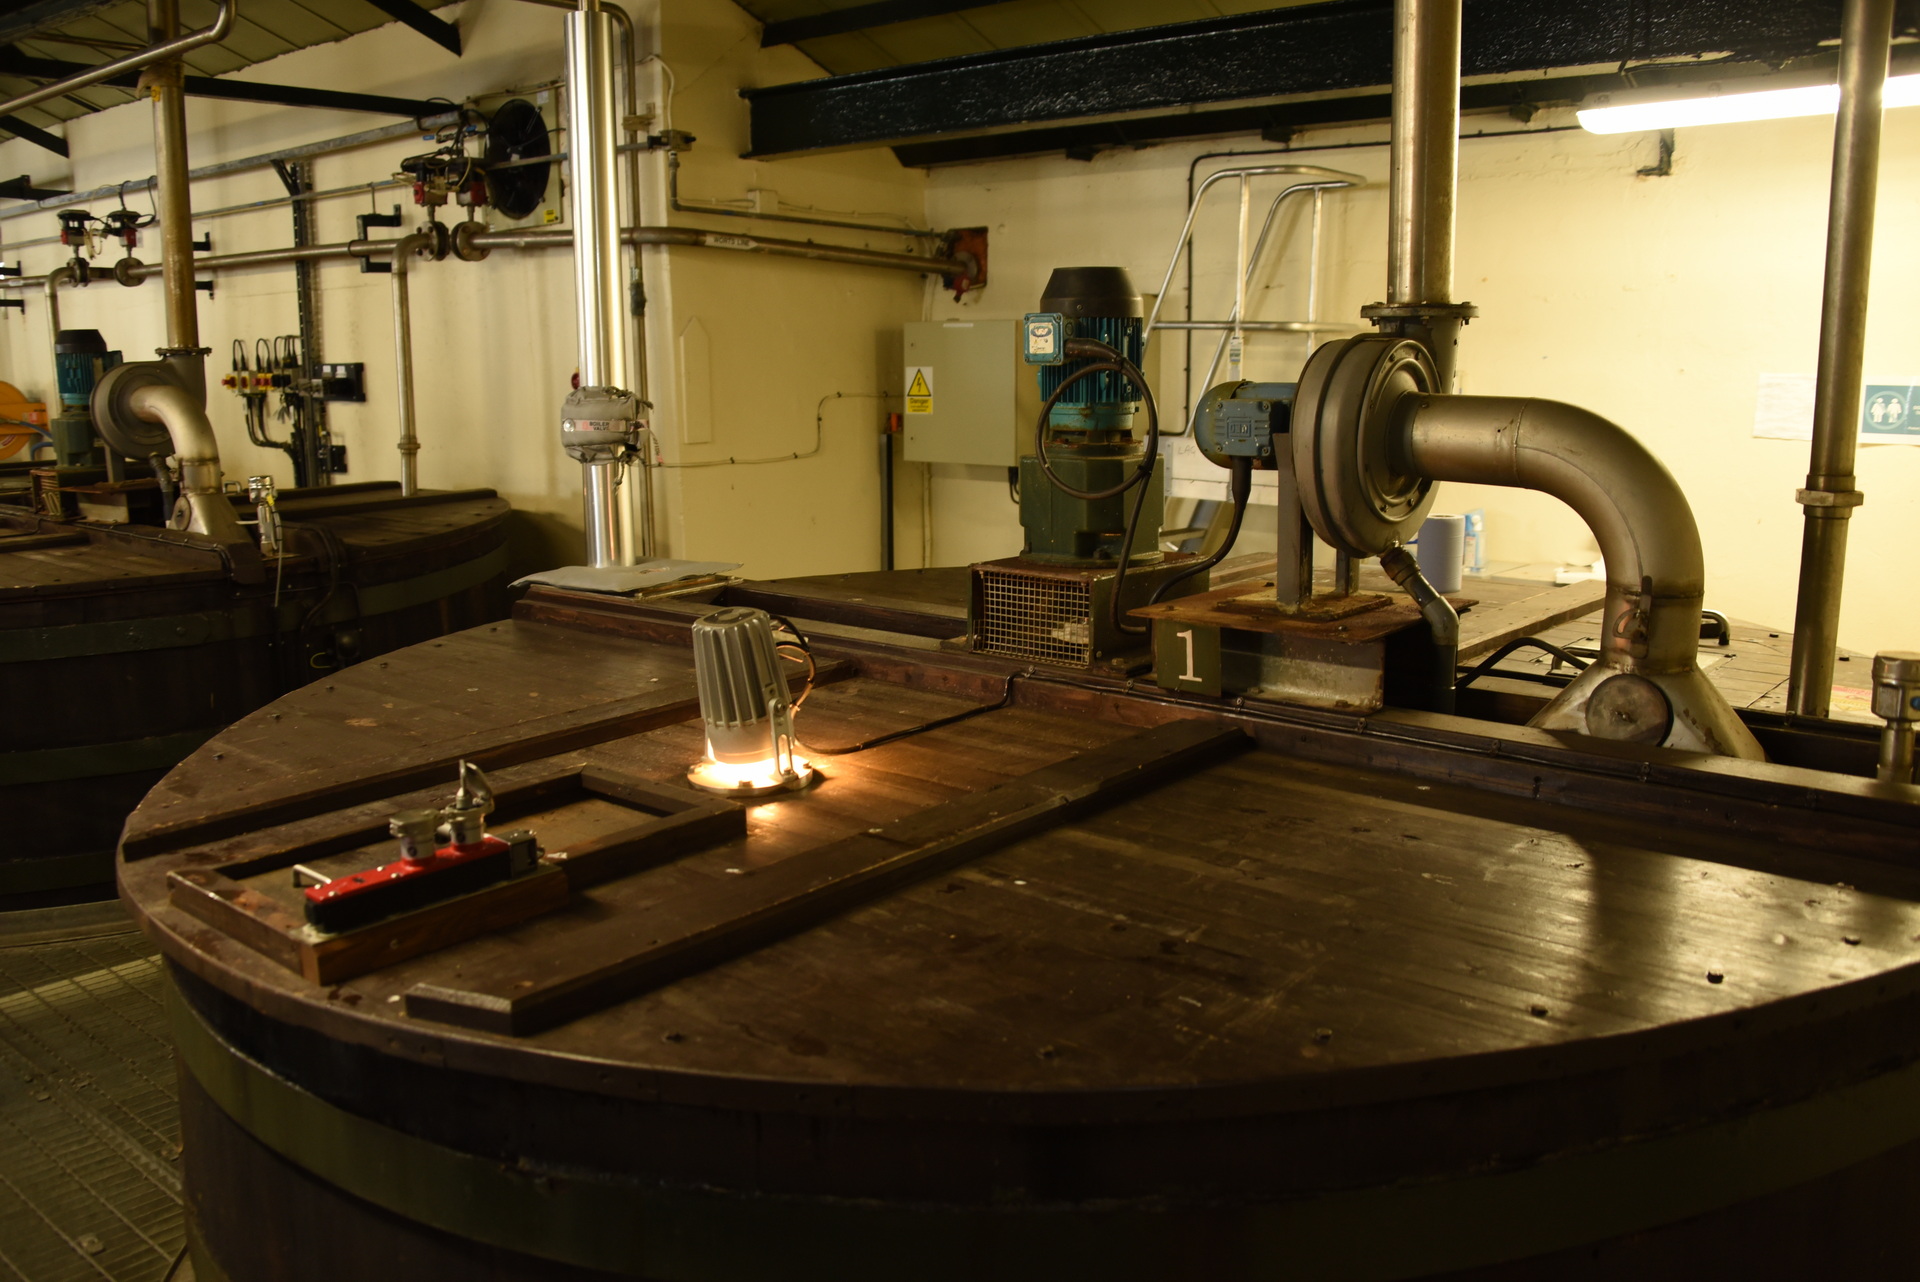
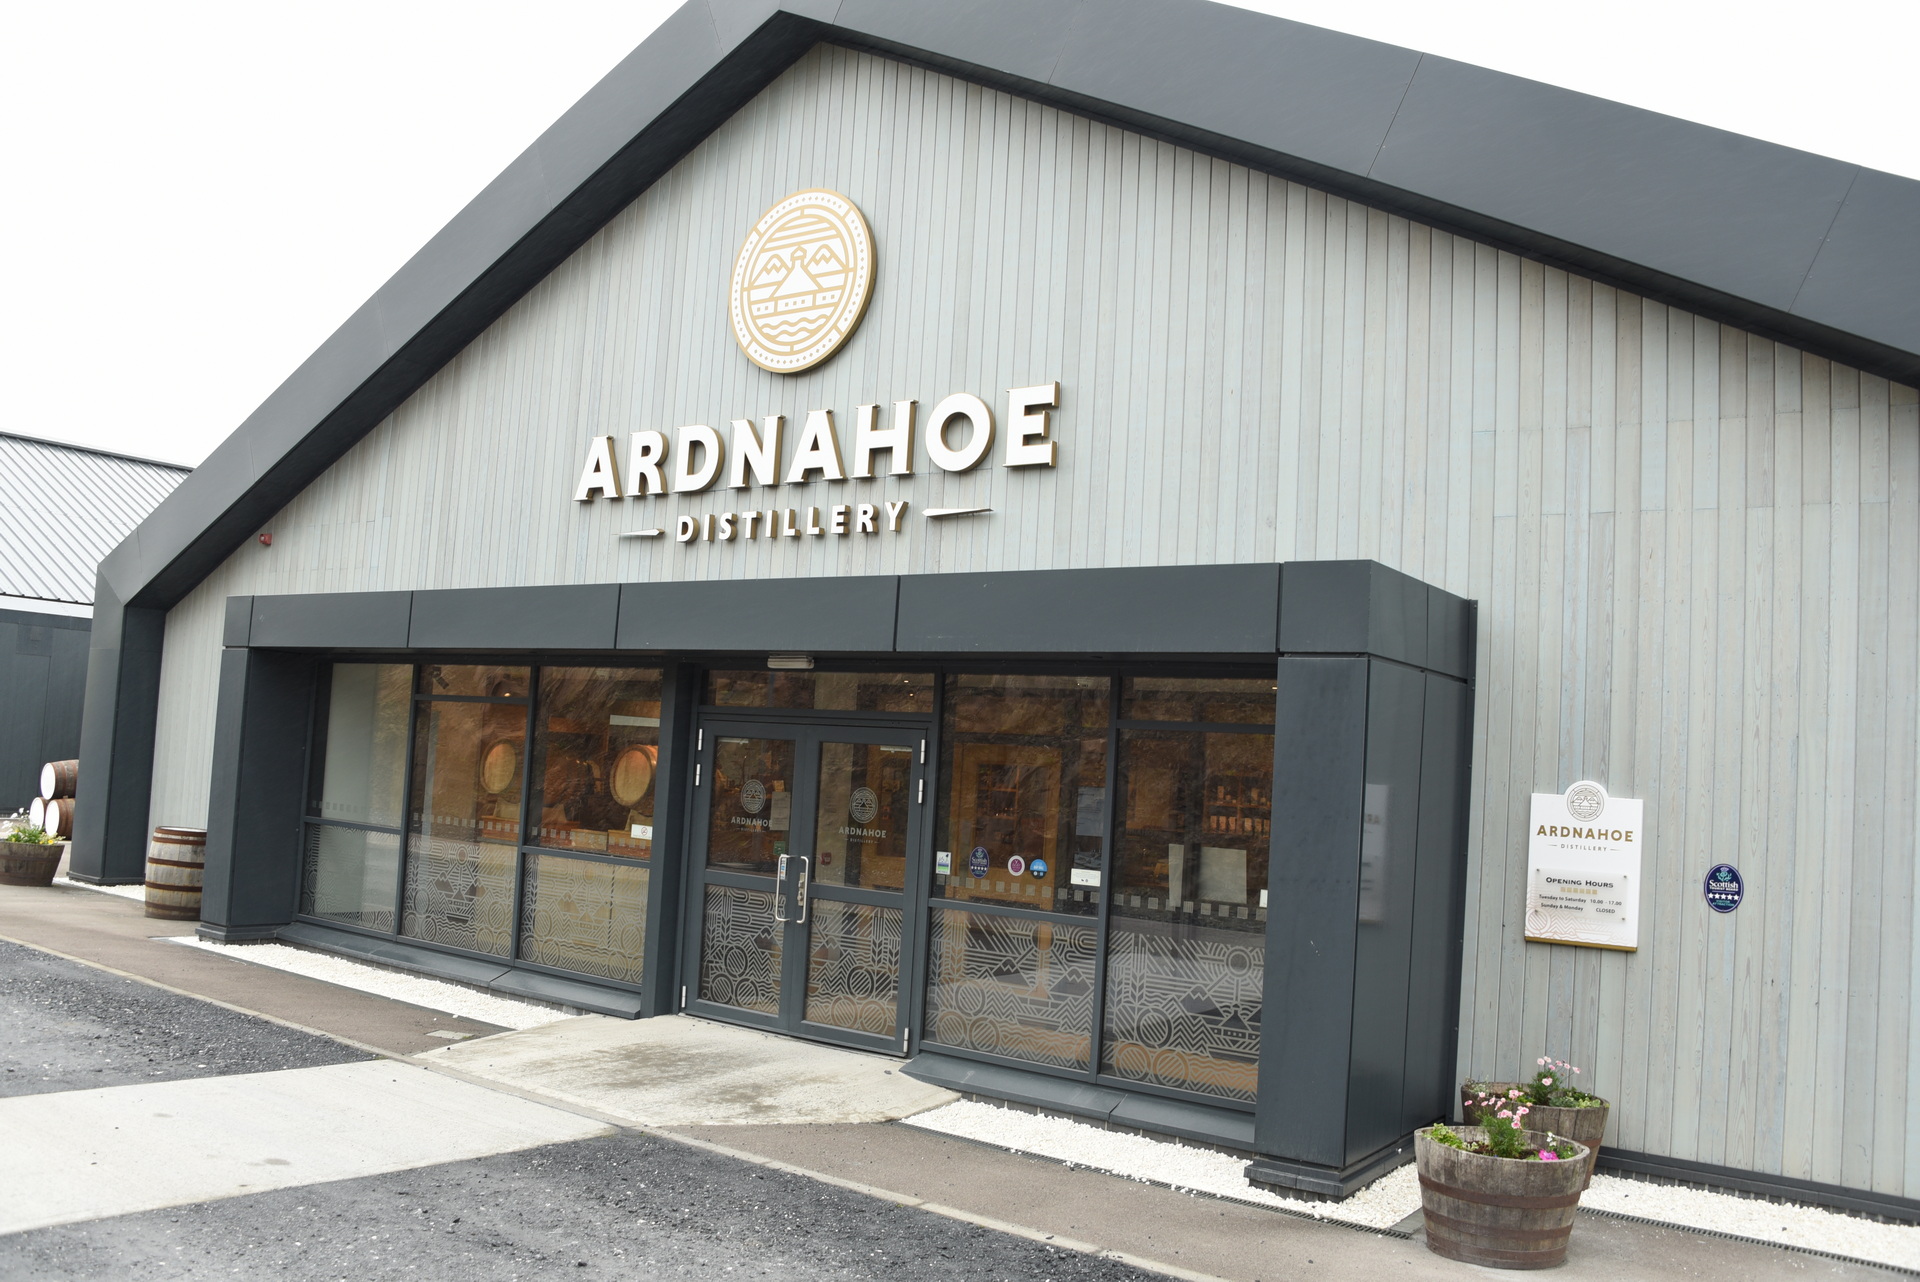
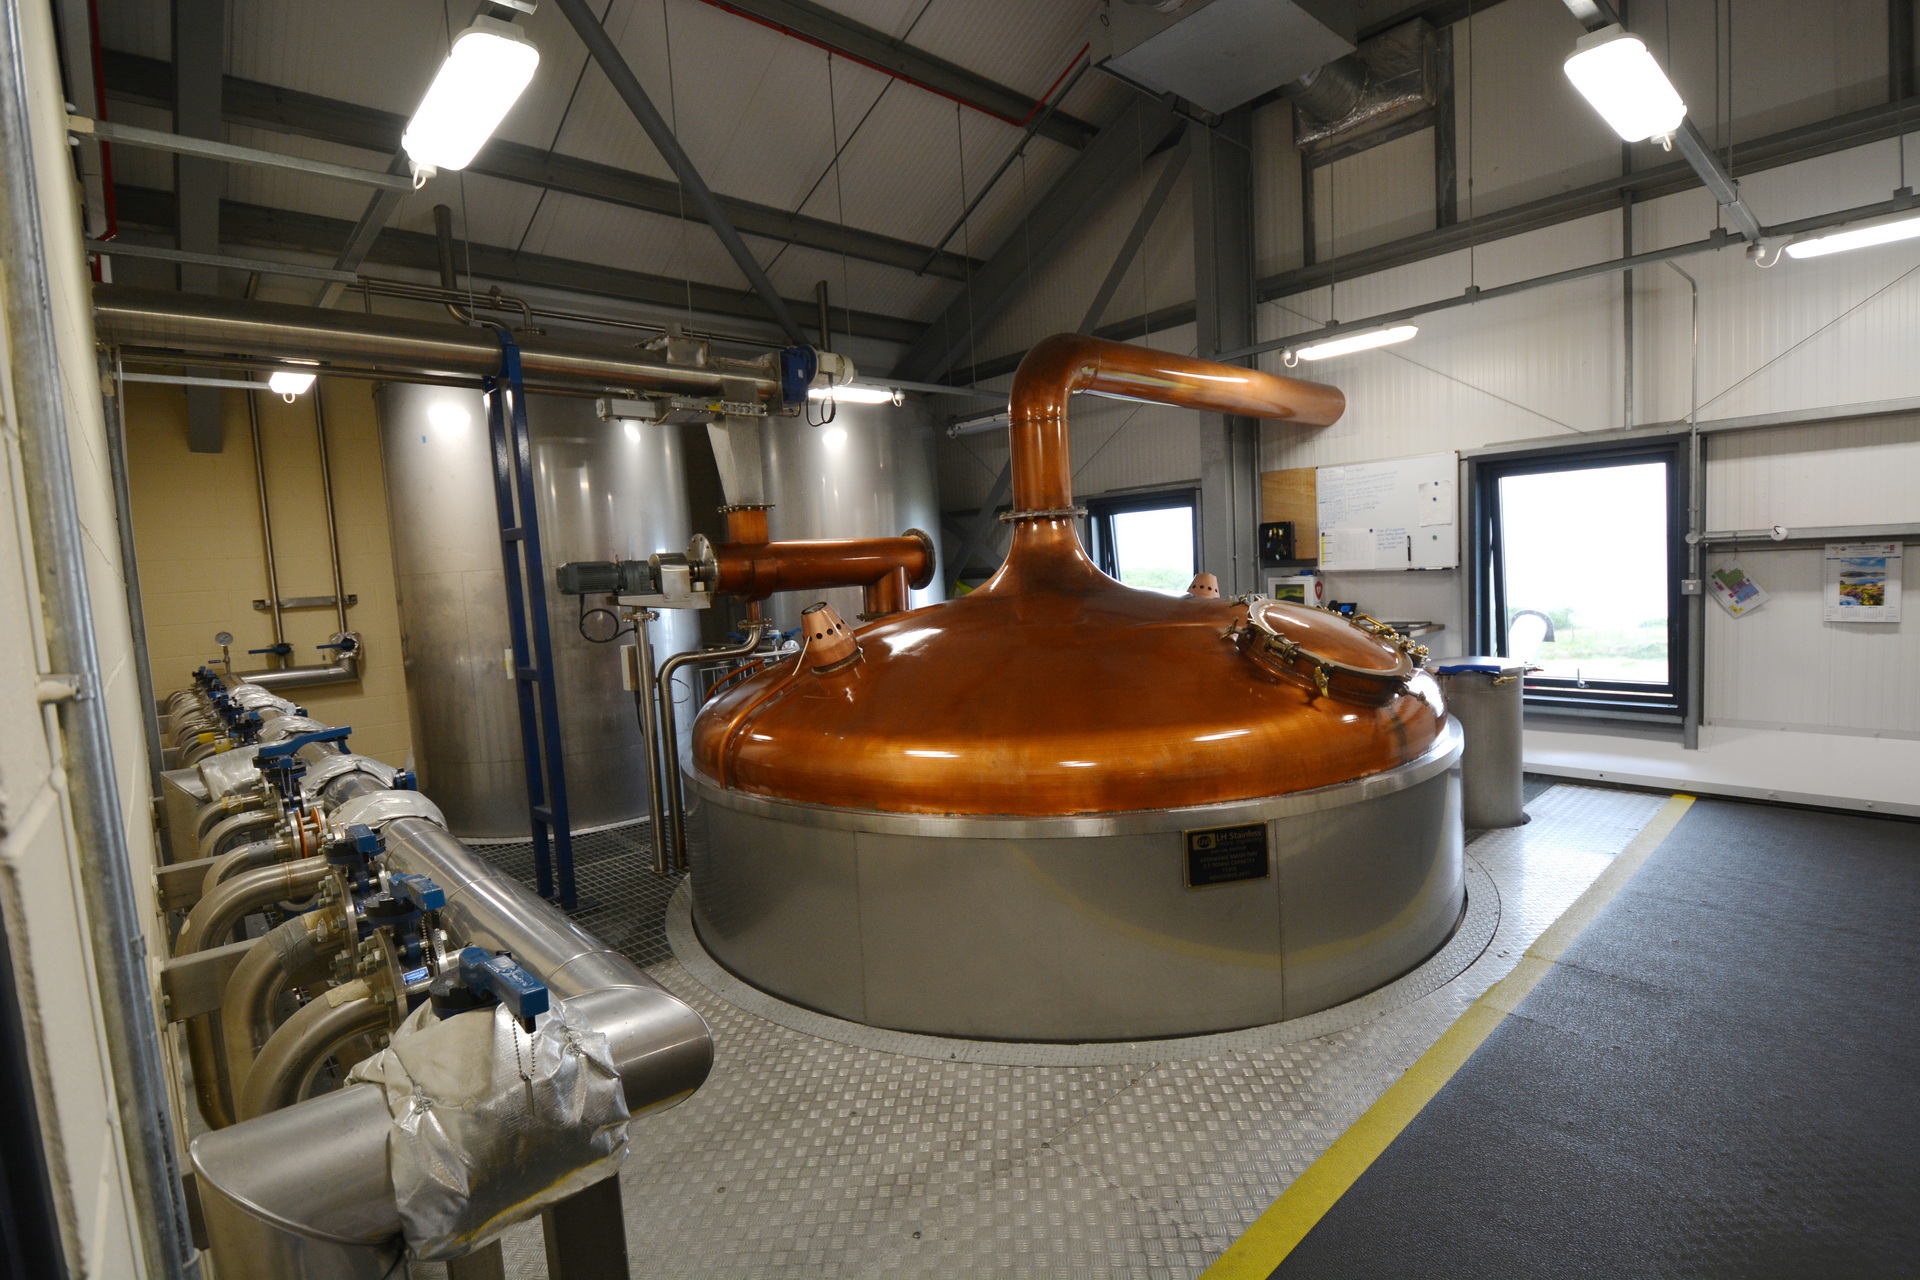
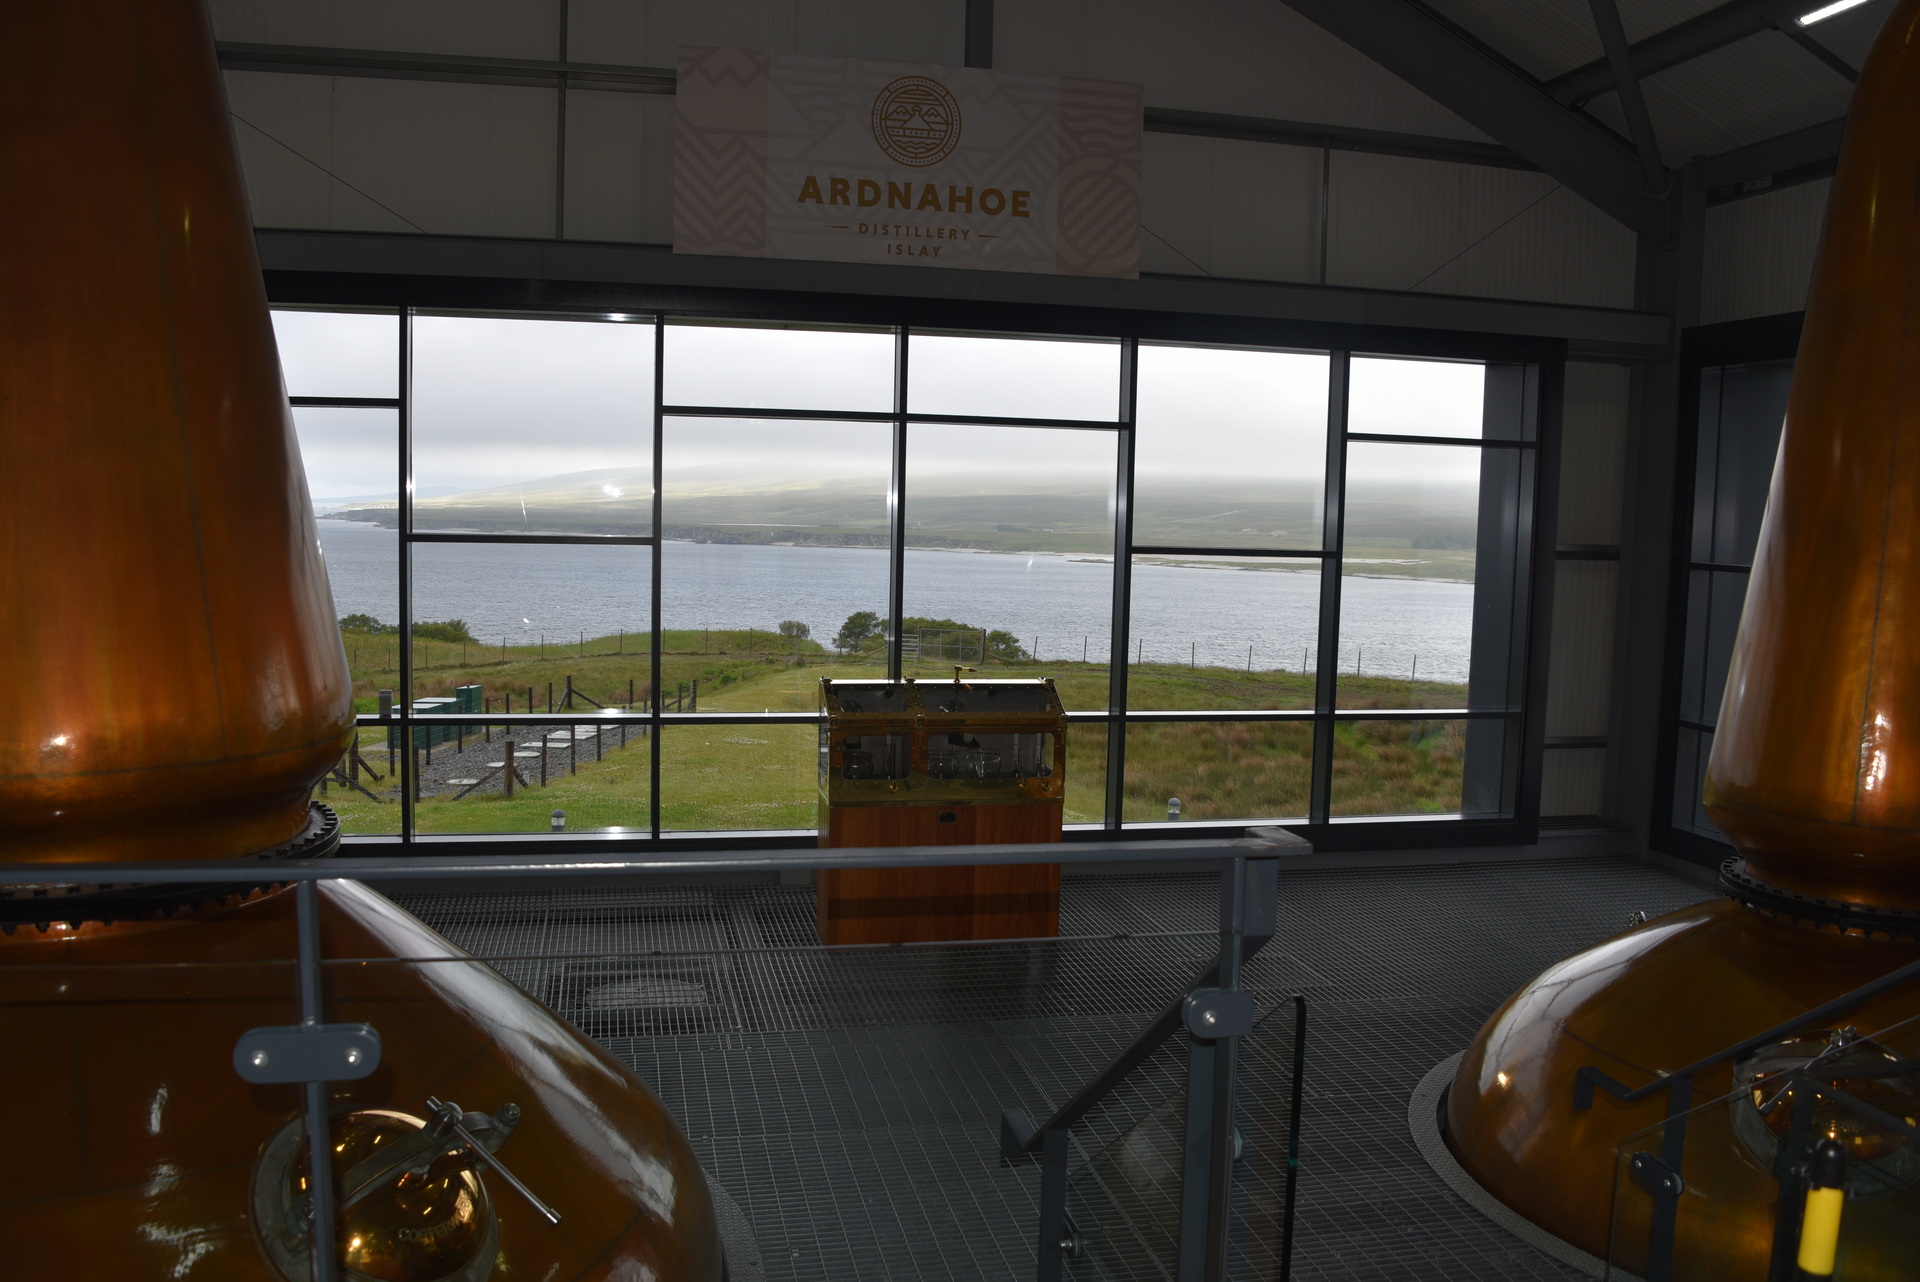
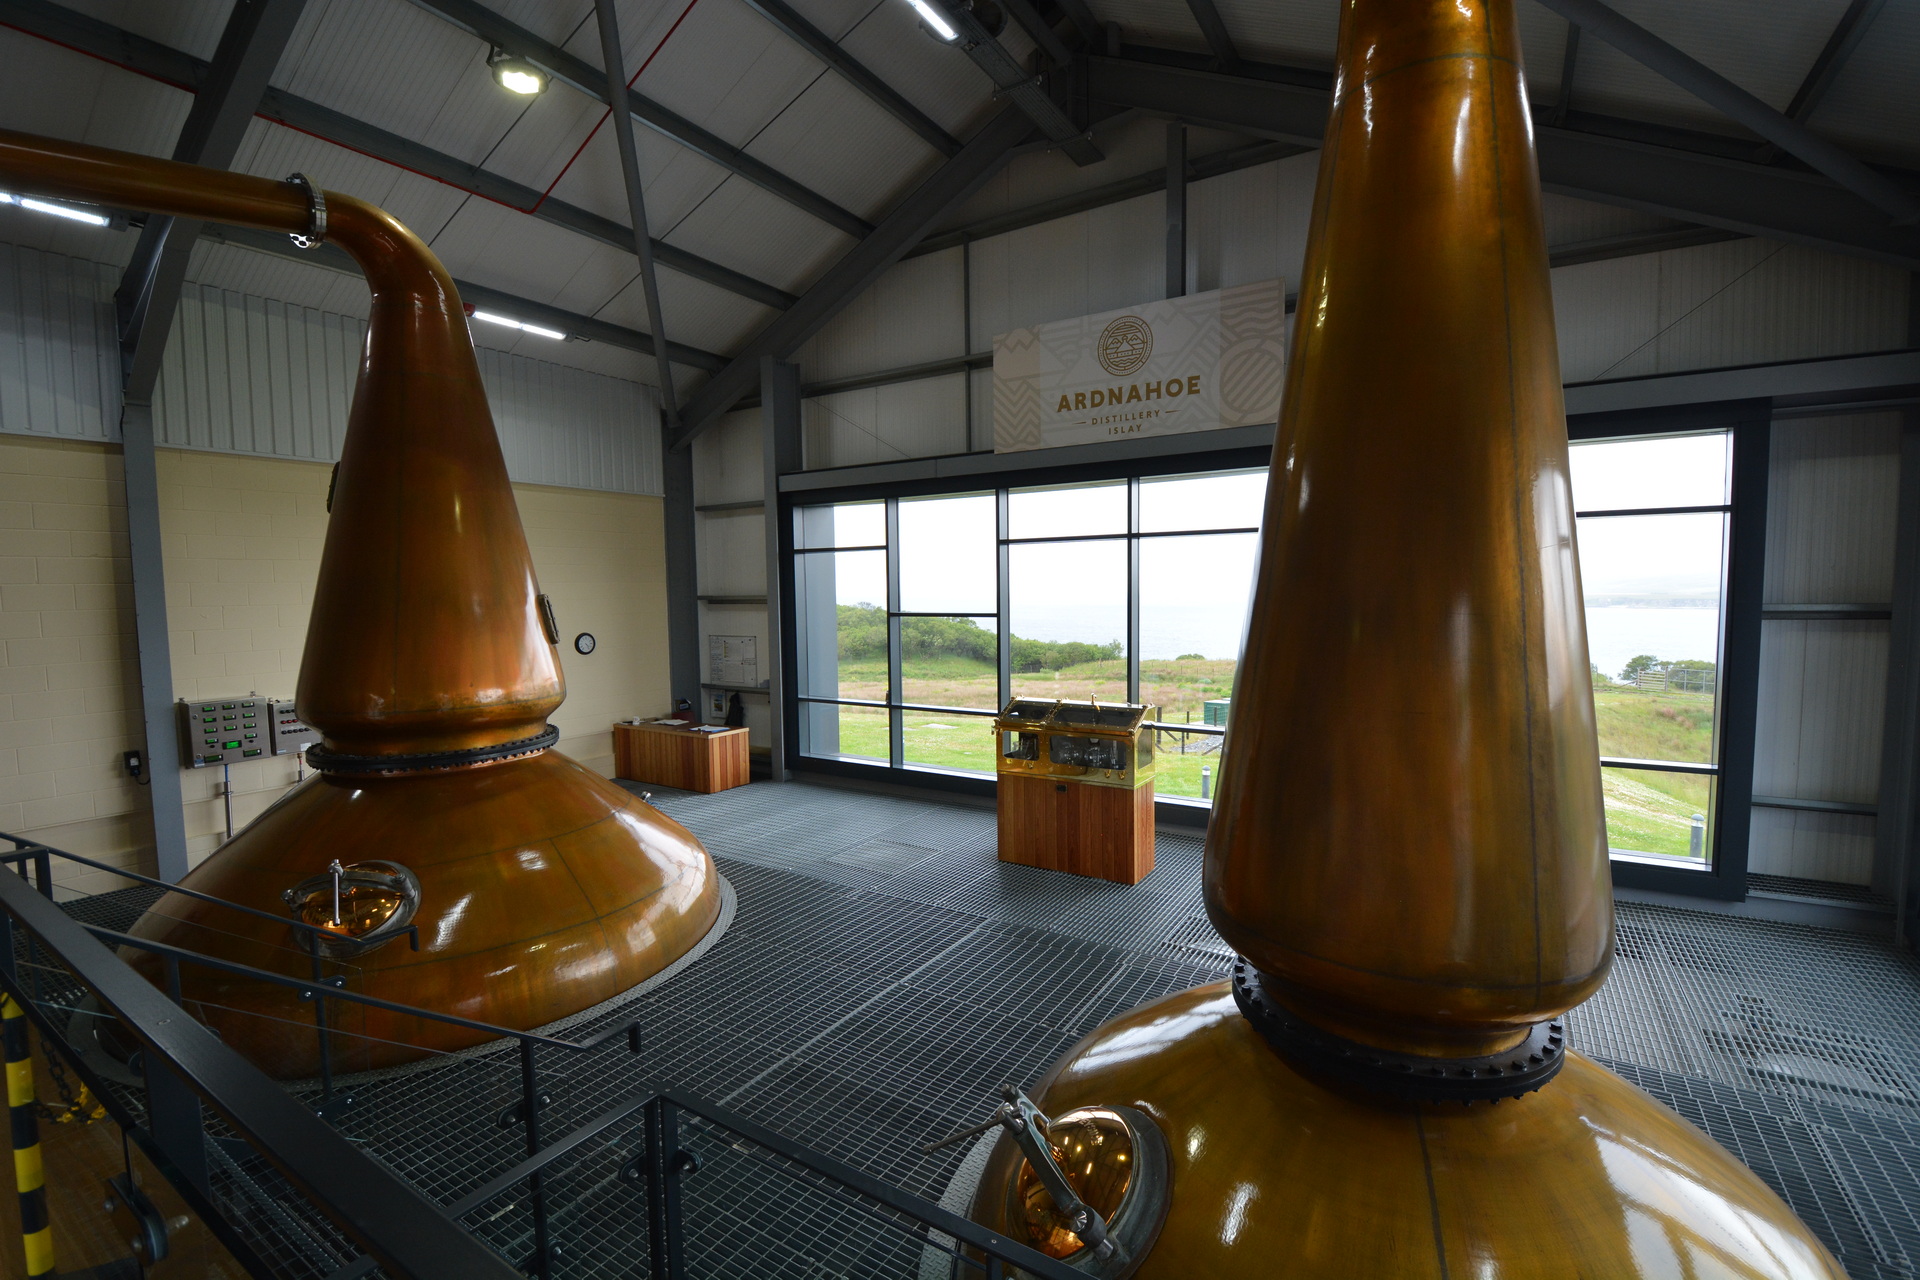
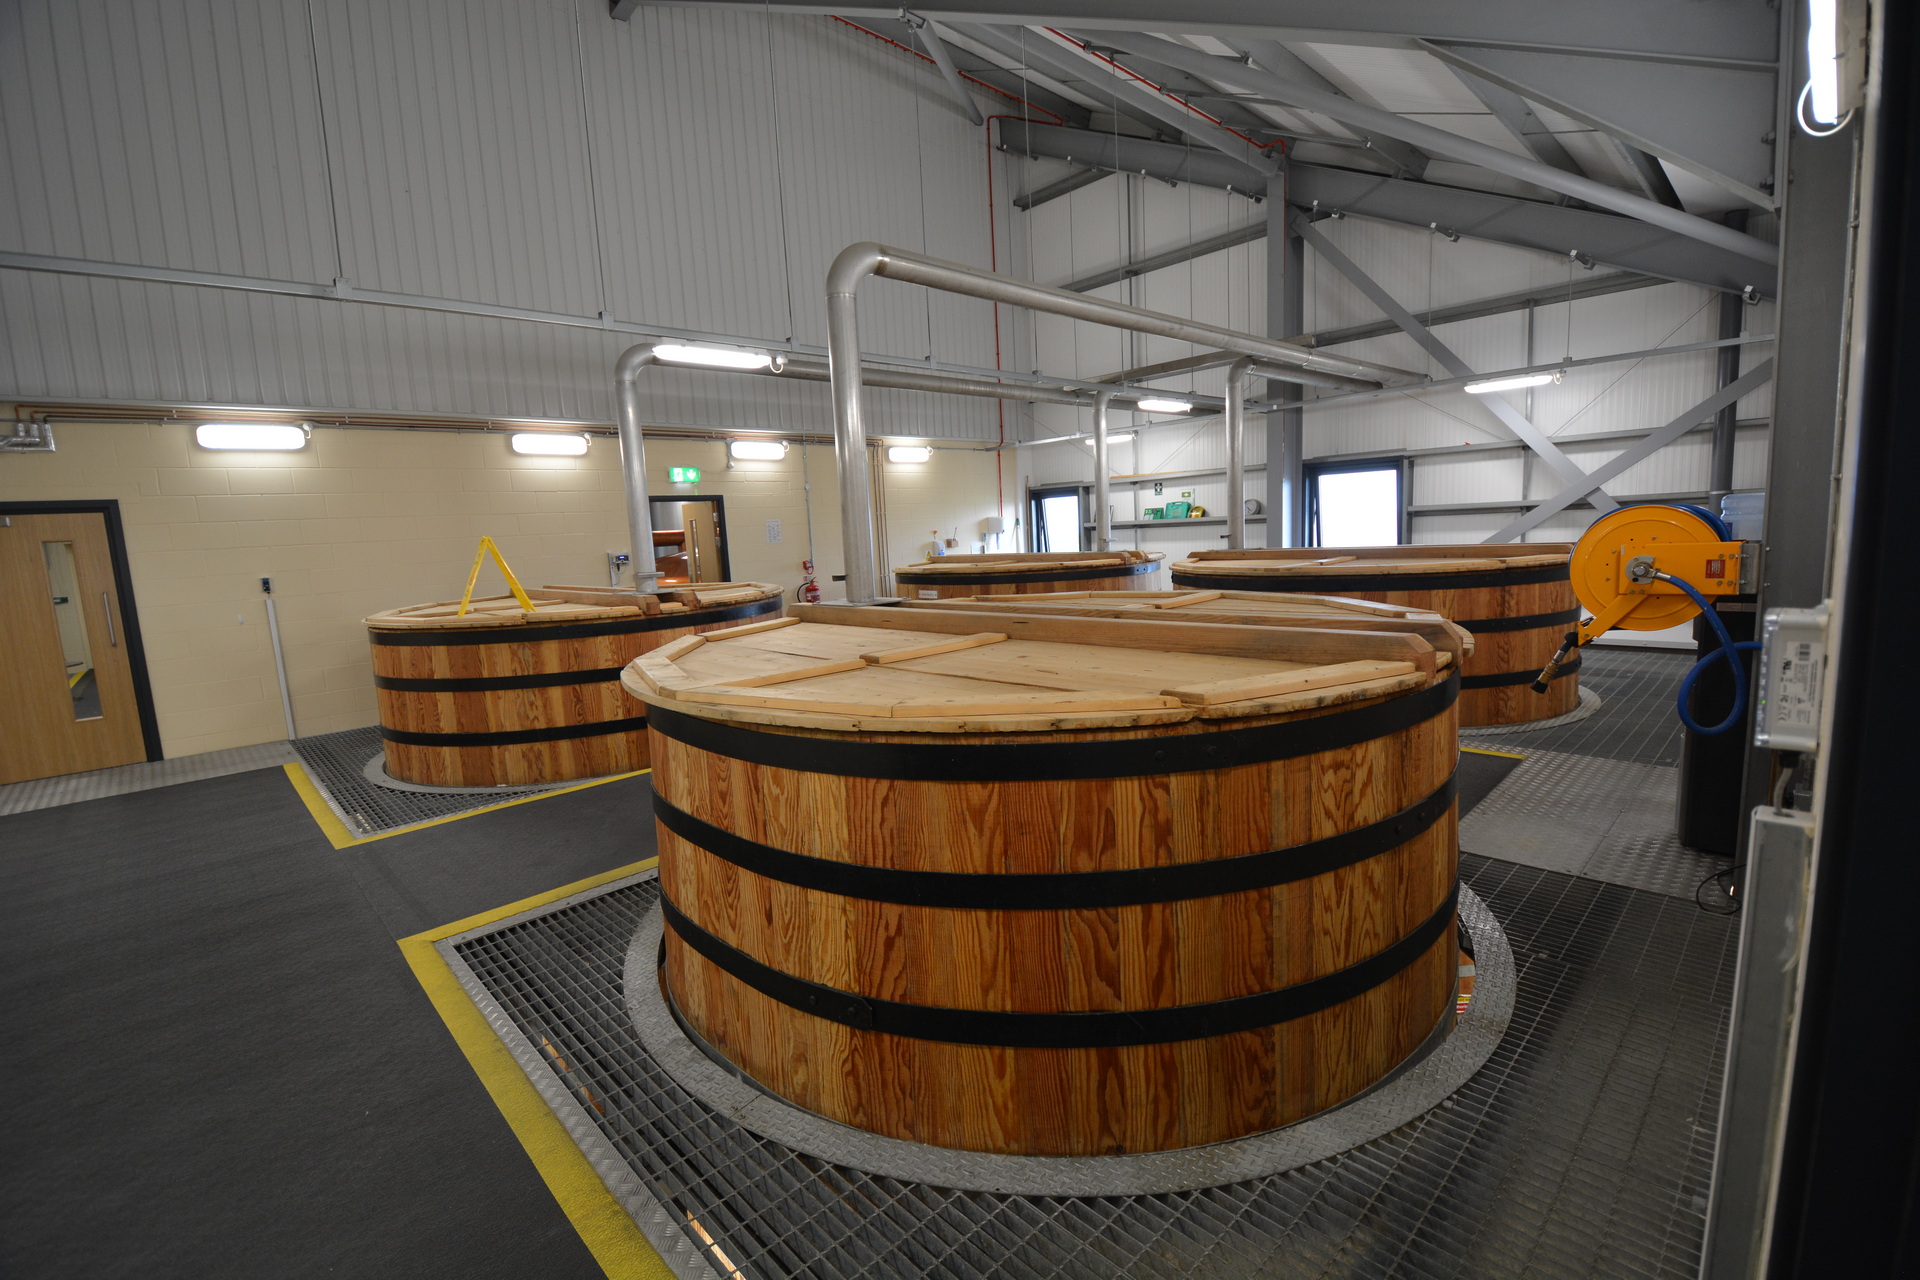
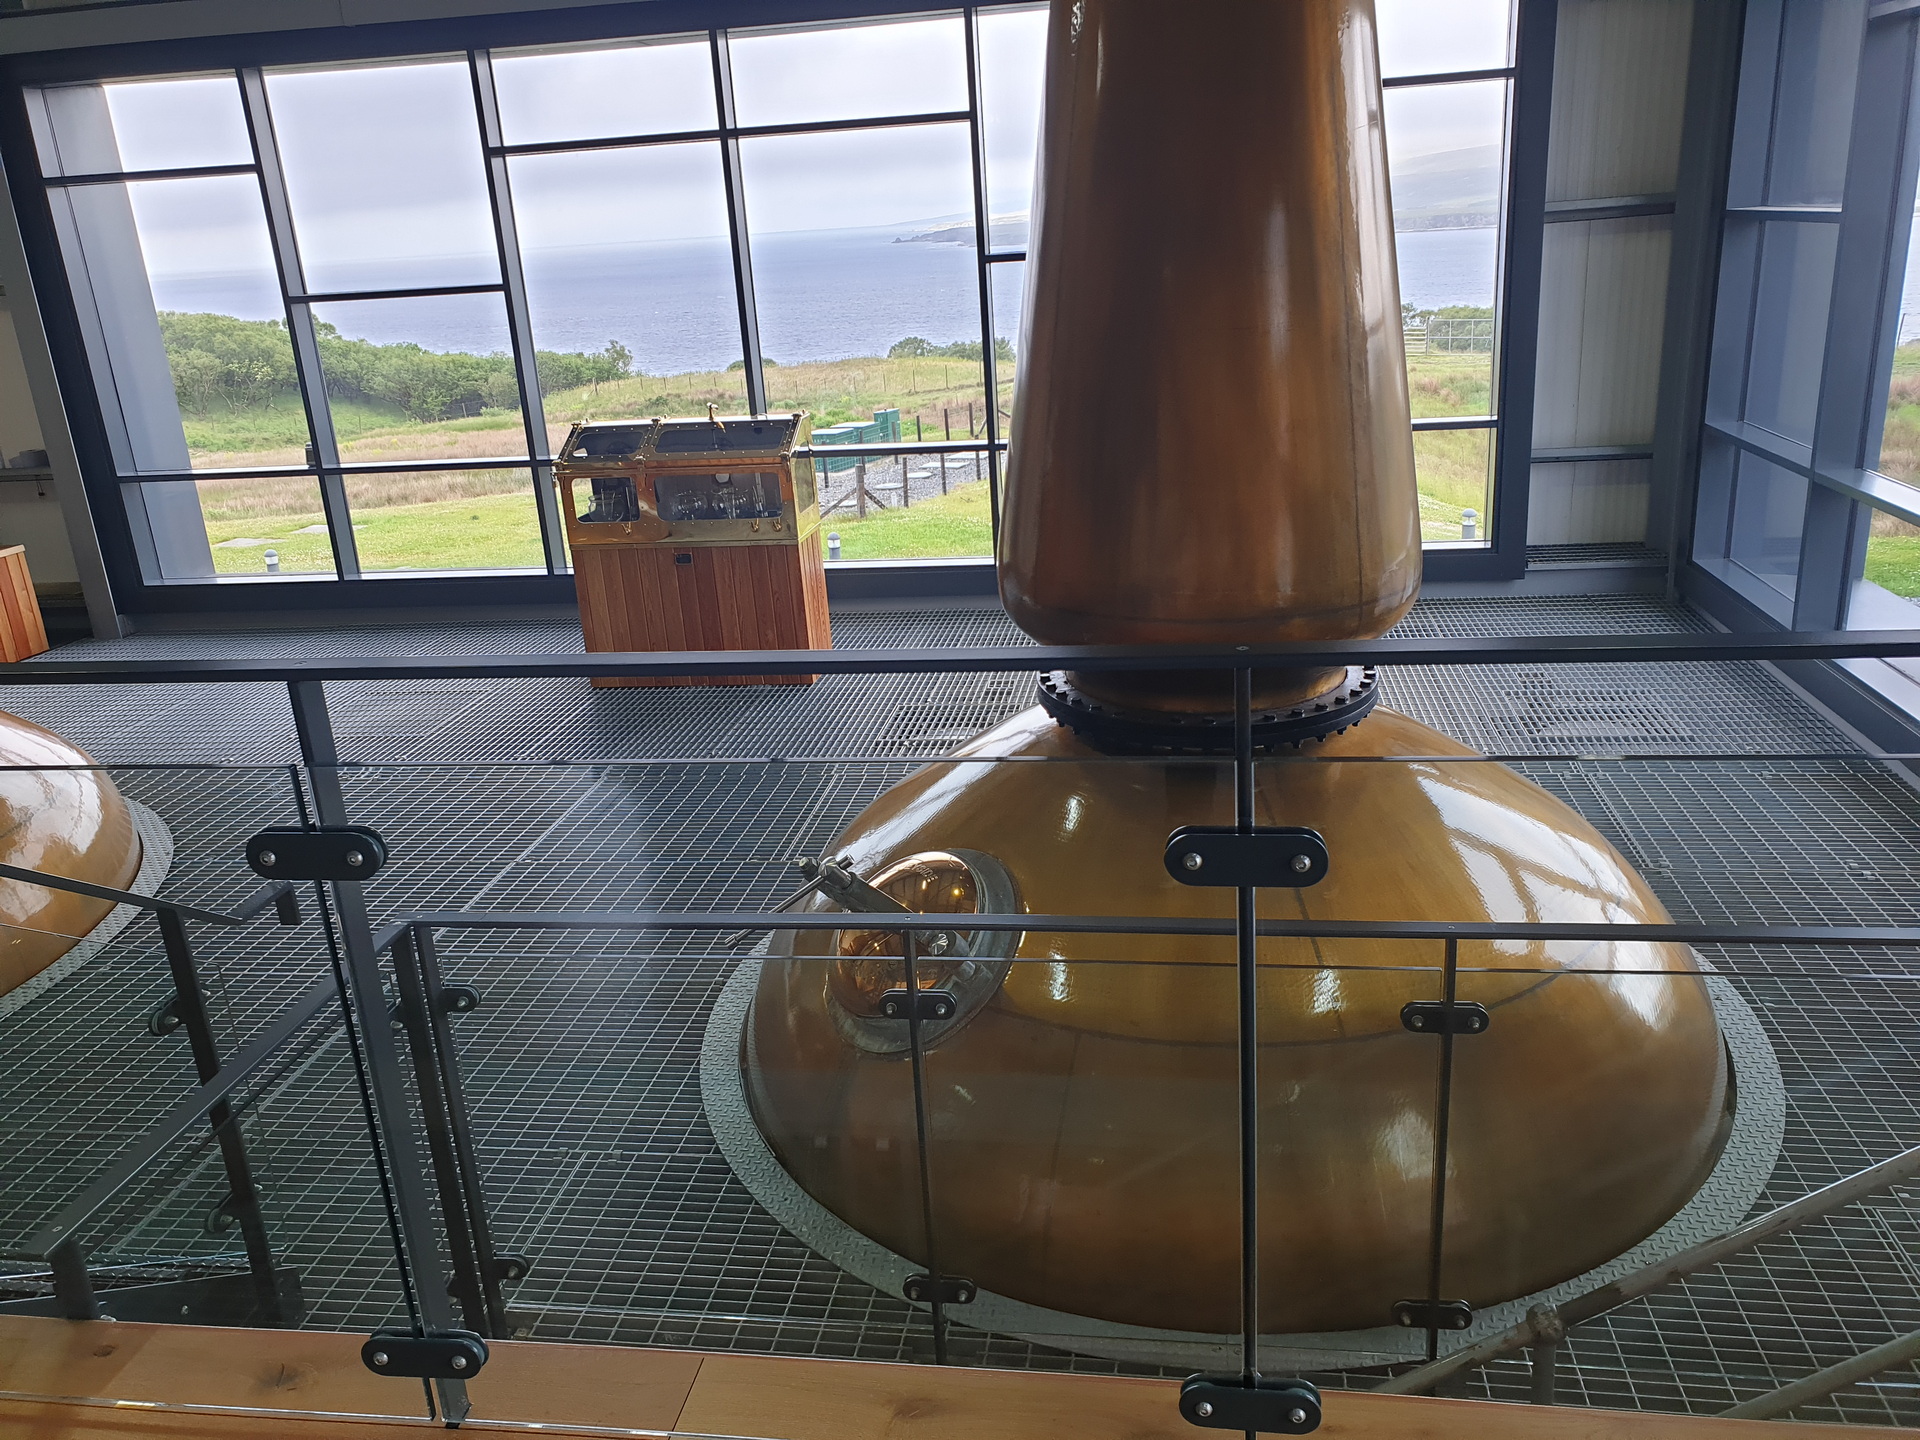
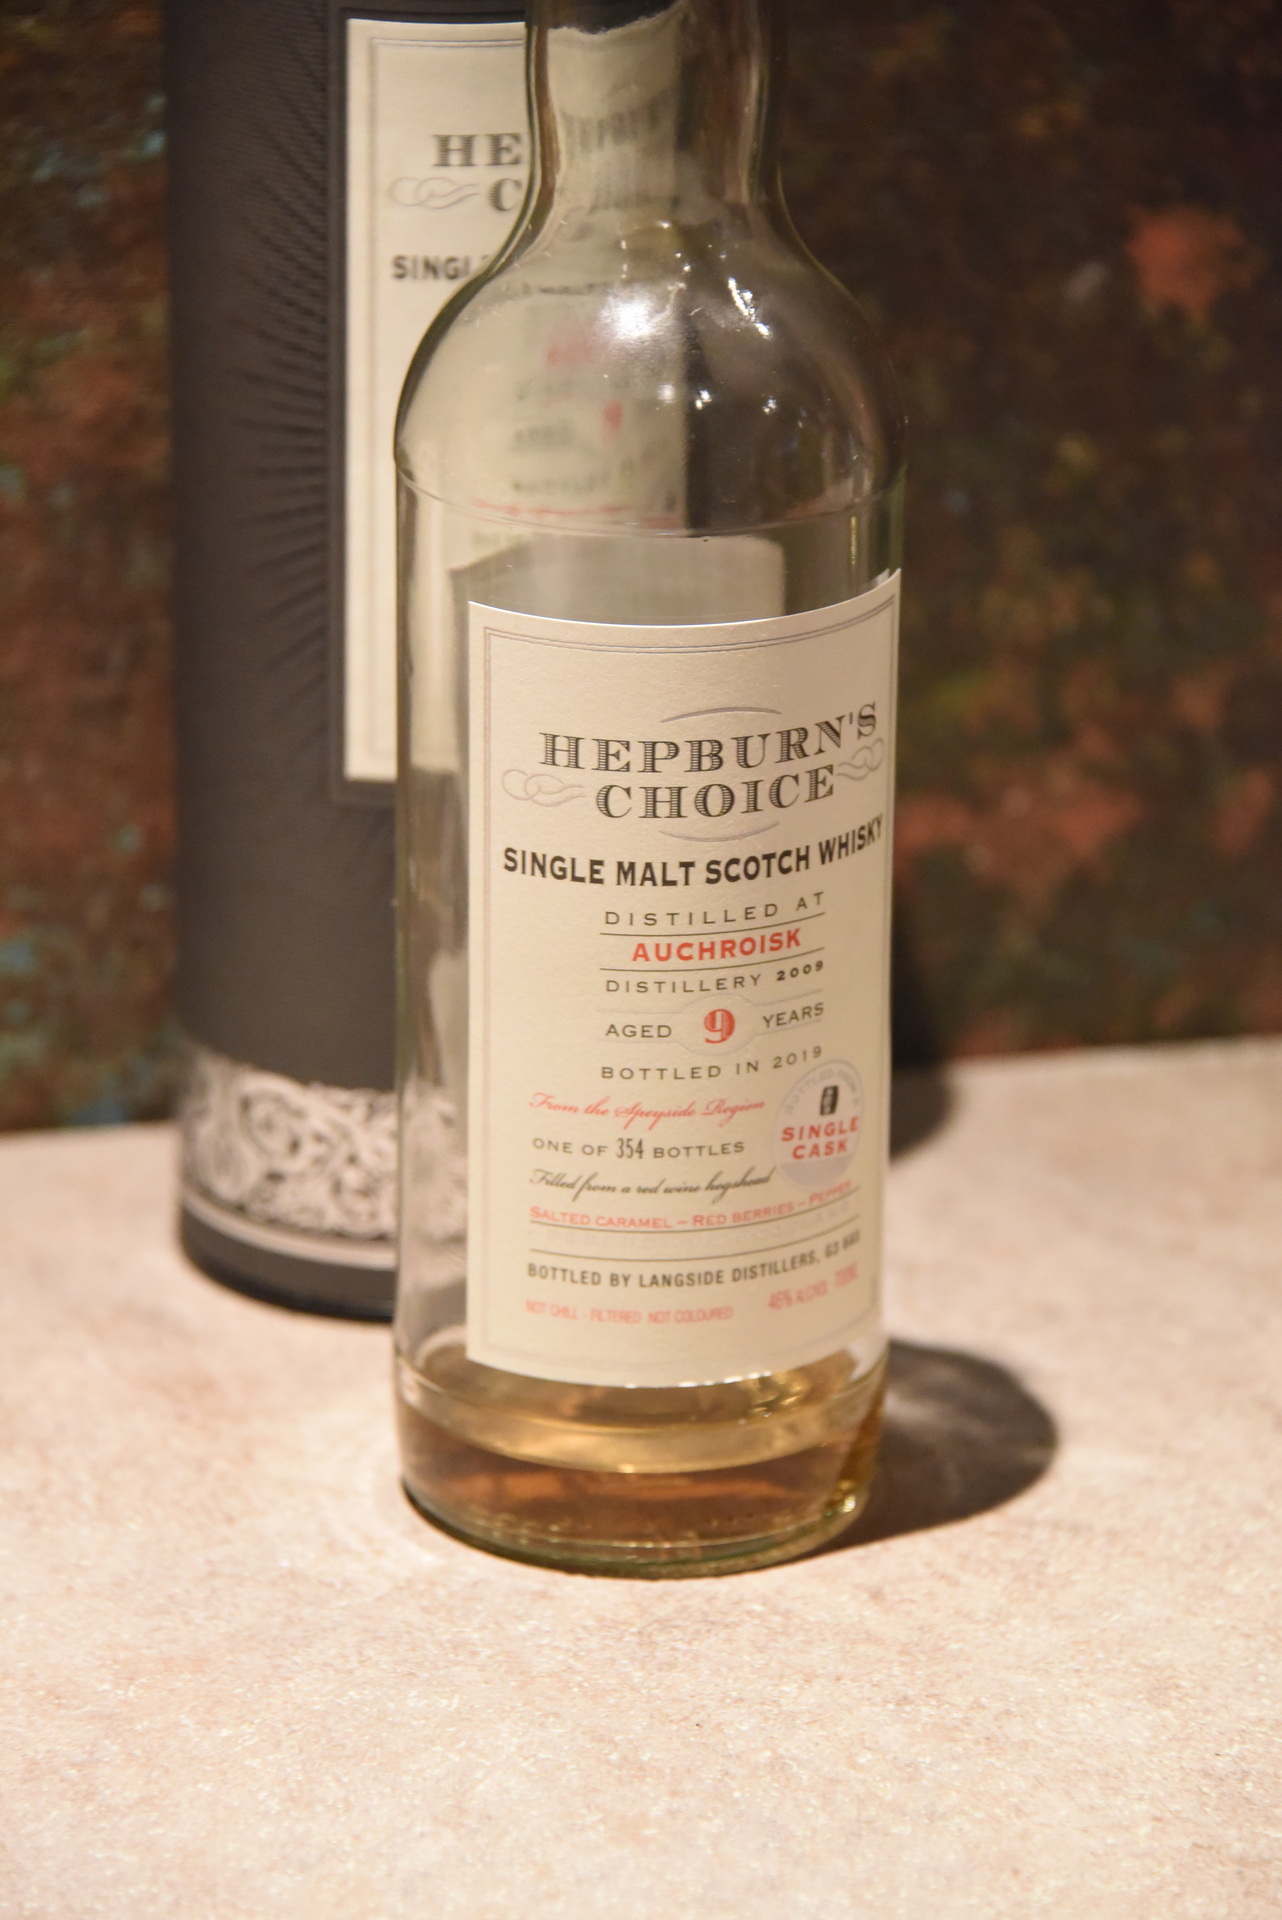
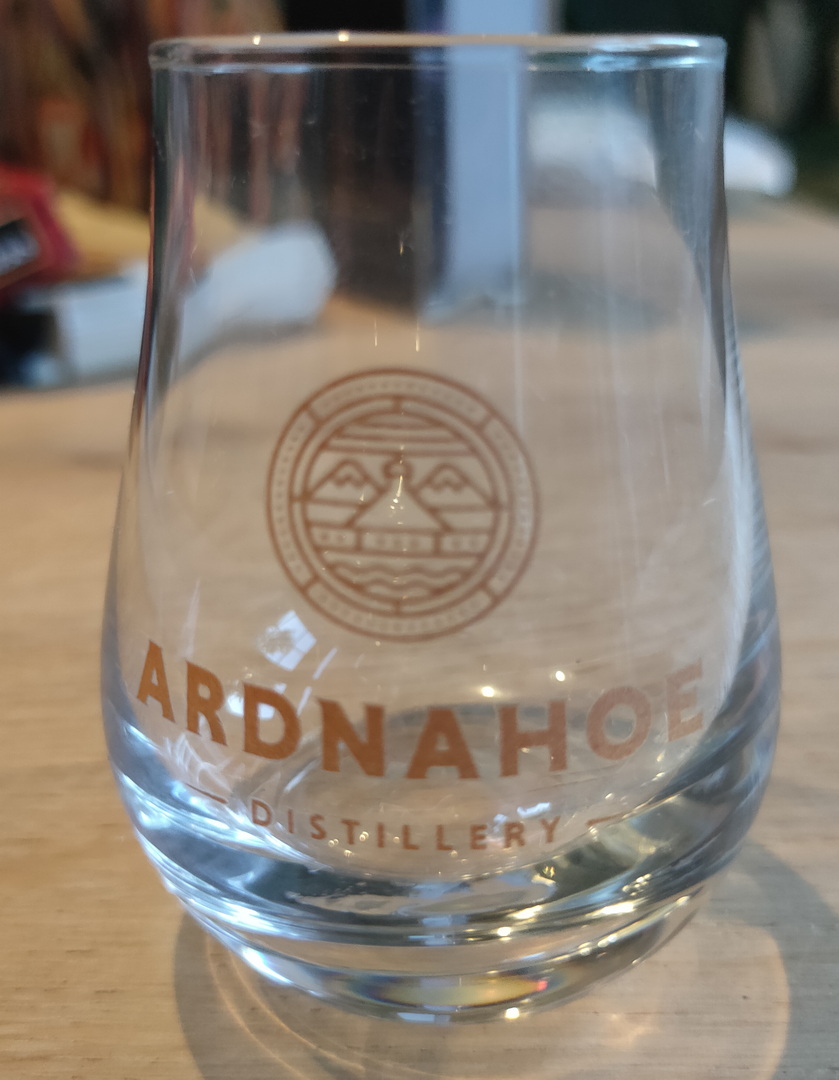
Vervolgens moesten we een beetje aanmaken om op tijd voor de rondleiding bij de Ardnahoe distillery te zijn, het was namelijk 15.15 en het was minstens nog een half uur rijden terwijl we onze rondleiding om 16 van start zou gaan. Na ons aangemeld te hebben, hadden we zelfs nog even tijd om door het shopje heen te lopen. Om 16 uur ging onze tour van start. Ardnahoe is de jongste distillery op Islay en is pas sinds 2018 in werking. Dit betekende dat we wel een rondleiding door de werkende distillery konden krijgen, maar nog niet hun eigen whisky konden proeven. Na rondgeleid te zijn, waarbij de stills het meest indrukwekkend waren oa door de ruimte waarin ze stonden met een prachtig uitzicht richting Jura, konden we kiezen uit 4 flessen van welke we een dram wilde proeven, 1 van de 2 mystery blends of 1 van de 2 mystery malts. Henri nam de Hepburn’s choice (Auchroisk 9yr) die gematureerd was op rode wijnvaten, en Coline heeft de andere malt meegenomen in een driver’s flesje. Hier mochten we de tasting glaasjes meenemen. Nadat we onze tasters op hadden zijn we er snel vandoor gegaan om nog net voor sluitingstijd bij de Bunnahabhain distillery het shopje in te kunnen duiken.
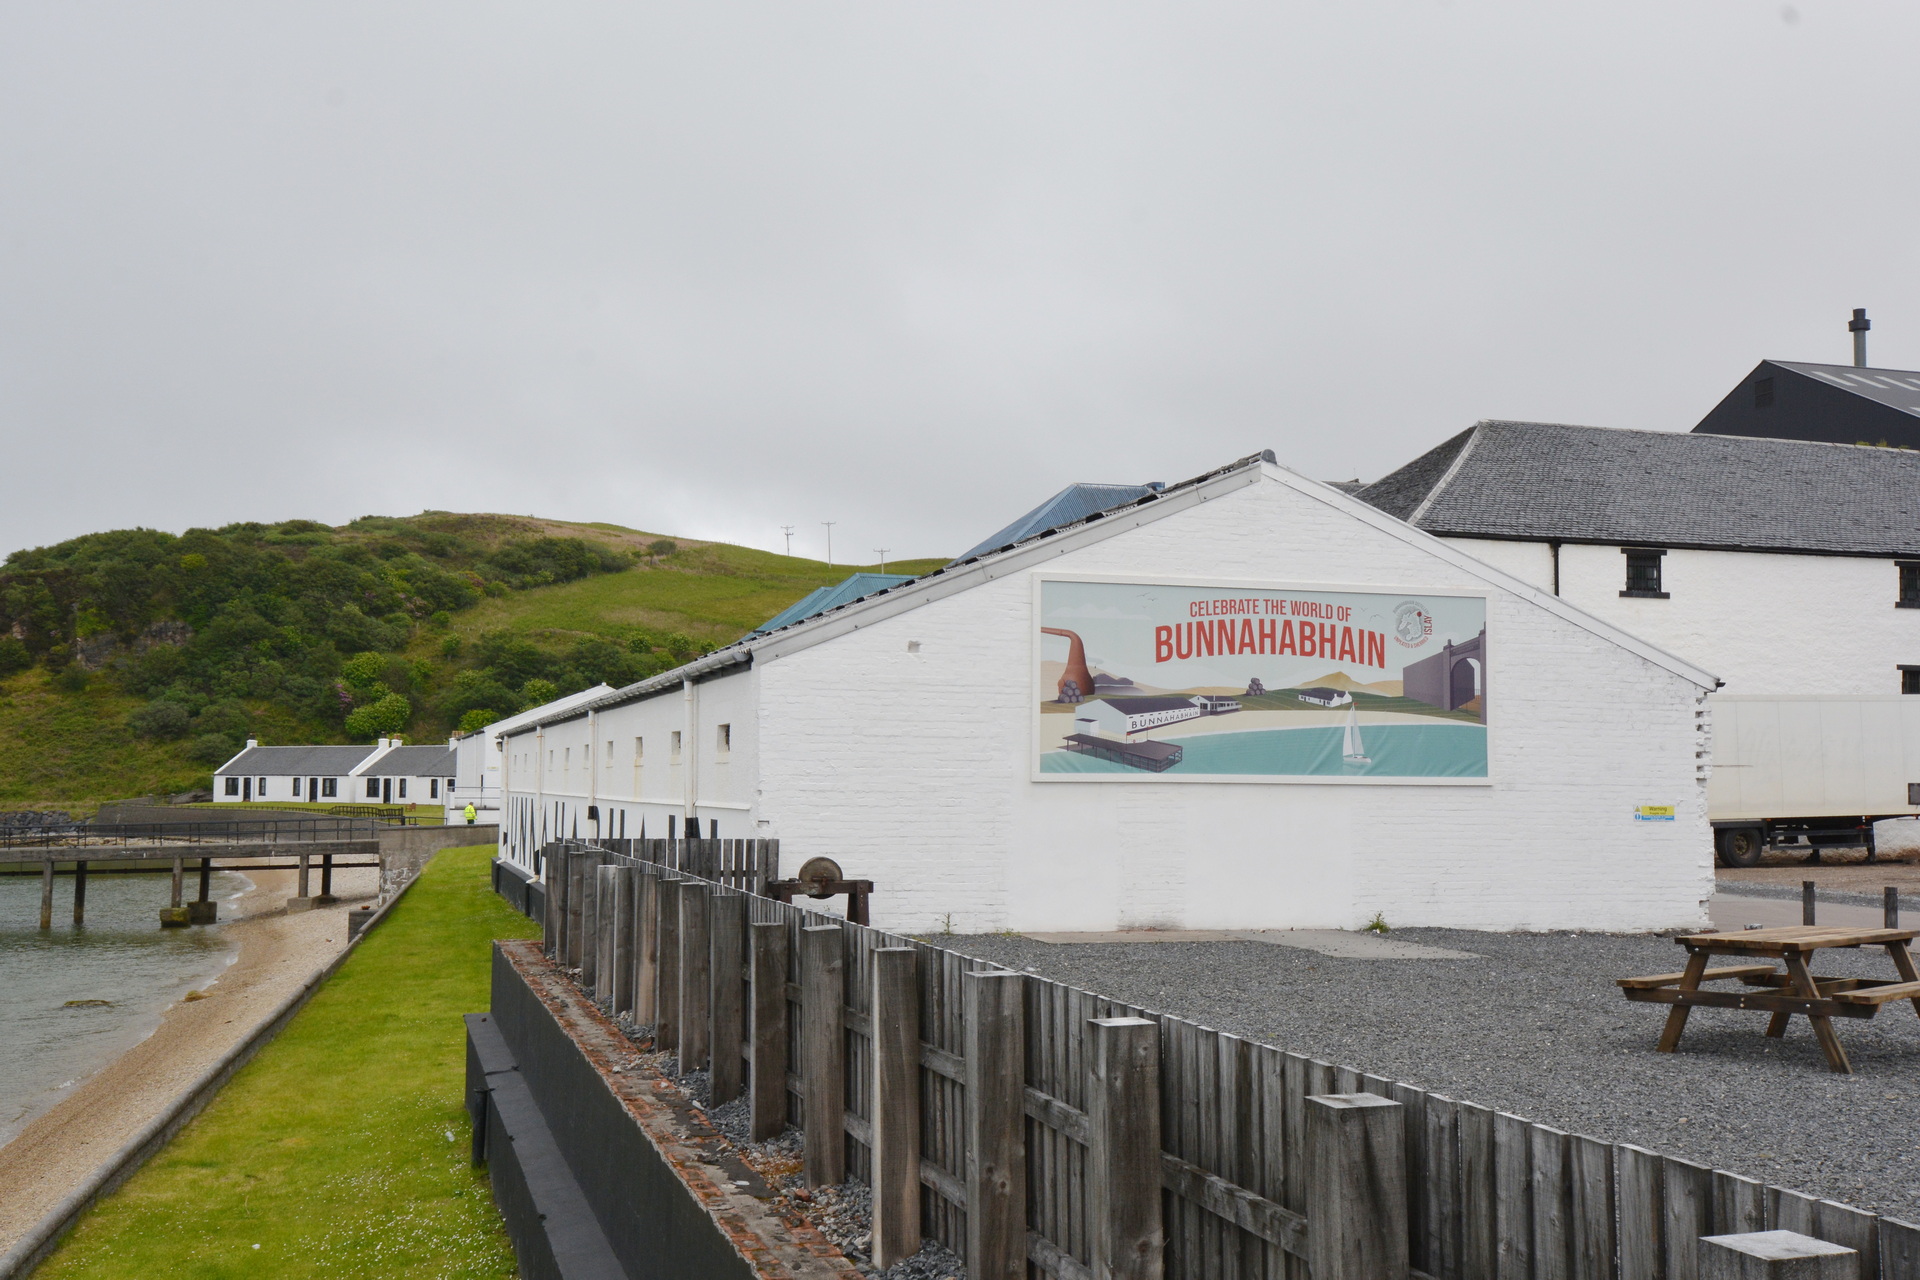
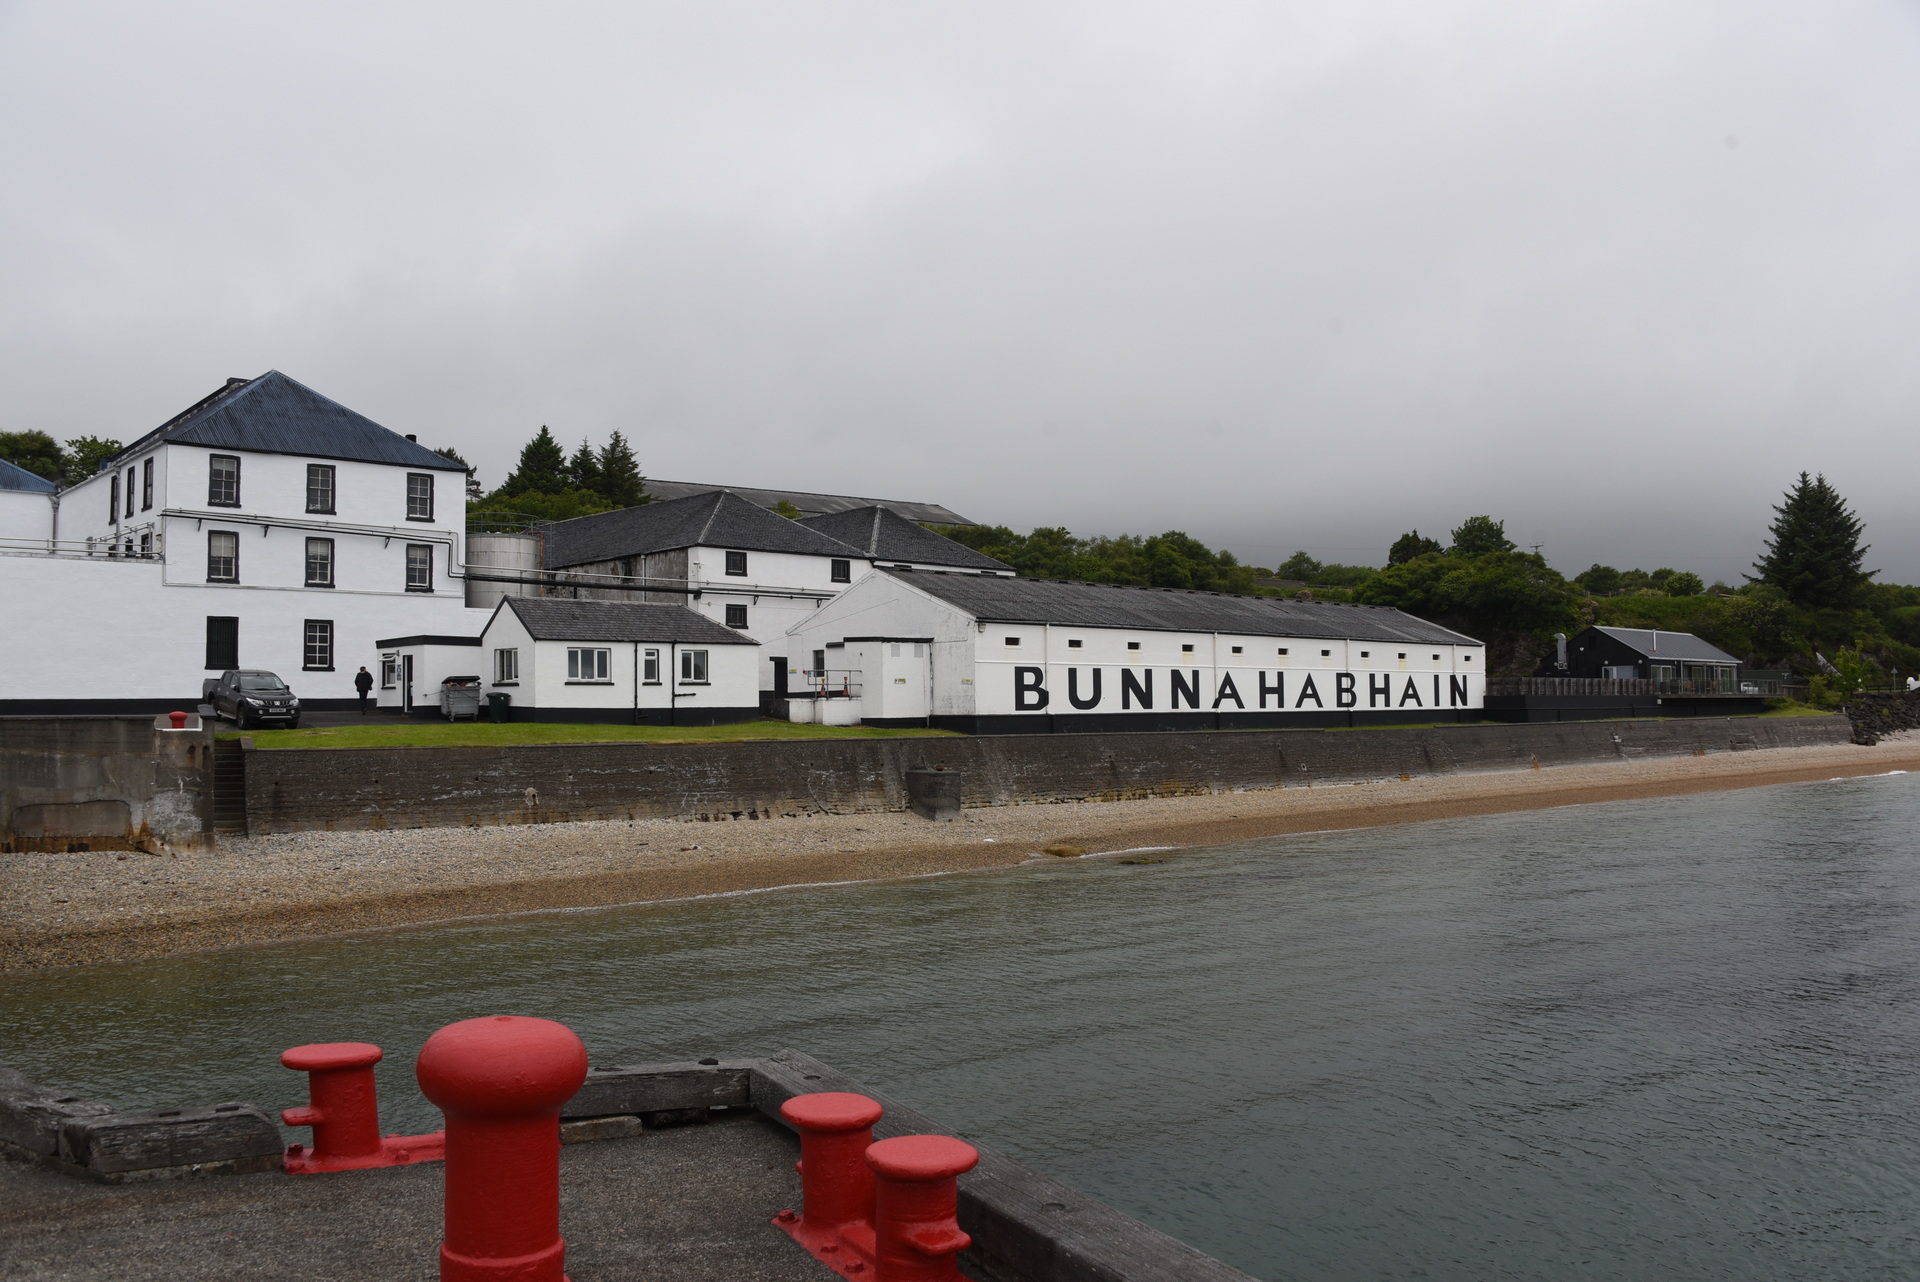
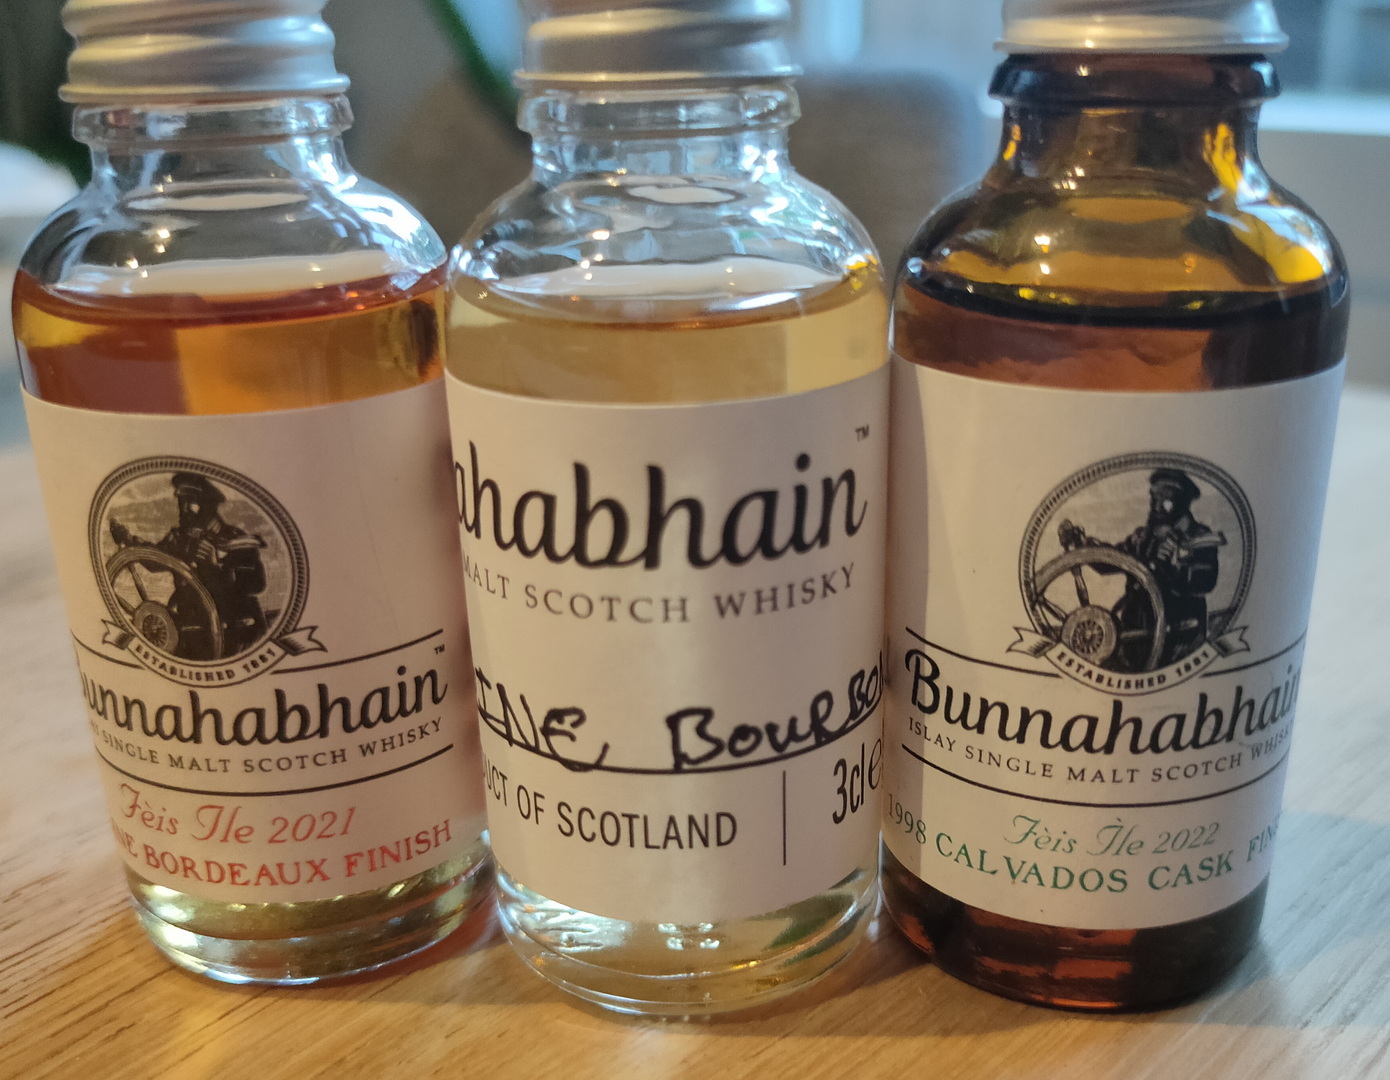
Bunnahabhain lag zo’n 2 km verderop dus we kwamen even voor 17en aan, en we konden inderdaad nog net even het shopje inlopen. We waren te laat om daar ter plekke nog een tasting te doen, maar we hebben van 3 whisky’s een 3cl tasting flesje meegenomen en nog een T-shirt gekocht. Eenmaal buiten zijn we nog even het terrein opgelopen en de pier, zodat we ook hier nog even het witte warehouse met de naam Bunnahabhain in zwarte letters konden fotograferen.
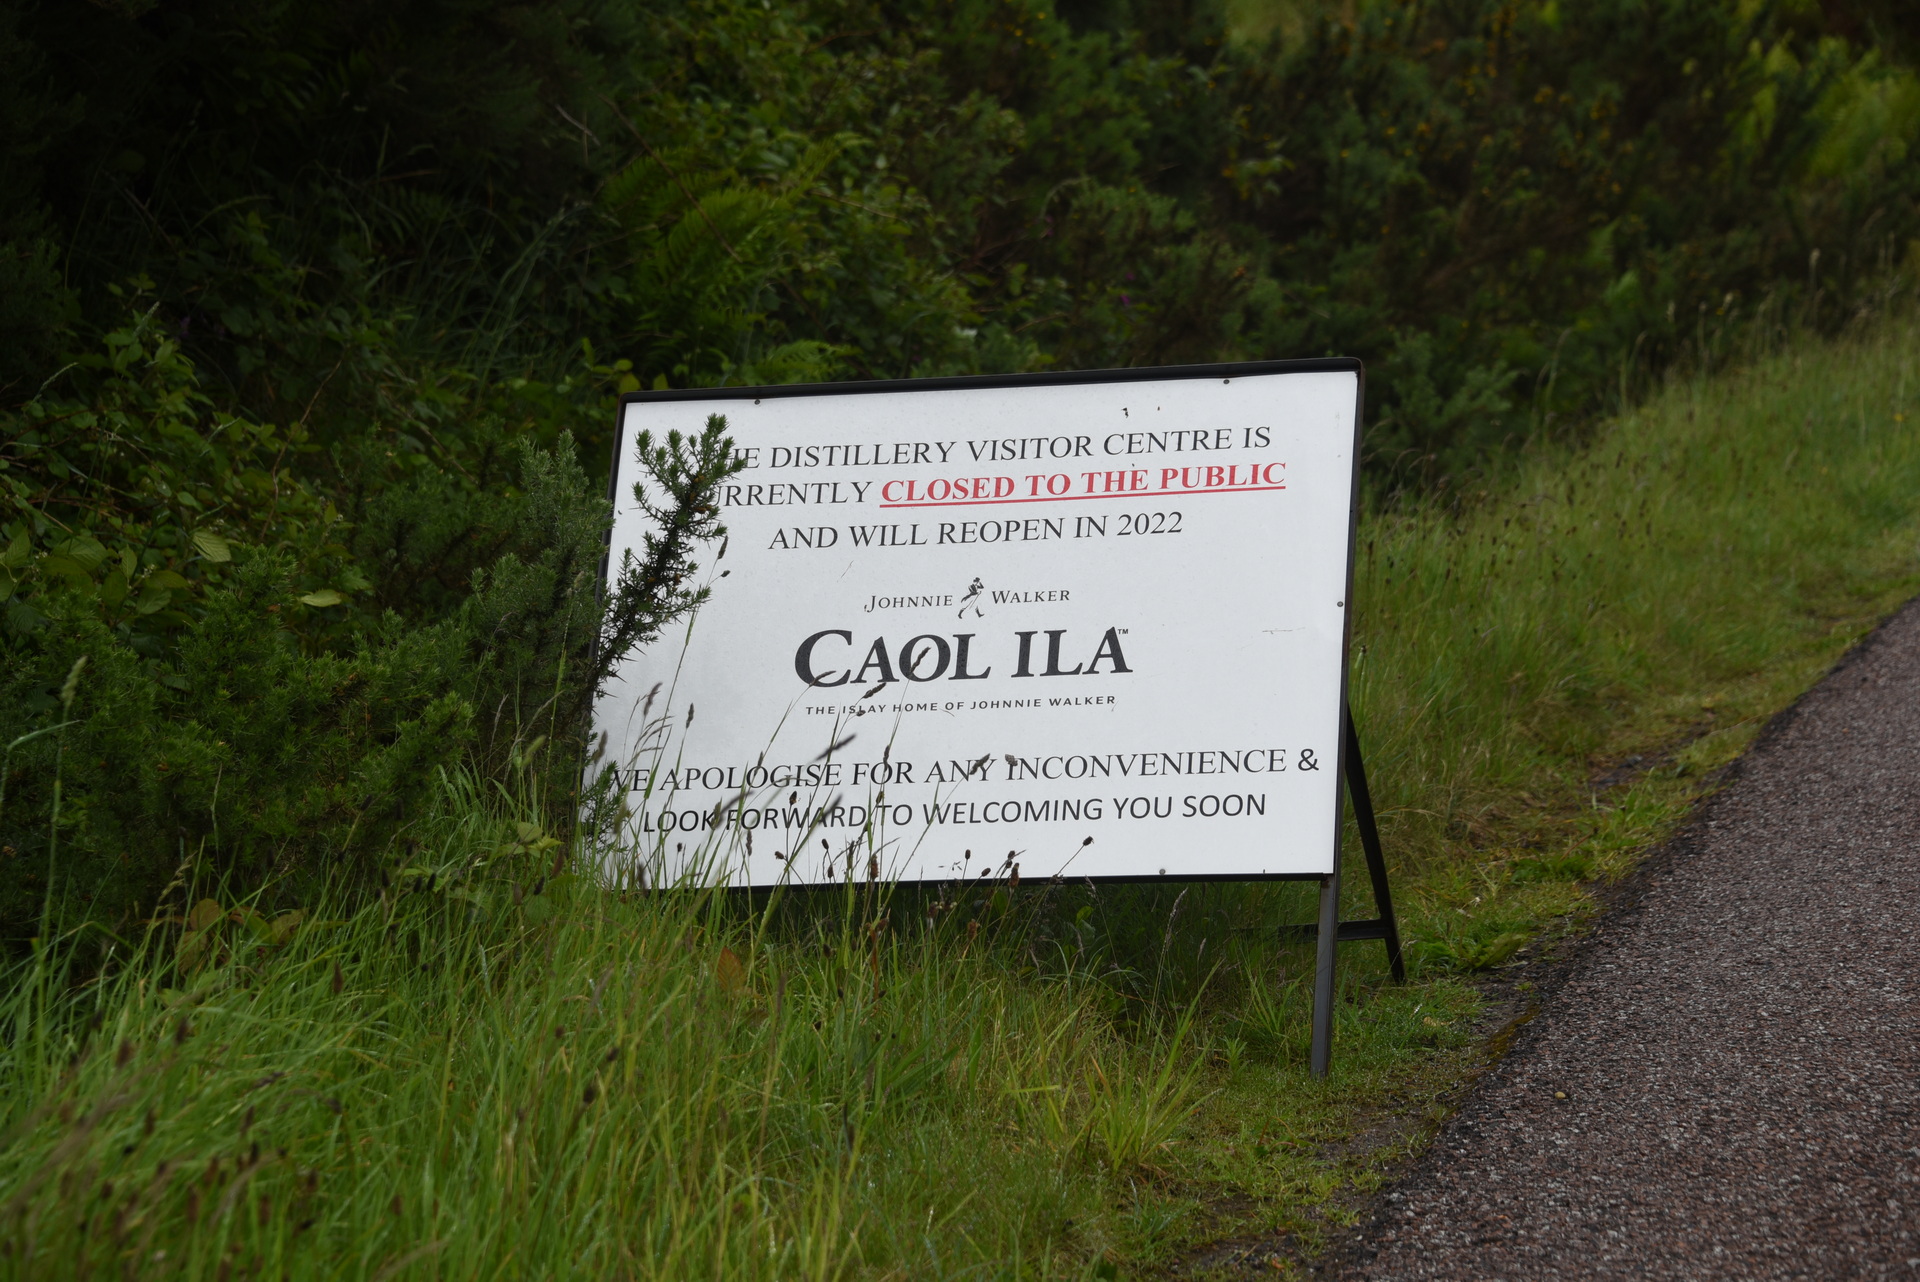
We wilden eigenlijk ook nog even langs de Caol Ila distillery rijden om ook hier een foto te maken van het witte warehouse met de naam Caol Ila in zwarte letters, maar we wisten dat deze gesloten was voor onderhoud. Maar de weg ernaartoe was ook afgesloten. We hebben het geprobeerd, maar de weg ernaartoe lag ook echt open, dus dat ging ‘m helaas echt niet worden.
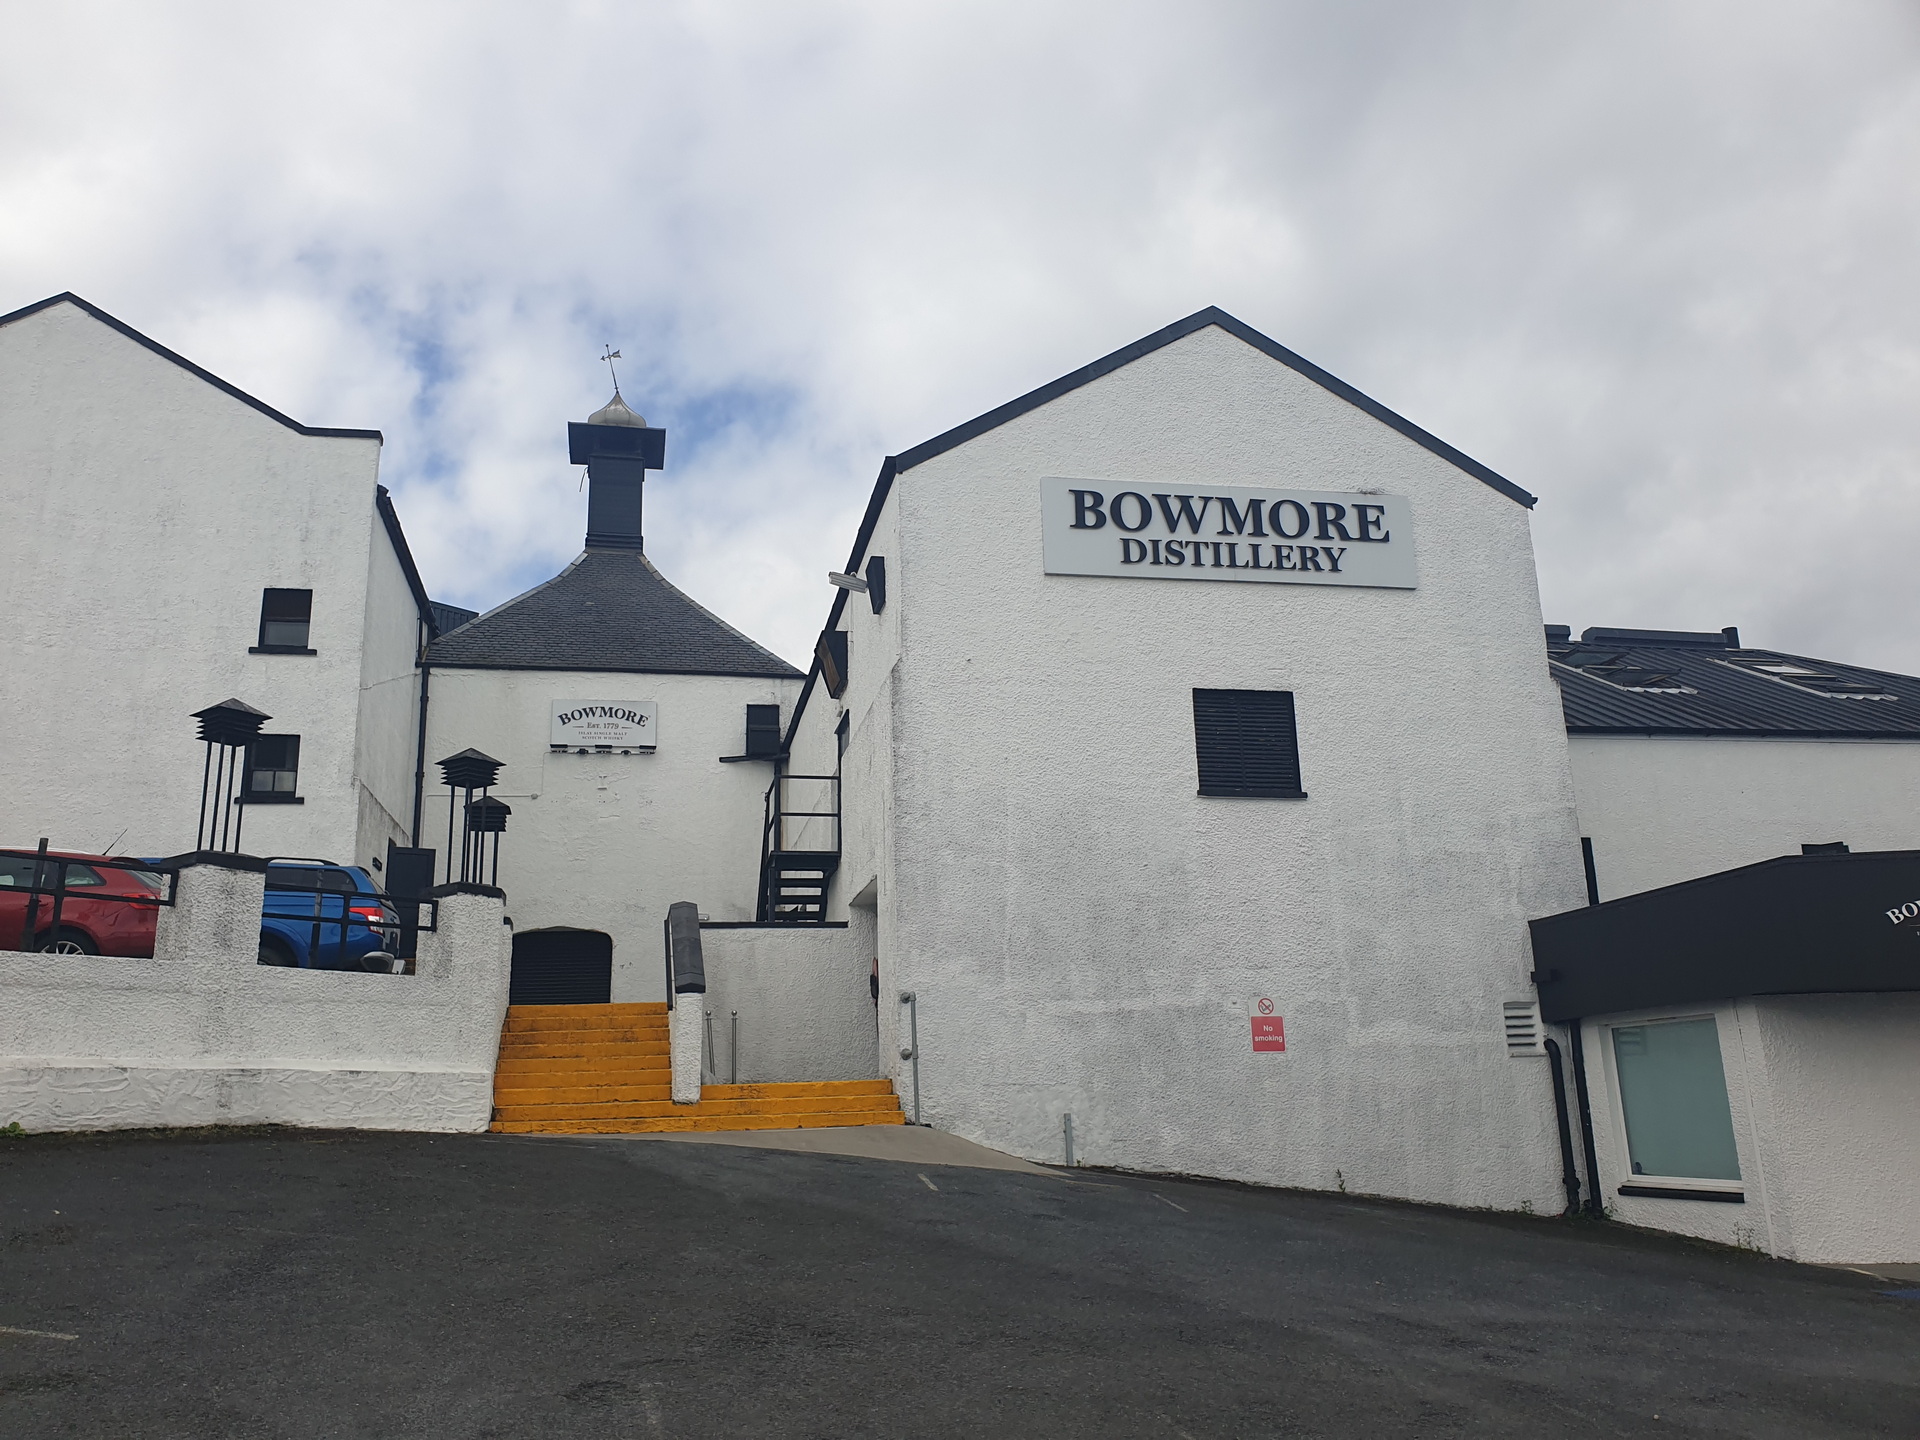
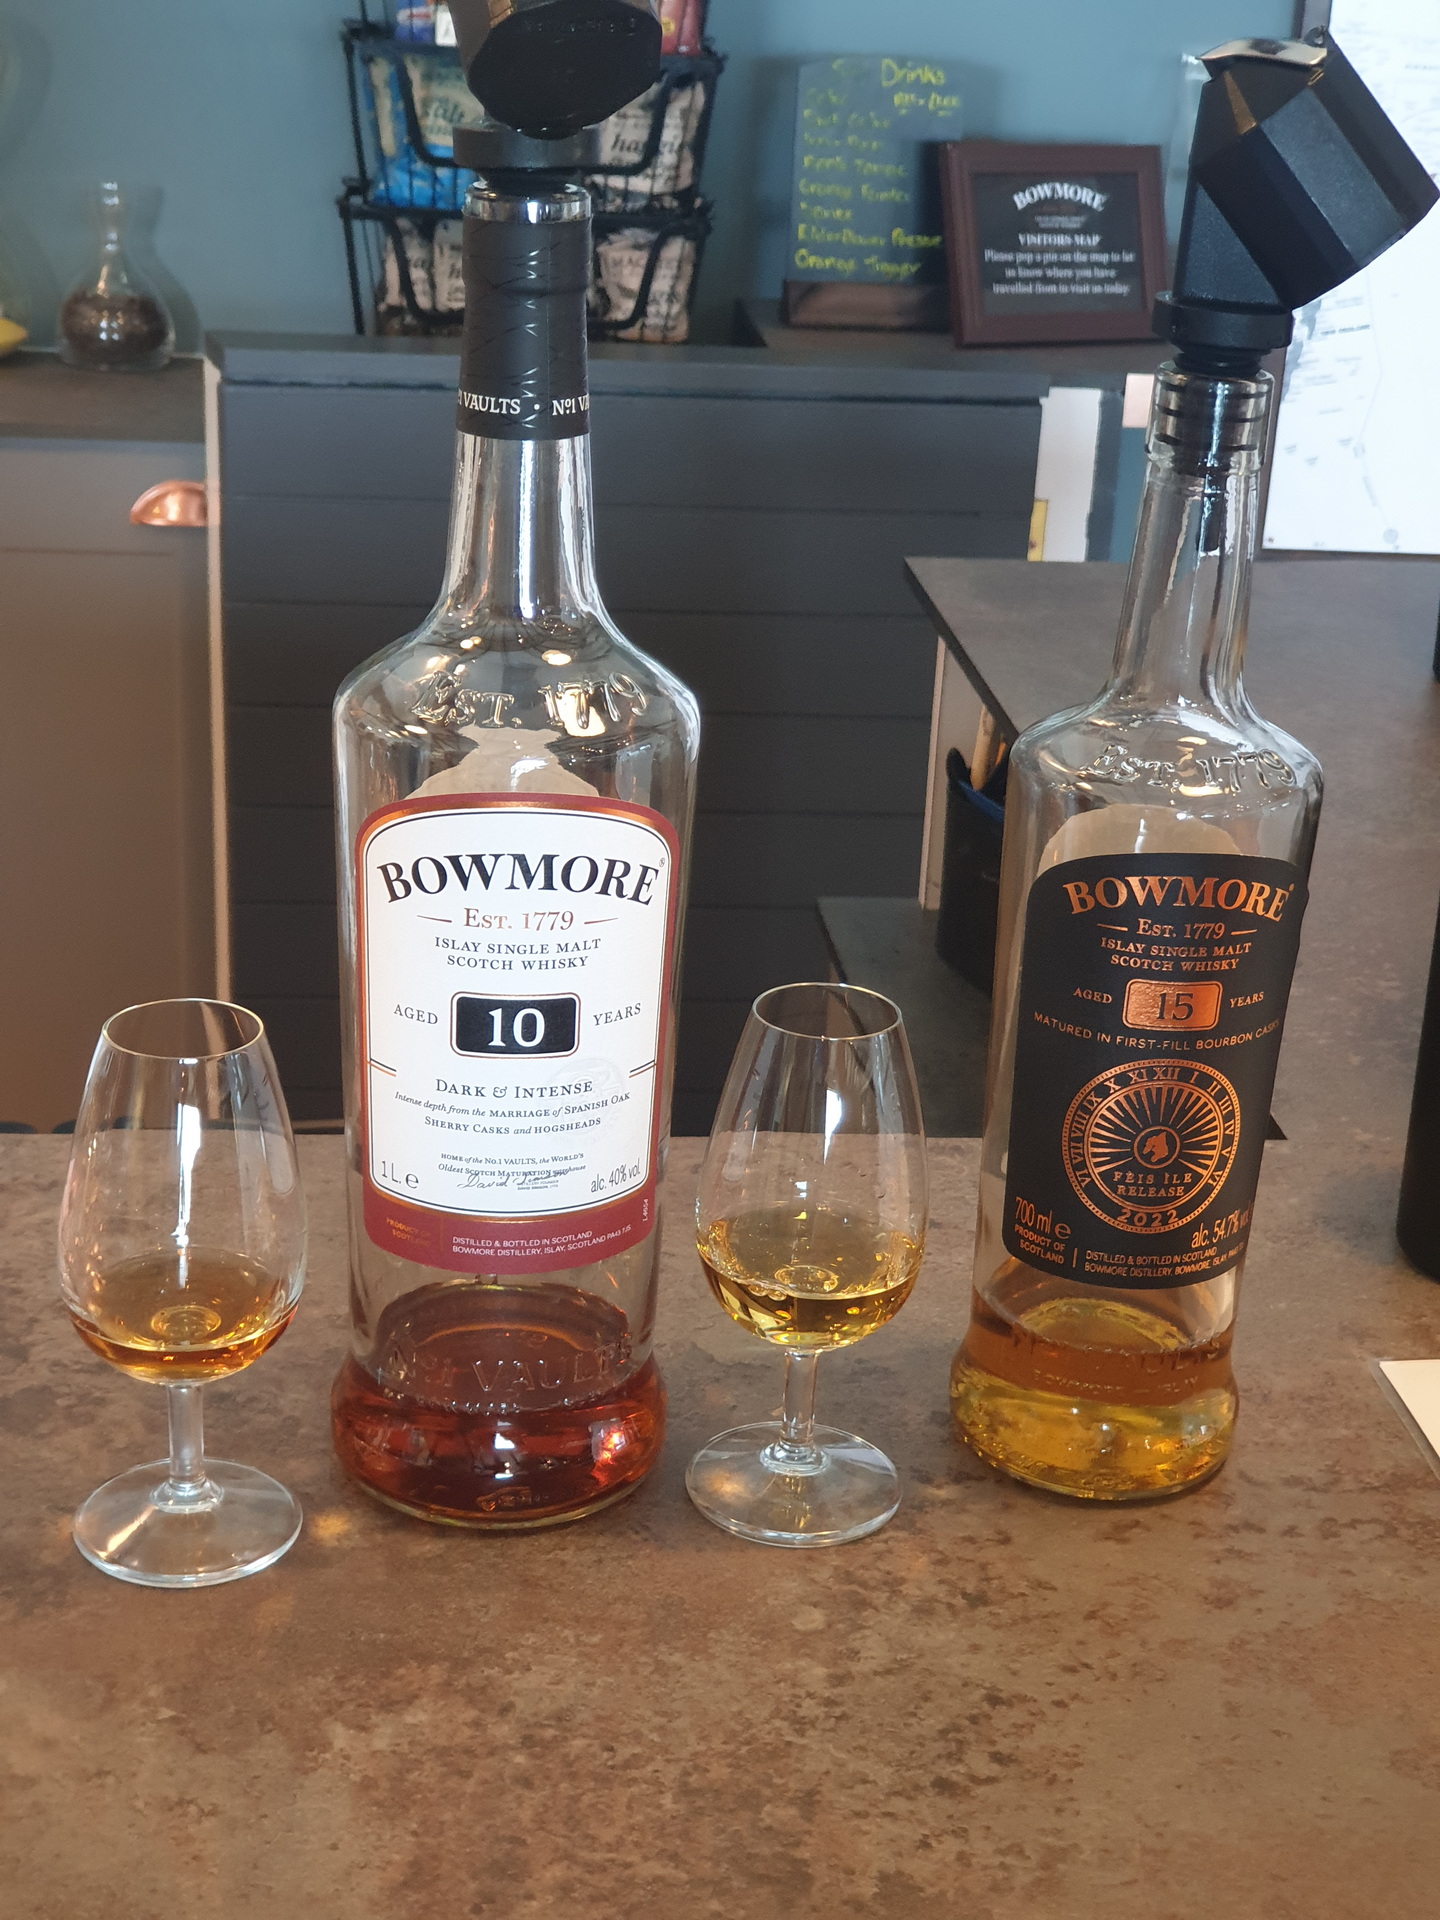
10 Juni – Bowmore, Port Ellen distillers (Isle of Islay)
Een bezoekje gebracht aan de distillery shopje, waar we ook weer een kleine tasting hebben gedaan met de 10yr old (deze was complimentary), en Henri heeft nog een dram genomen uit de fles van het Fèis ìle festival van dit jaar.
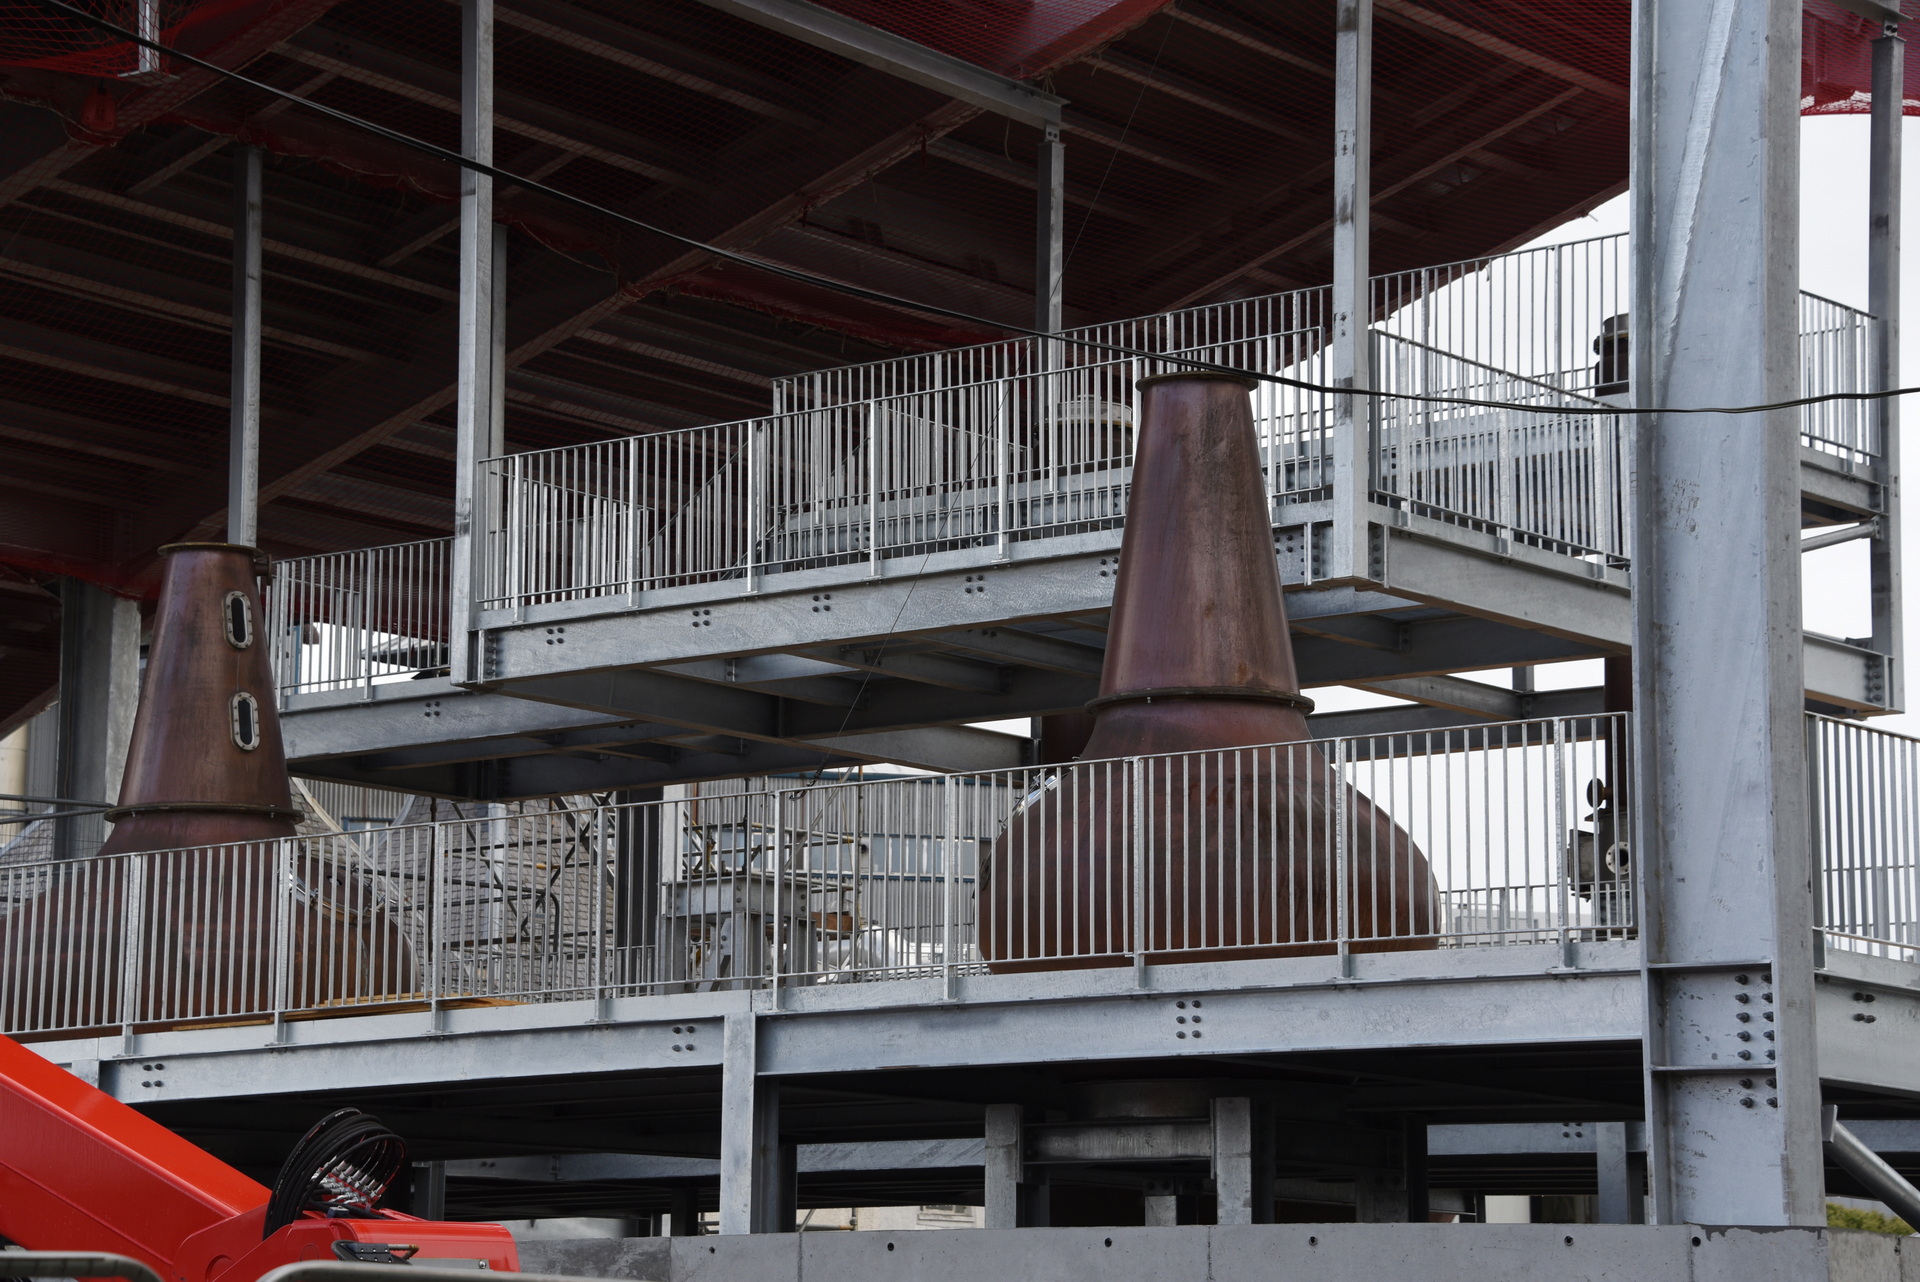
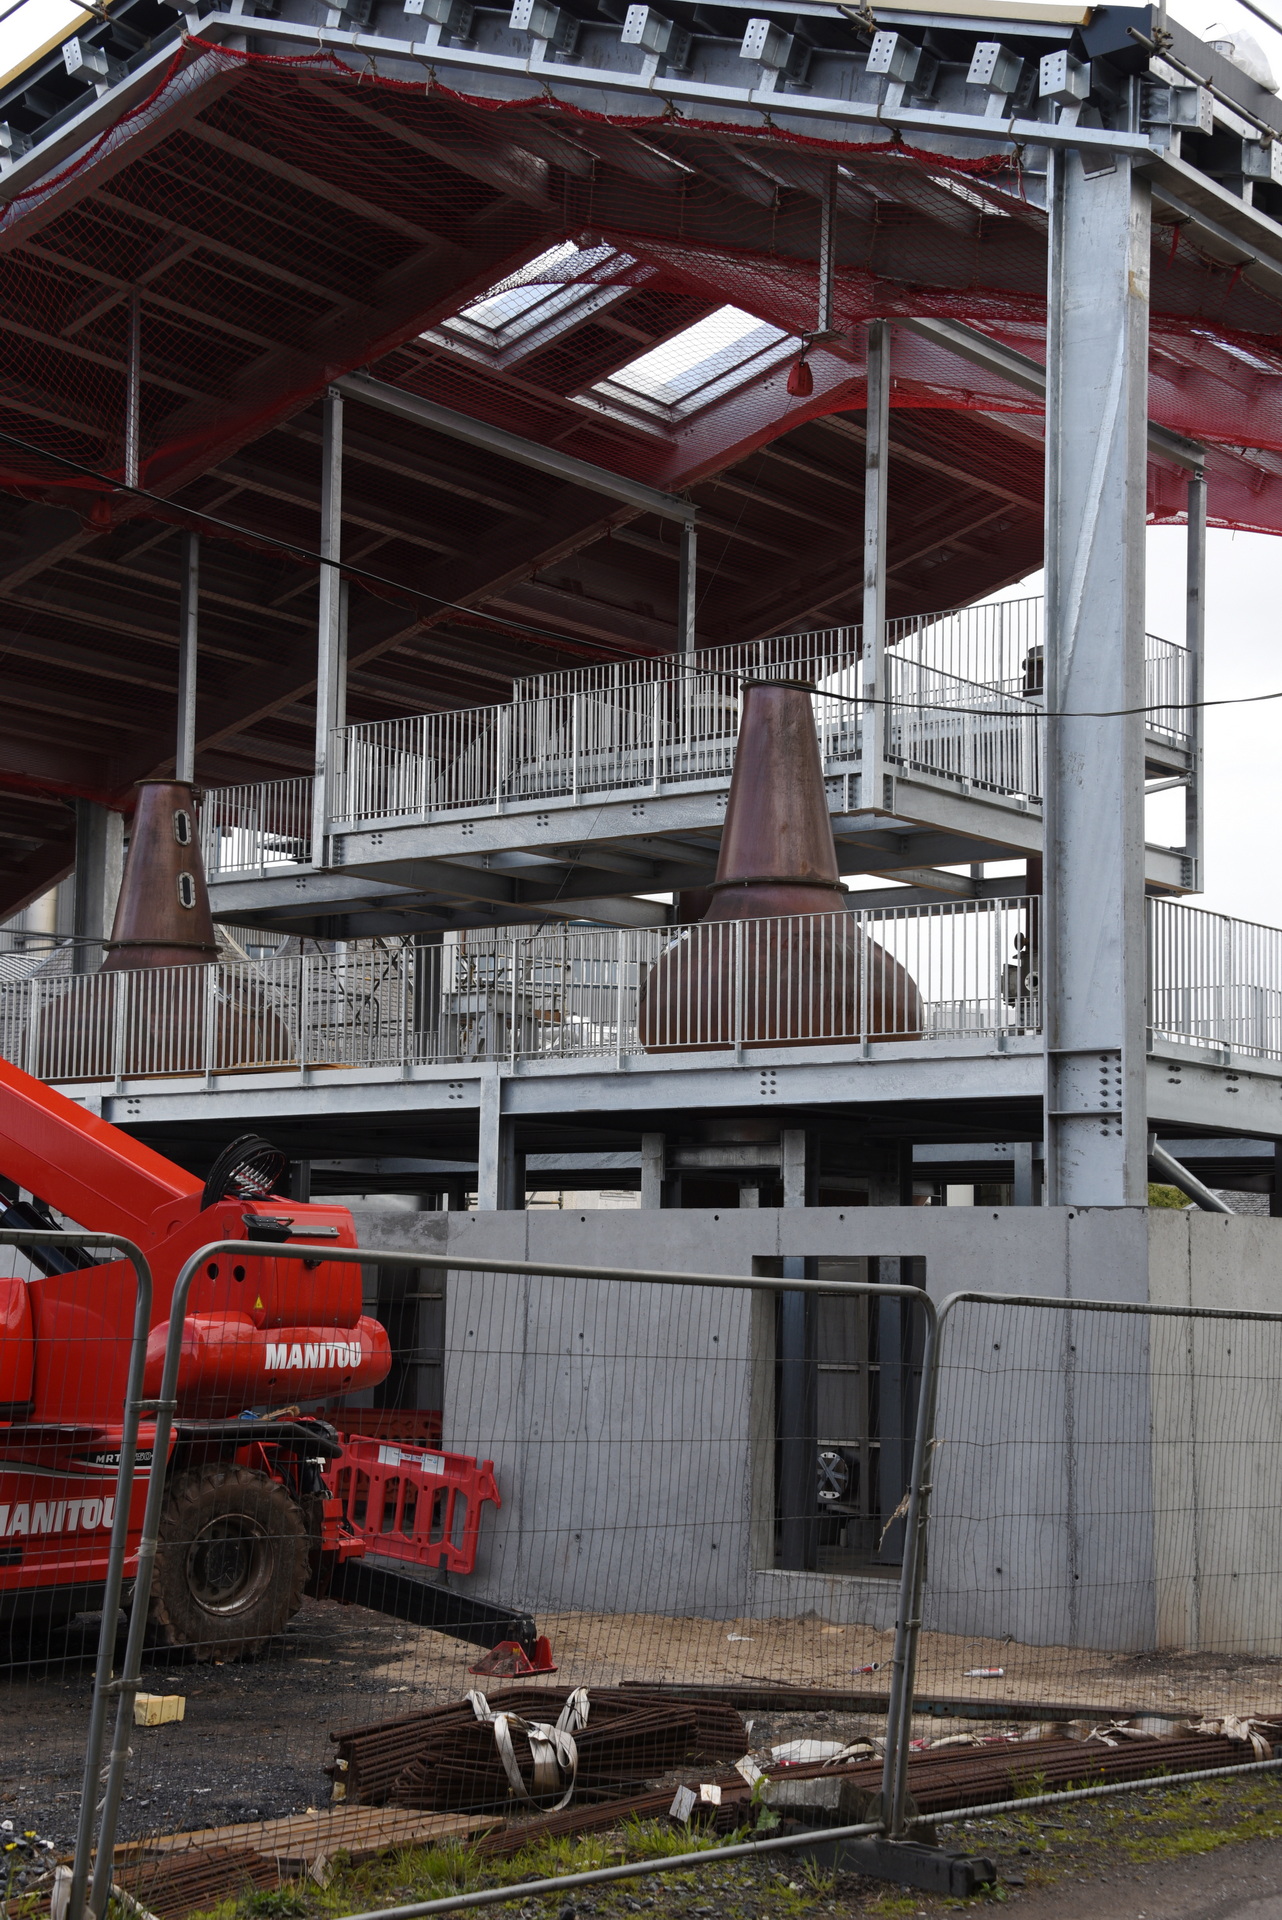
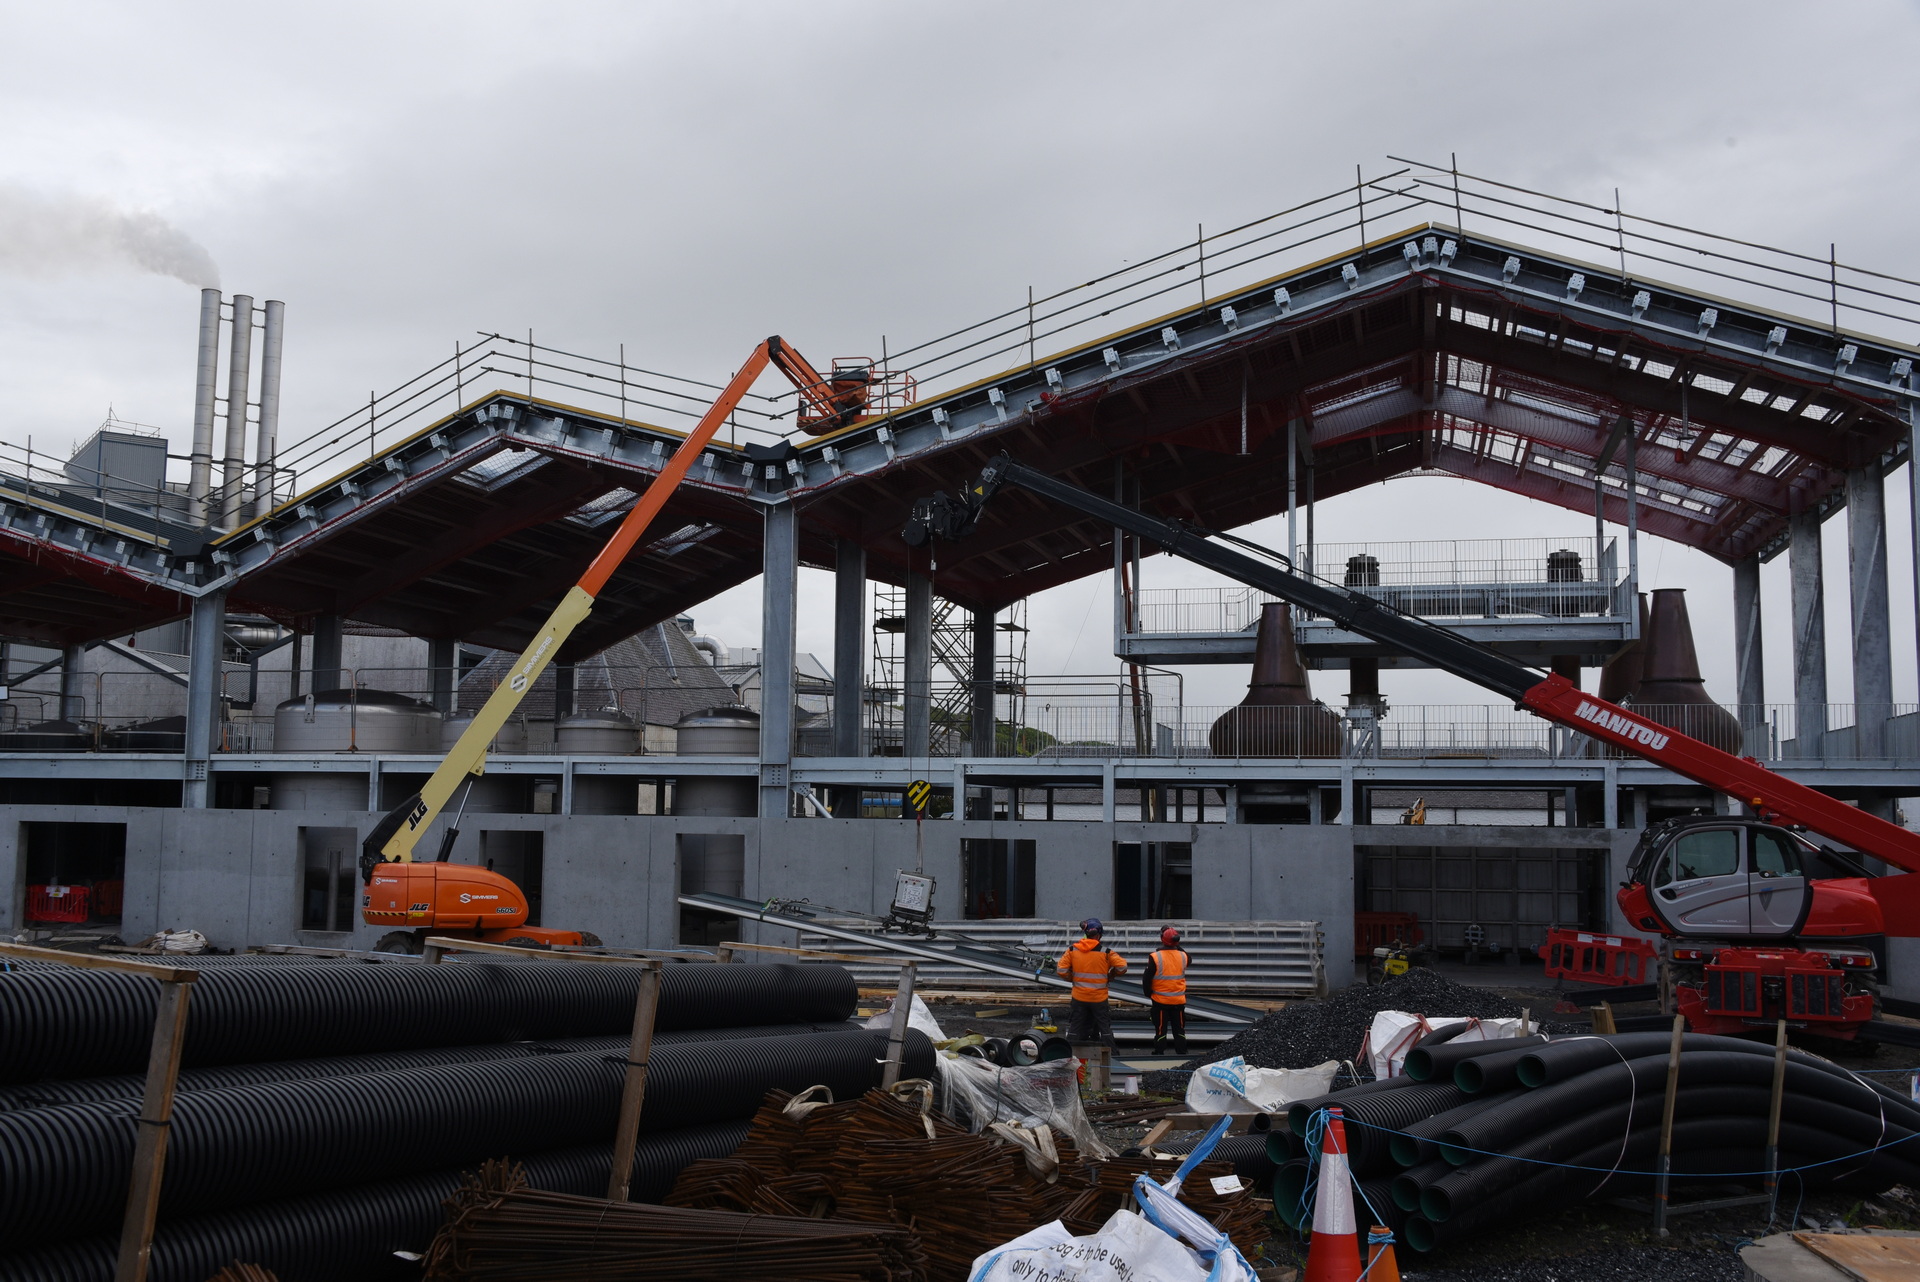
In Port Ellen zijn we nog even langs de Port Ellen distillery gereden, die ergens dit jaar ook weer heropend zou moeten worden. Maar toen we er langs reden was het duidelijk dat ze nog vol in de bouw fase zitten. Het frame stond, de tanks en de stills stonden er ook al in, maar voor de rest miste er nog veel. Wel leuk om zo te zien!
Vanaf de boot hadden we nog een mooi uitzicht op Port Ellen en de Port Ellen distillery, waardoor we ook hier het witte warehouse met de naam Port Ellen in zwarte letters hebben kunnen fotograferen
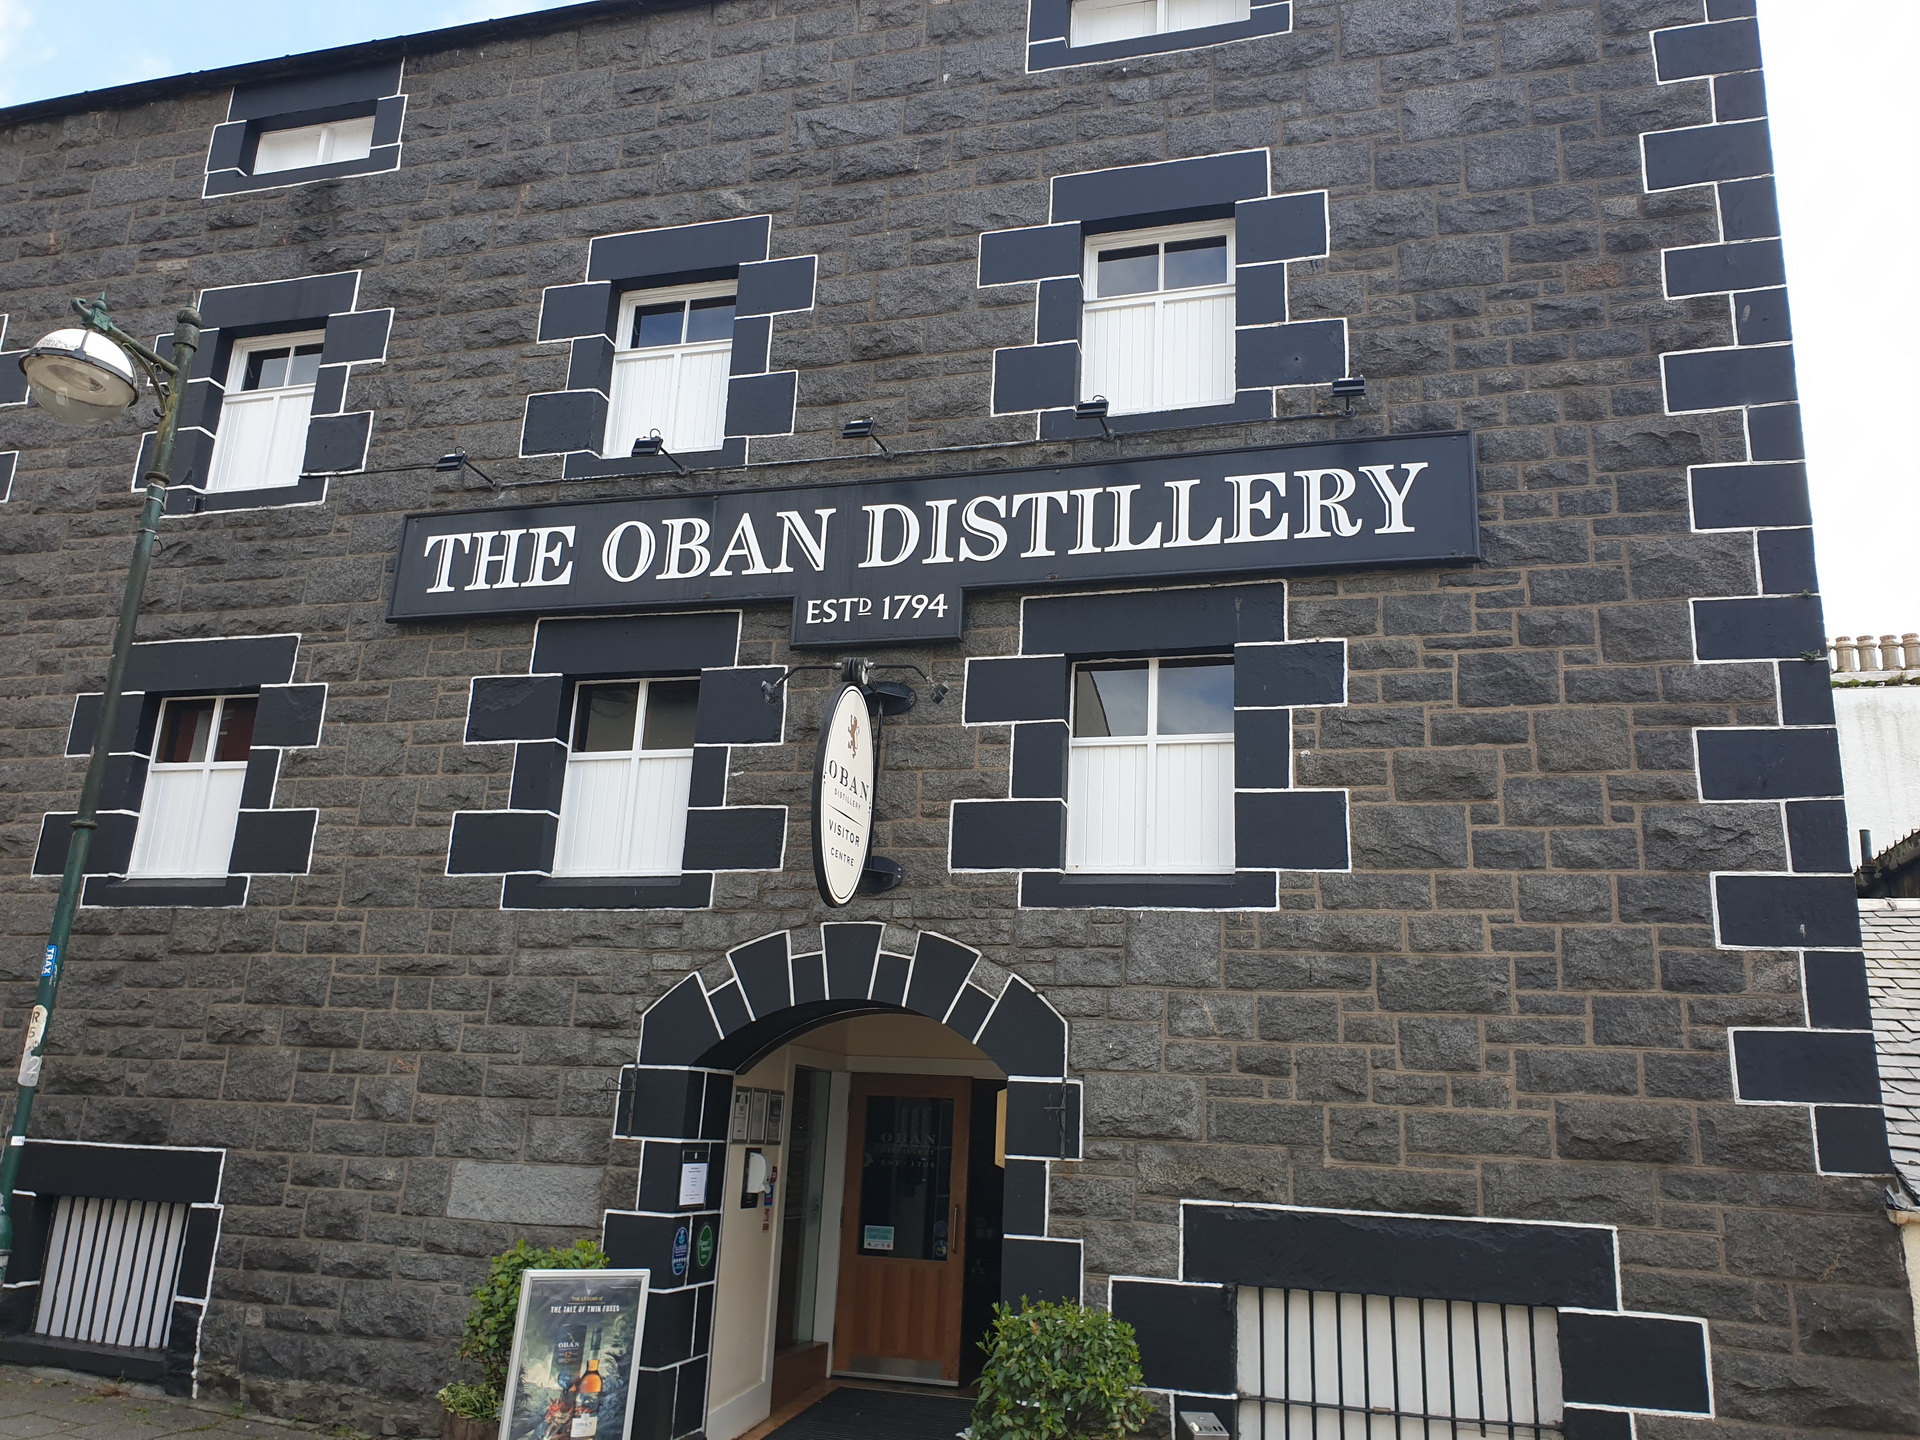
11 juni: Oban distiller (Scottish Mainland)
Vandaag de shop van de Oban distillery binnengelopen. Helaas konden we hier geen tasting doen.
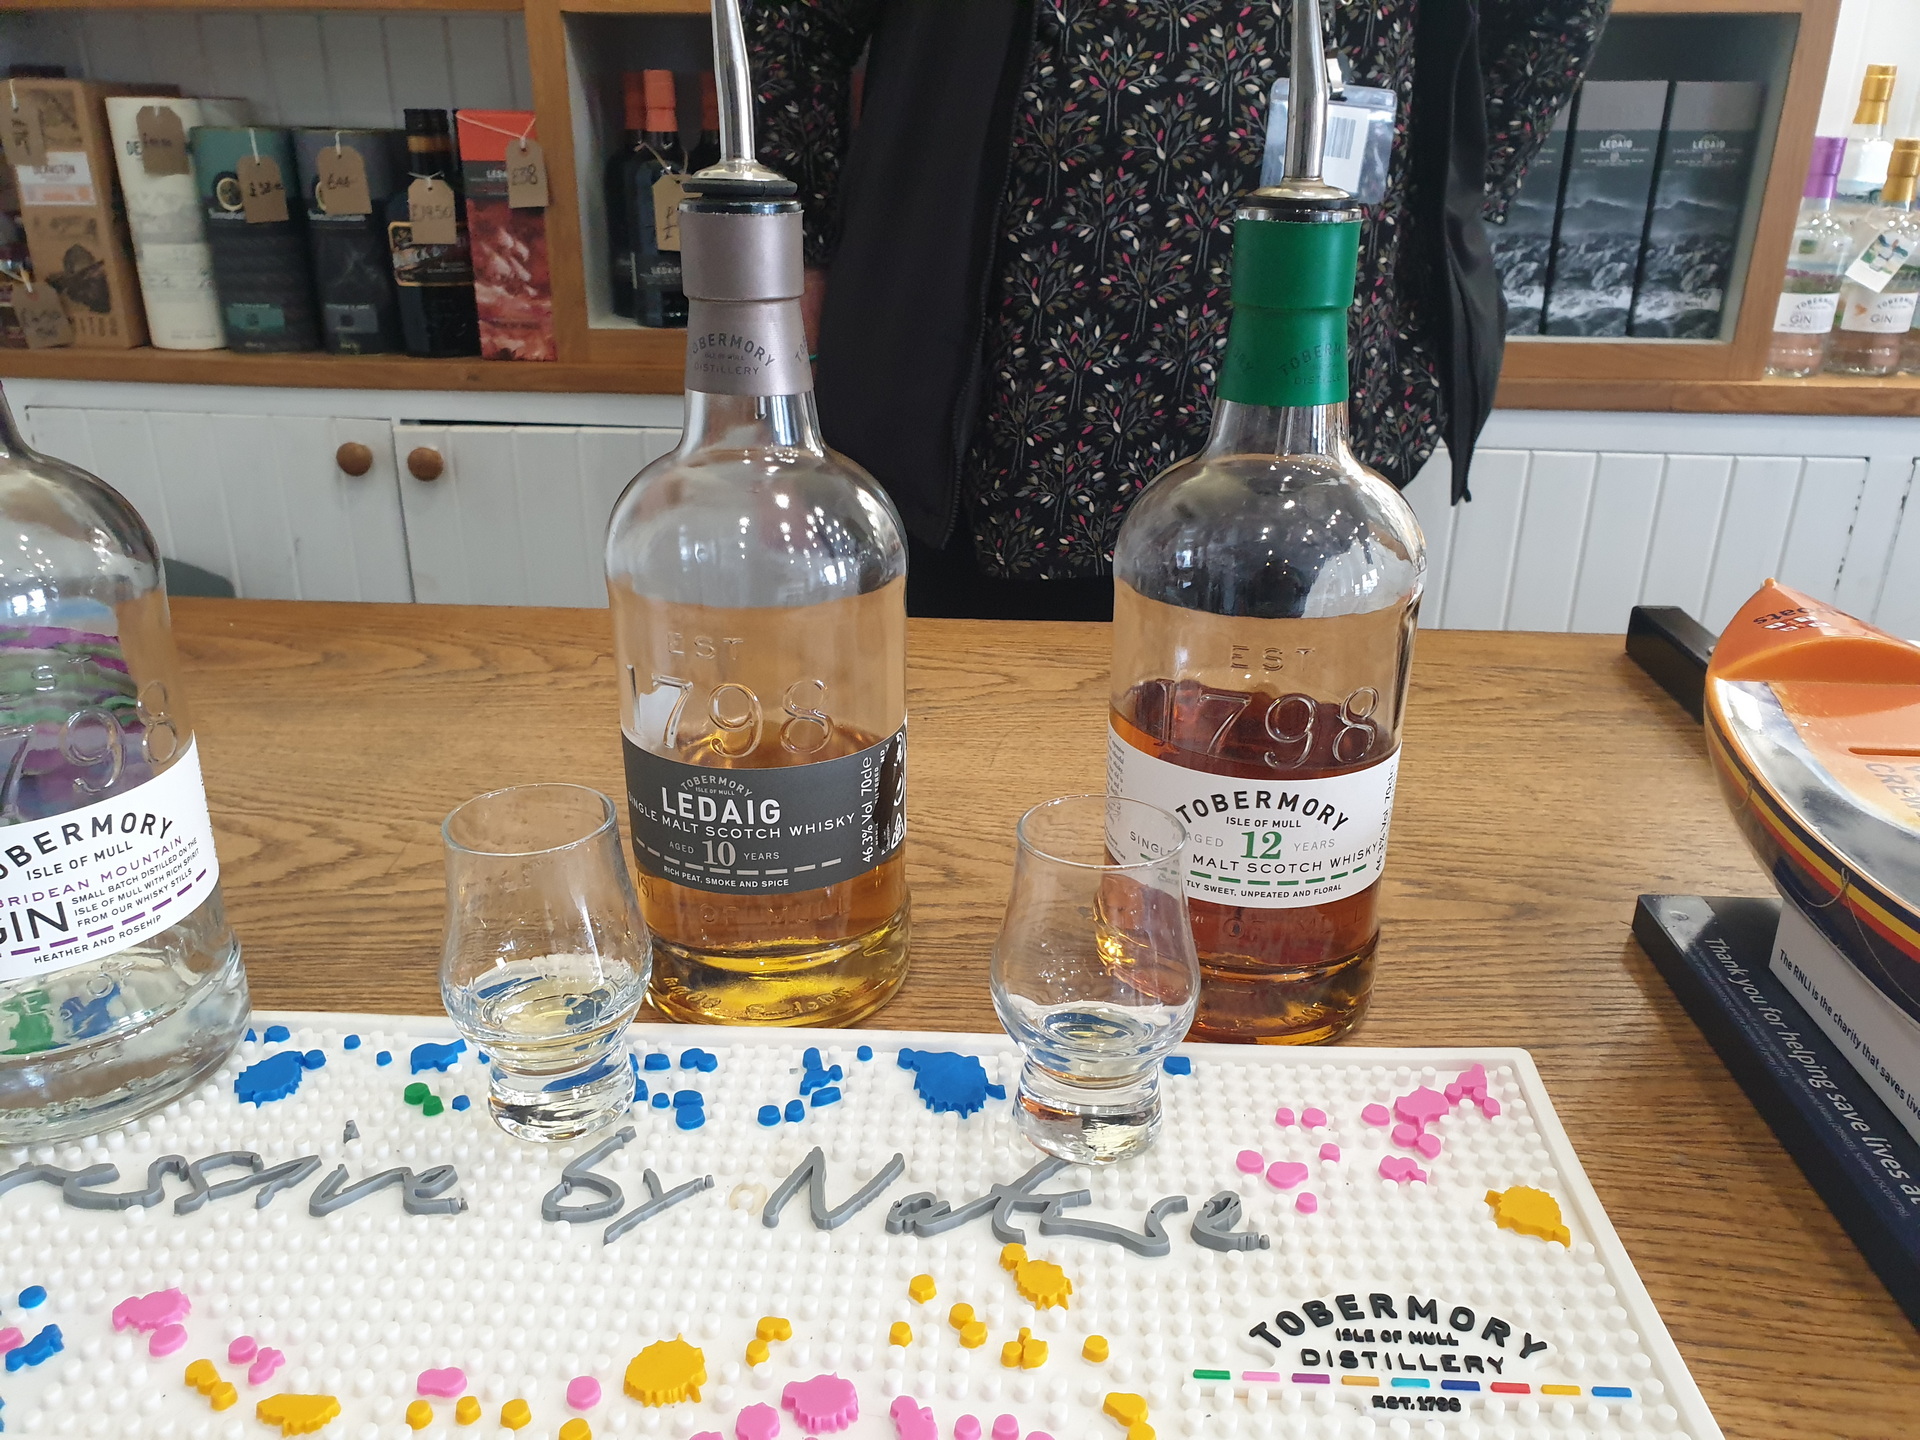
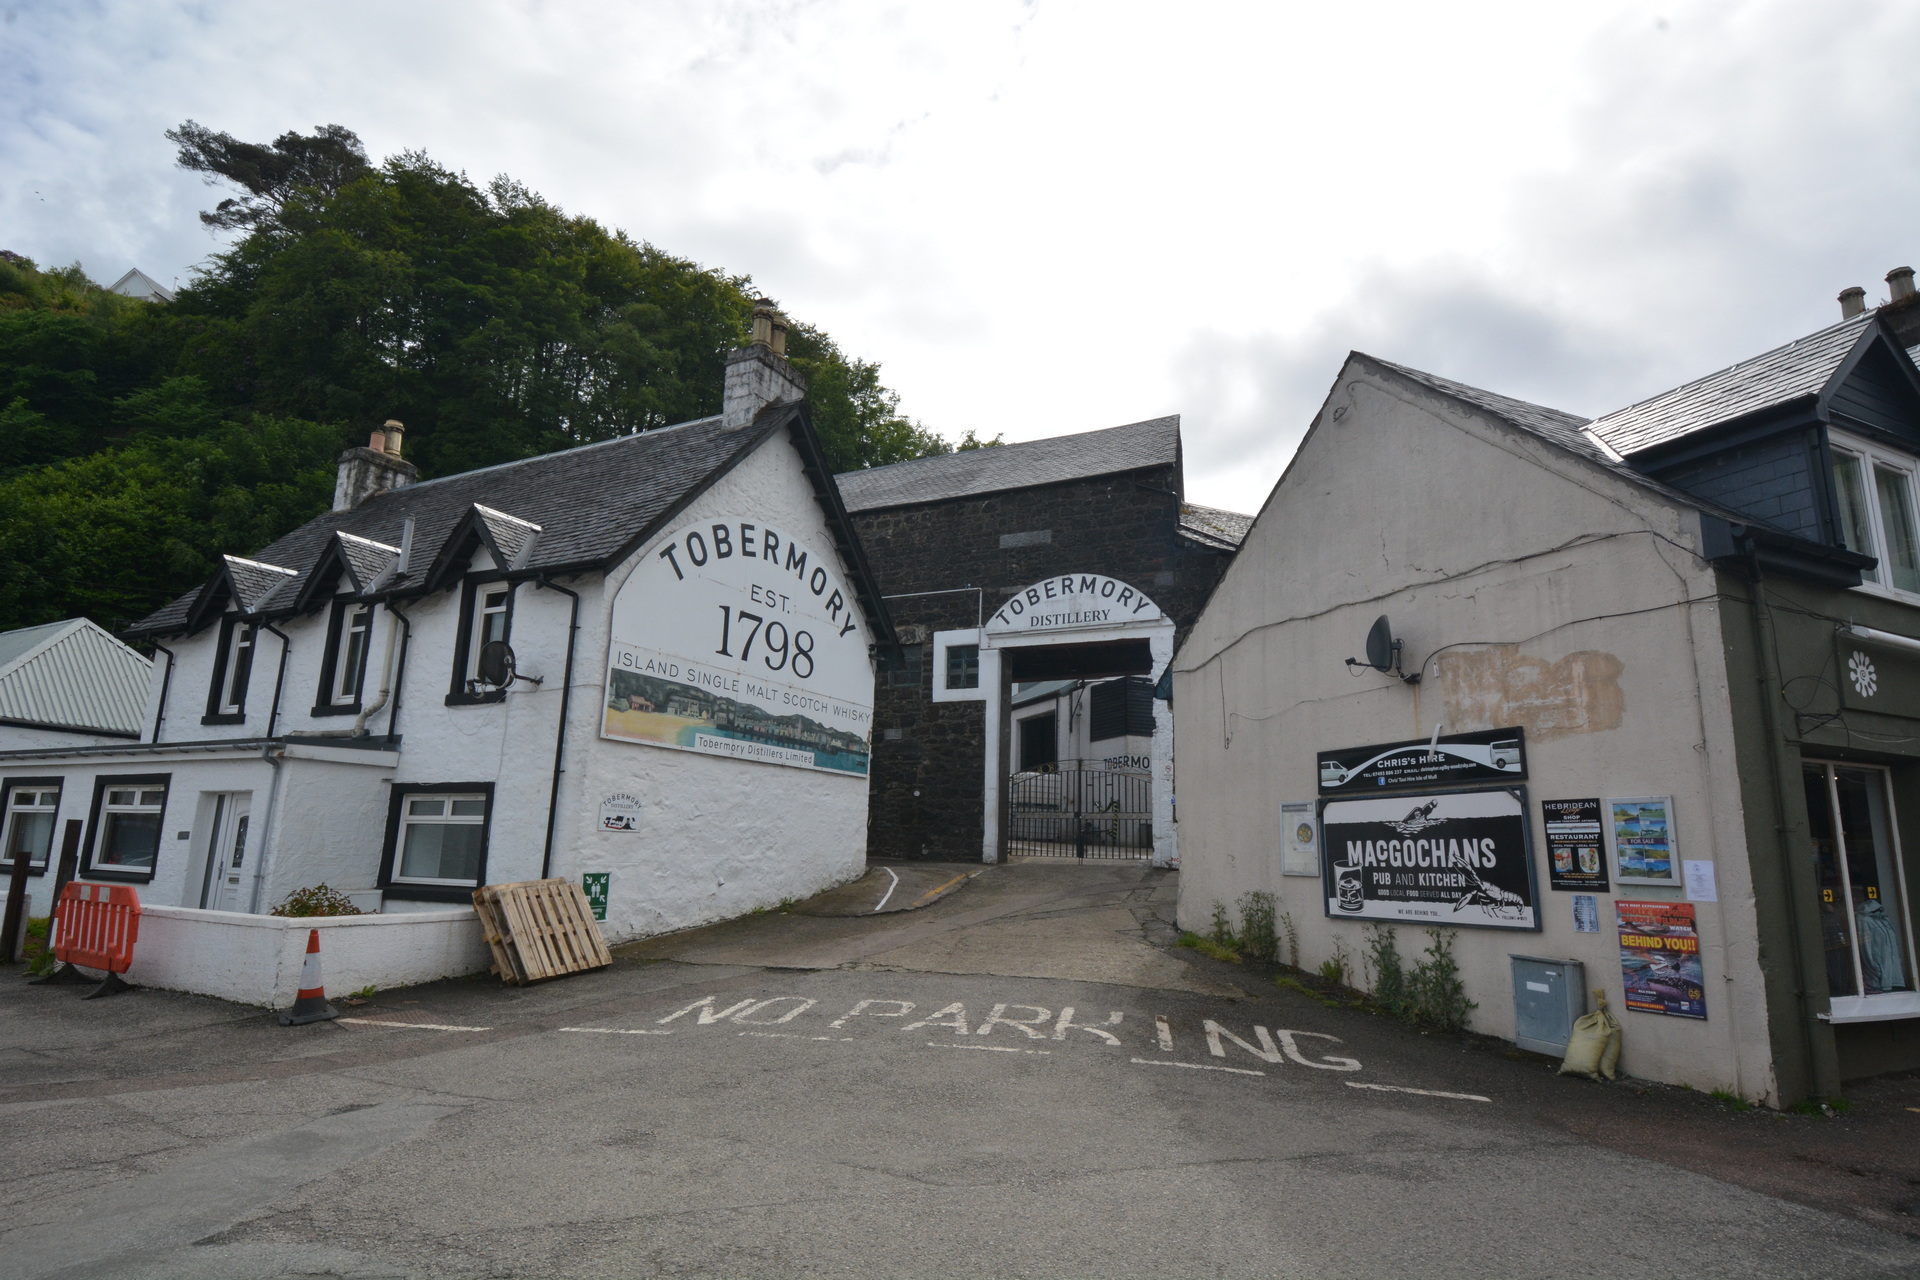
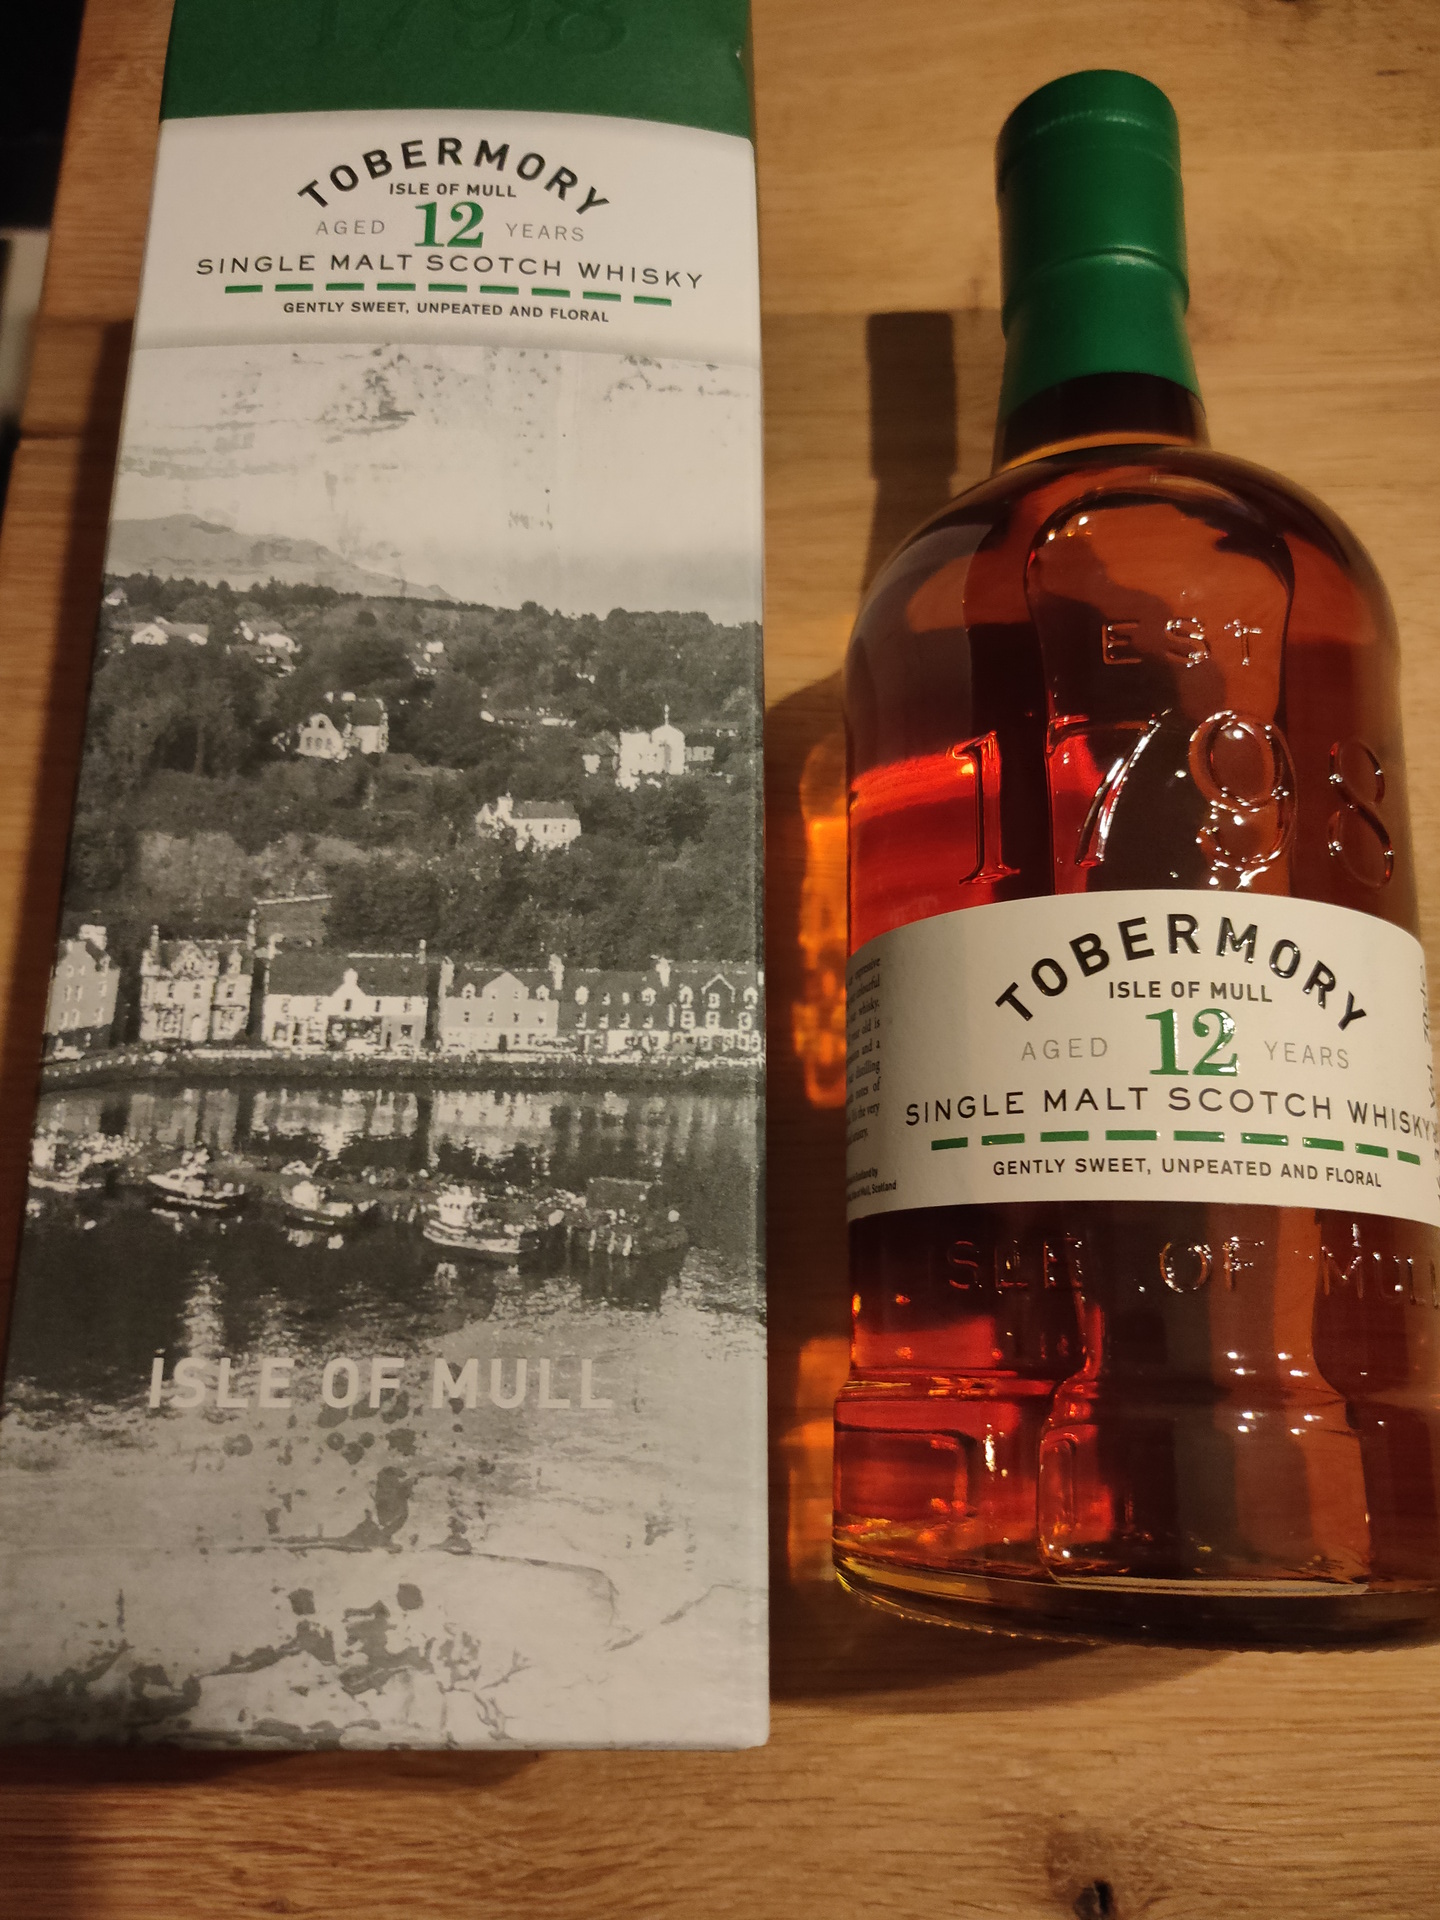
12 juni: Tobemory distiller (Isle of Mull)
In Tobermory zijn we ook nog even naar de Tobermory distillery (Ledaig => is niet uit te spreken) te gaan. Hier konden we de 2 whisky’s proeven, de 12 jaar Tobermory (is unpeated) en de 10 jaar Ledaig (is wel peated). Deze laatste hebben we thuis staan. Henri besloot om een flesje van de andere te kopen, ter vergelijk ook straks thuis.
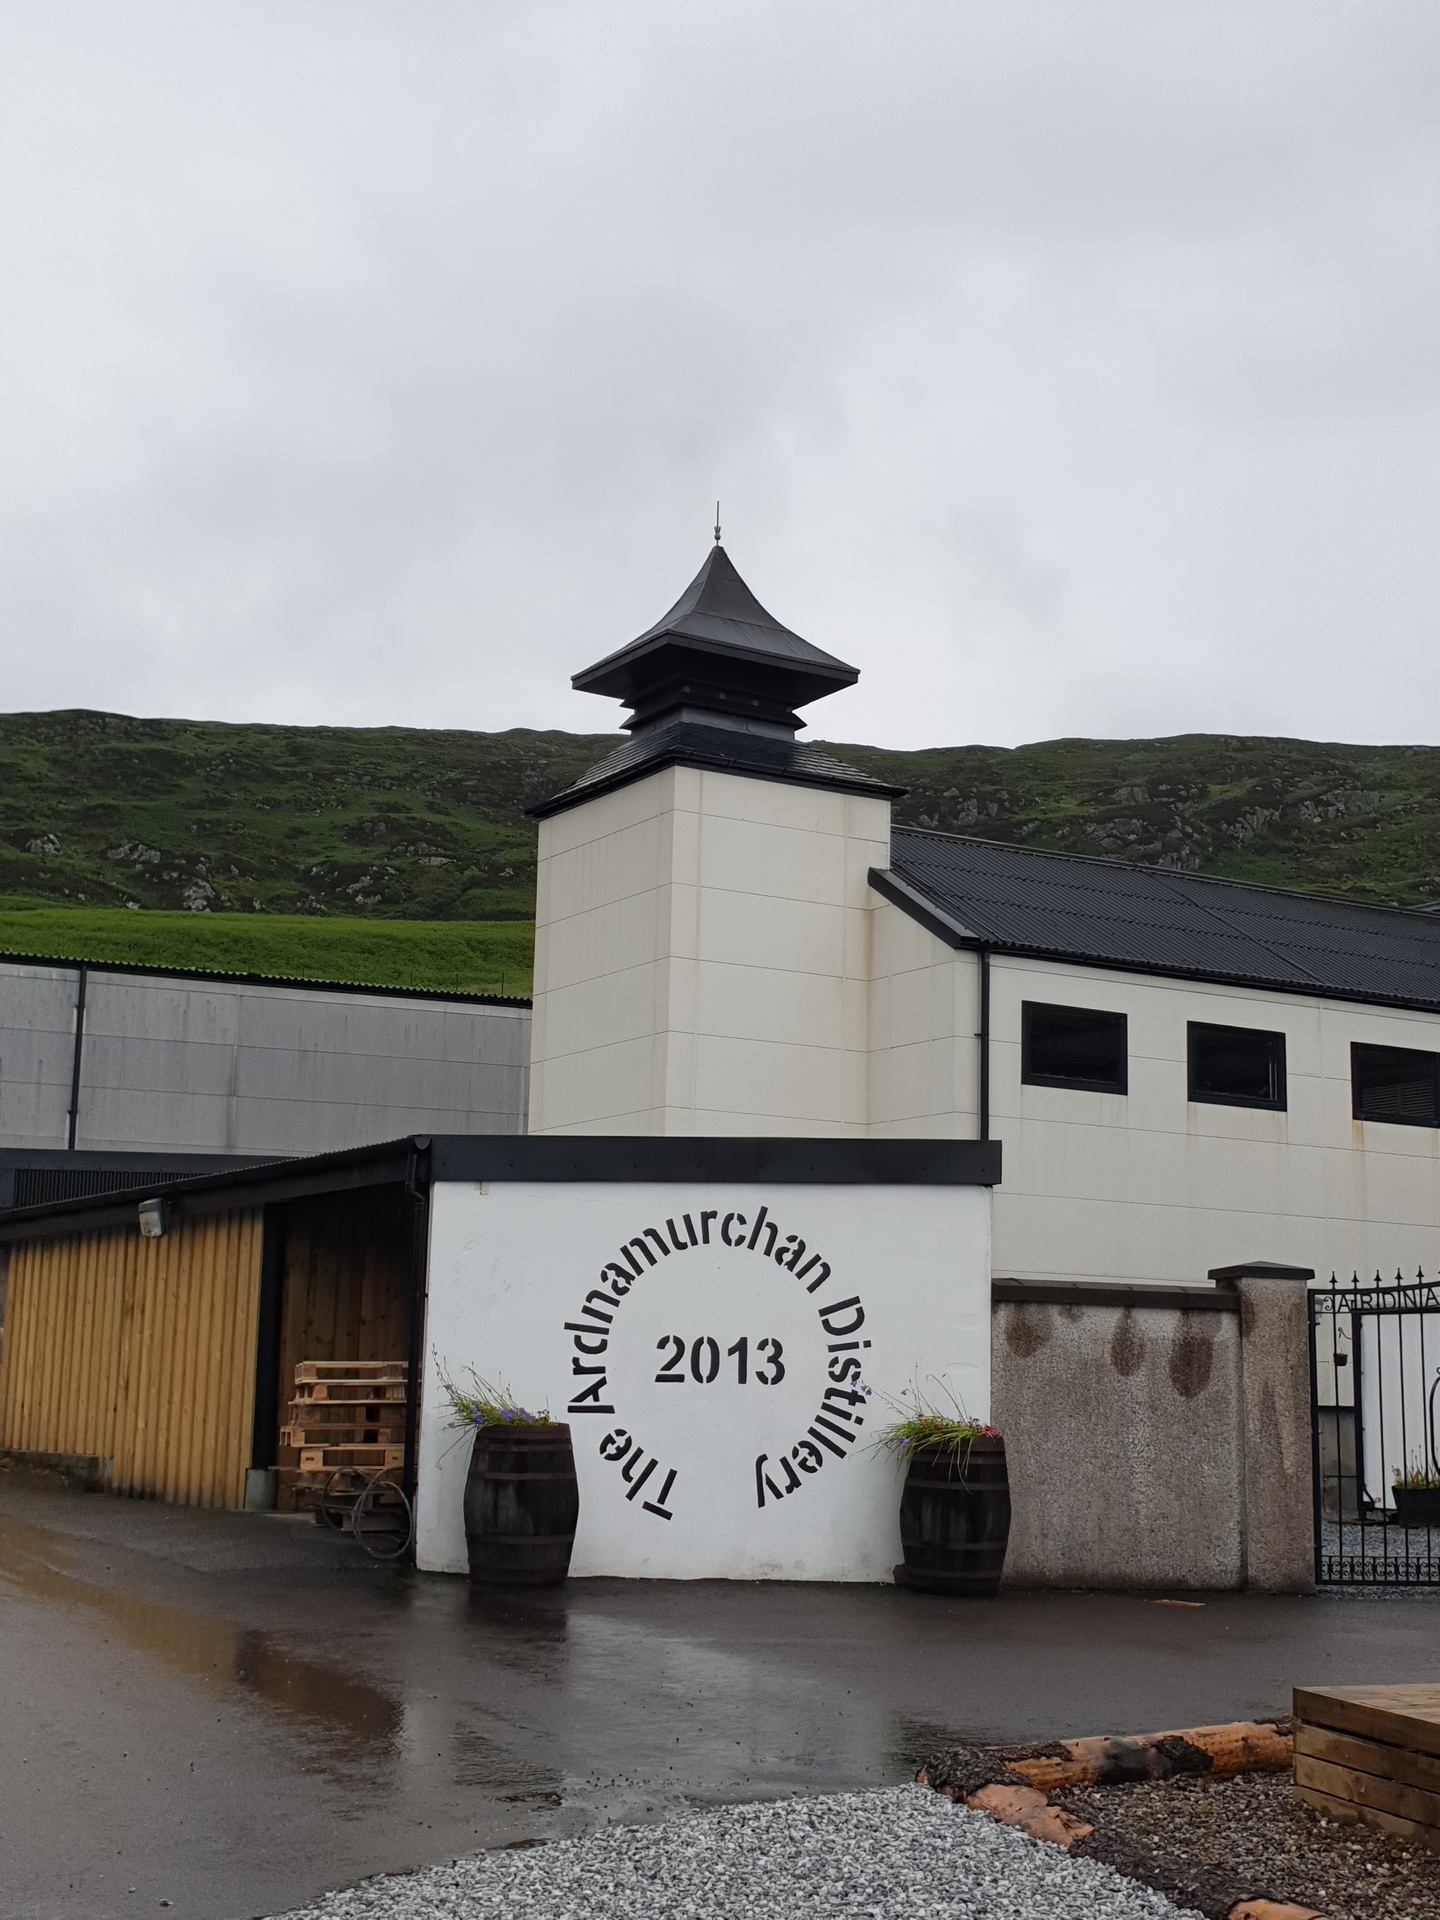
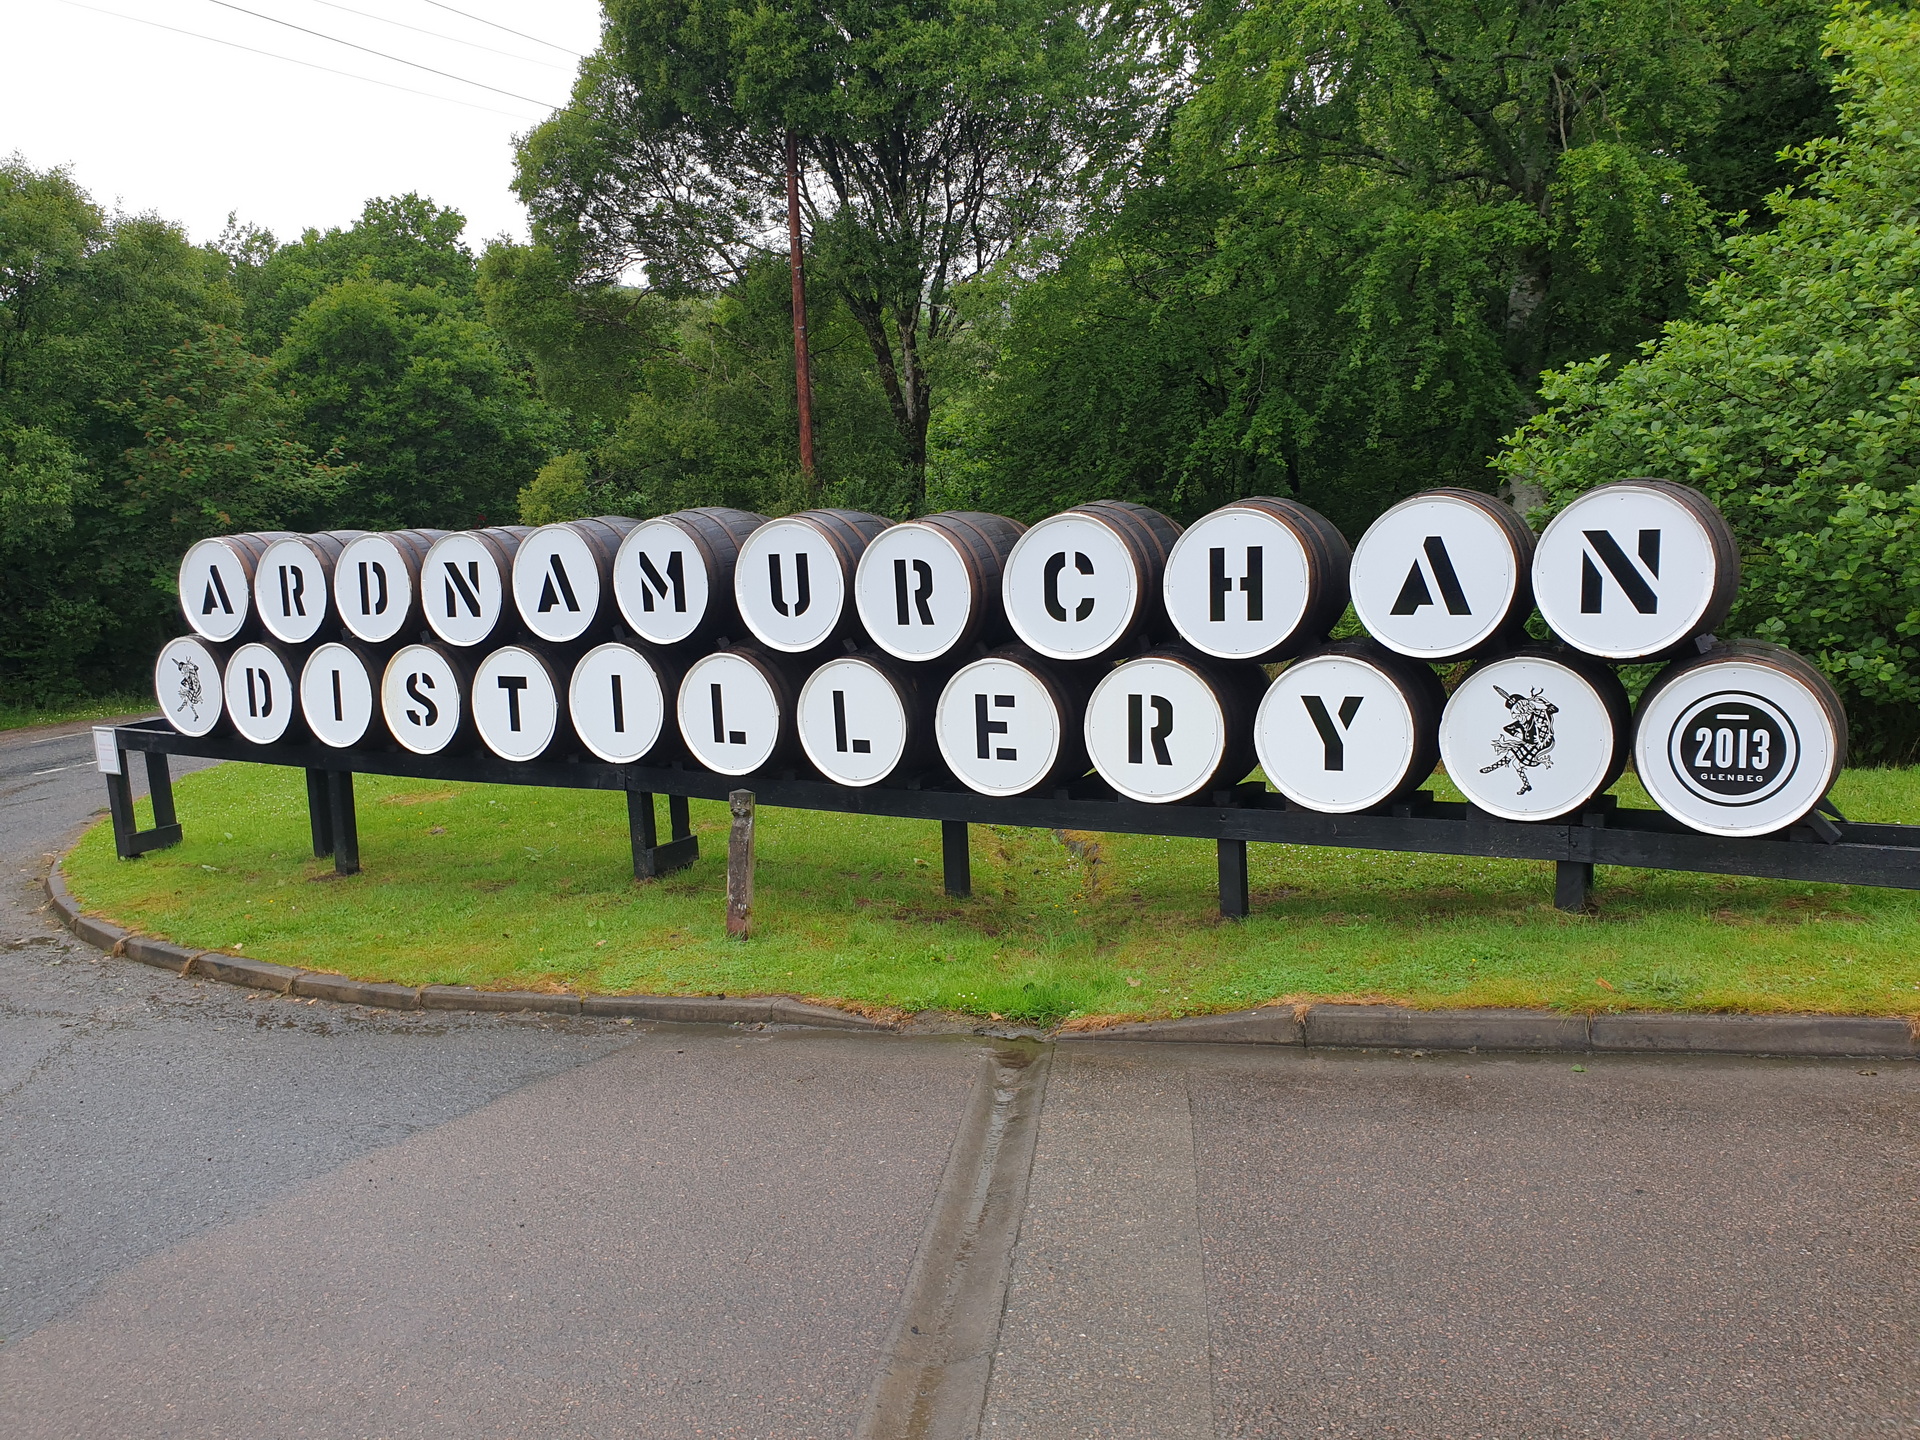
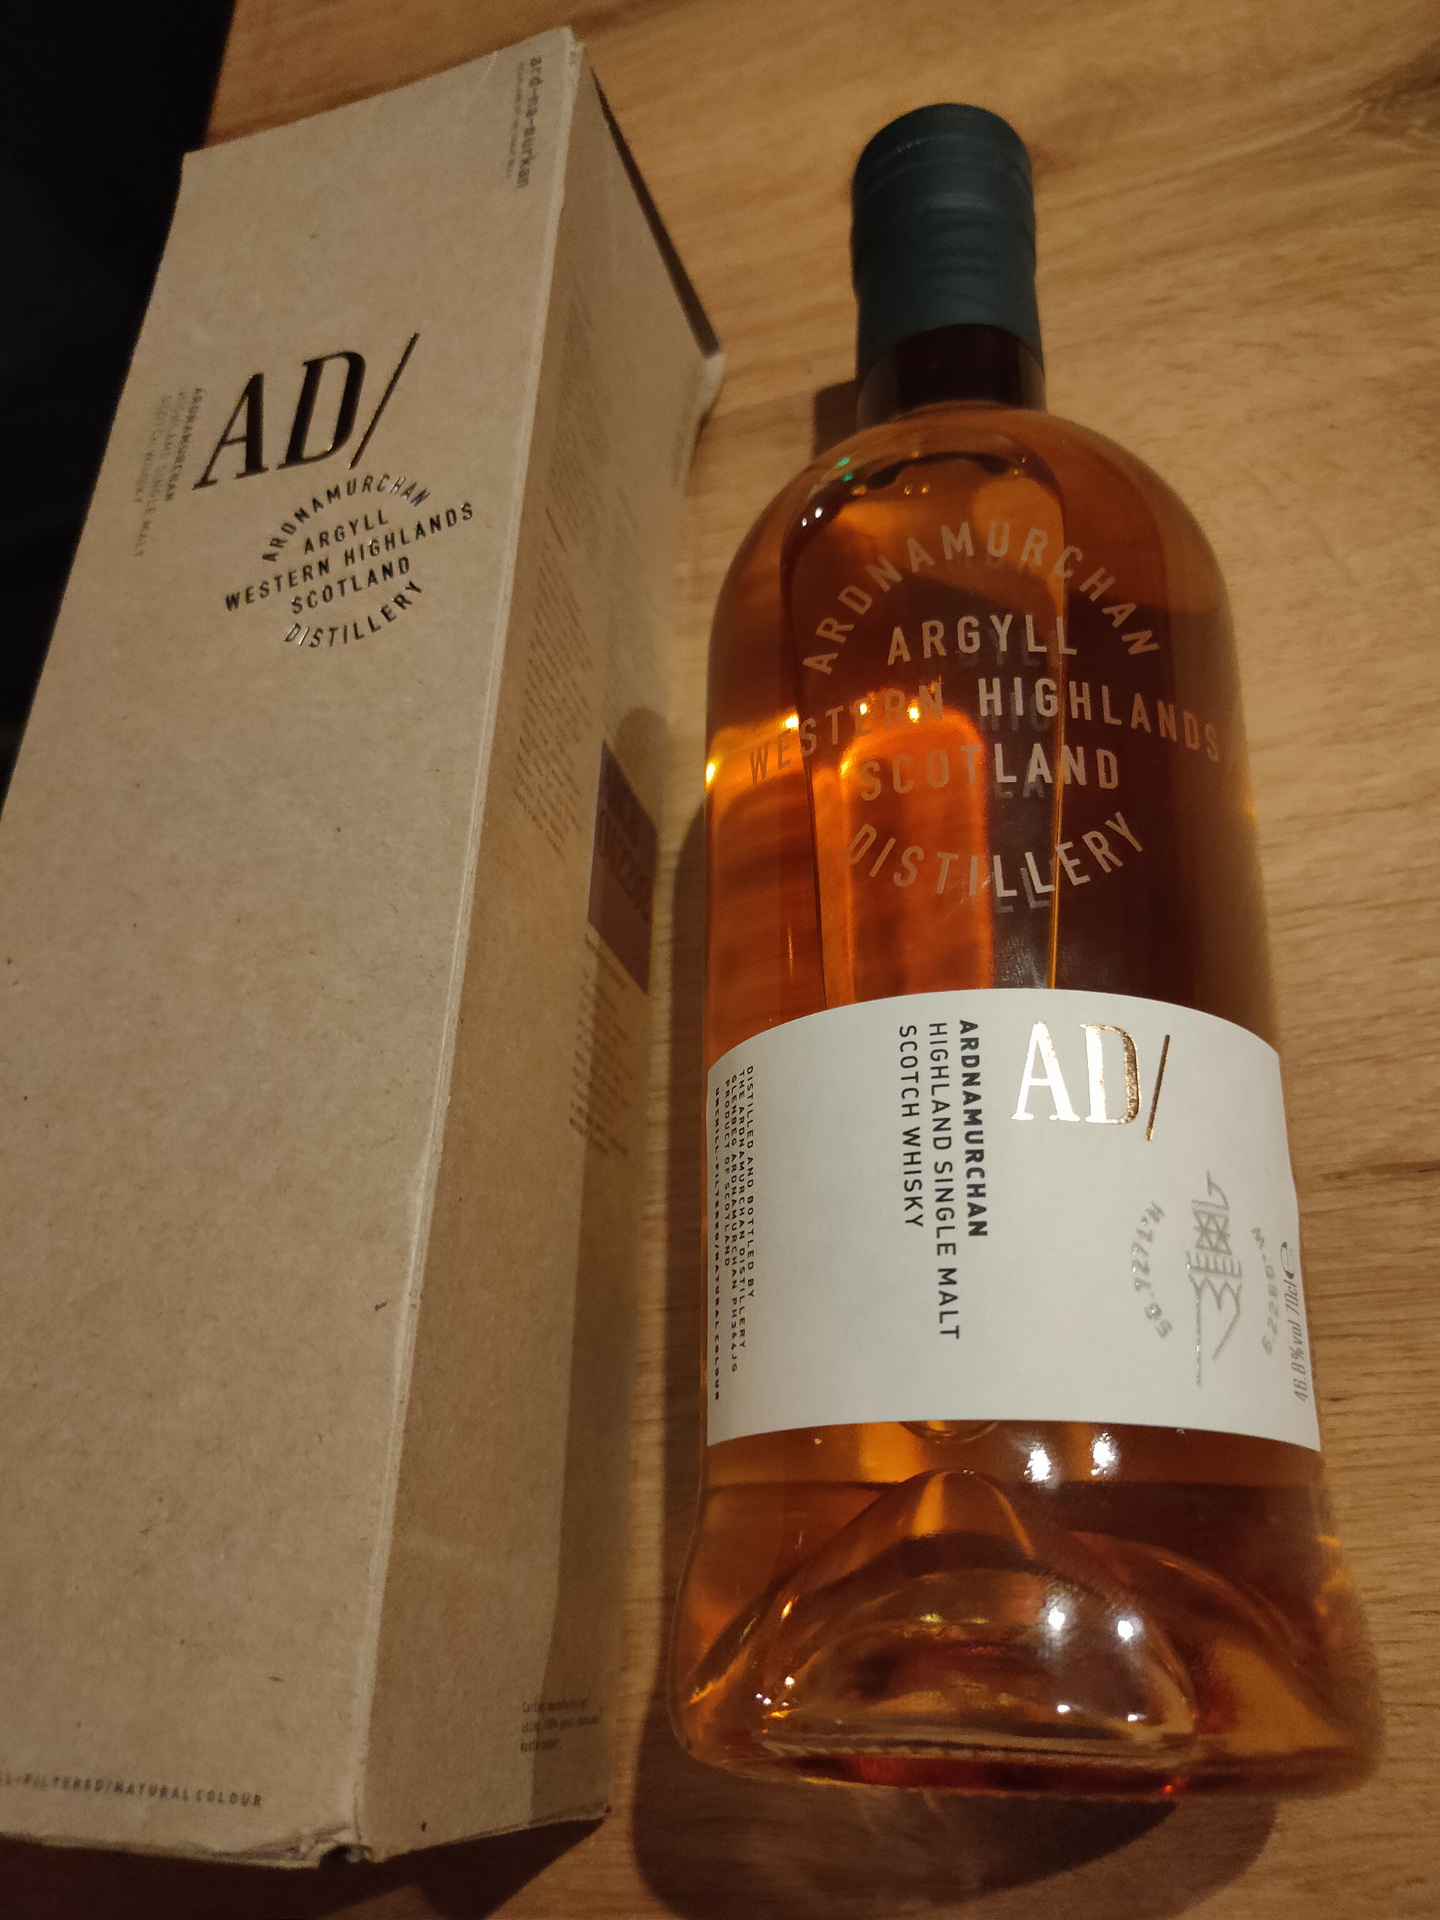
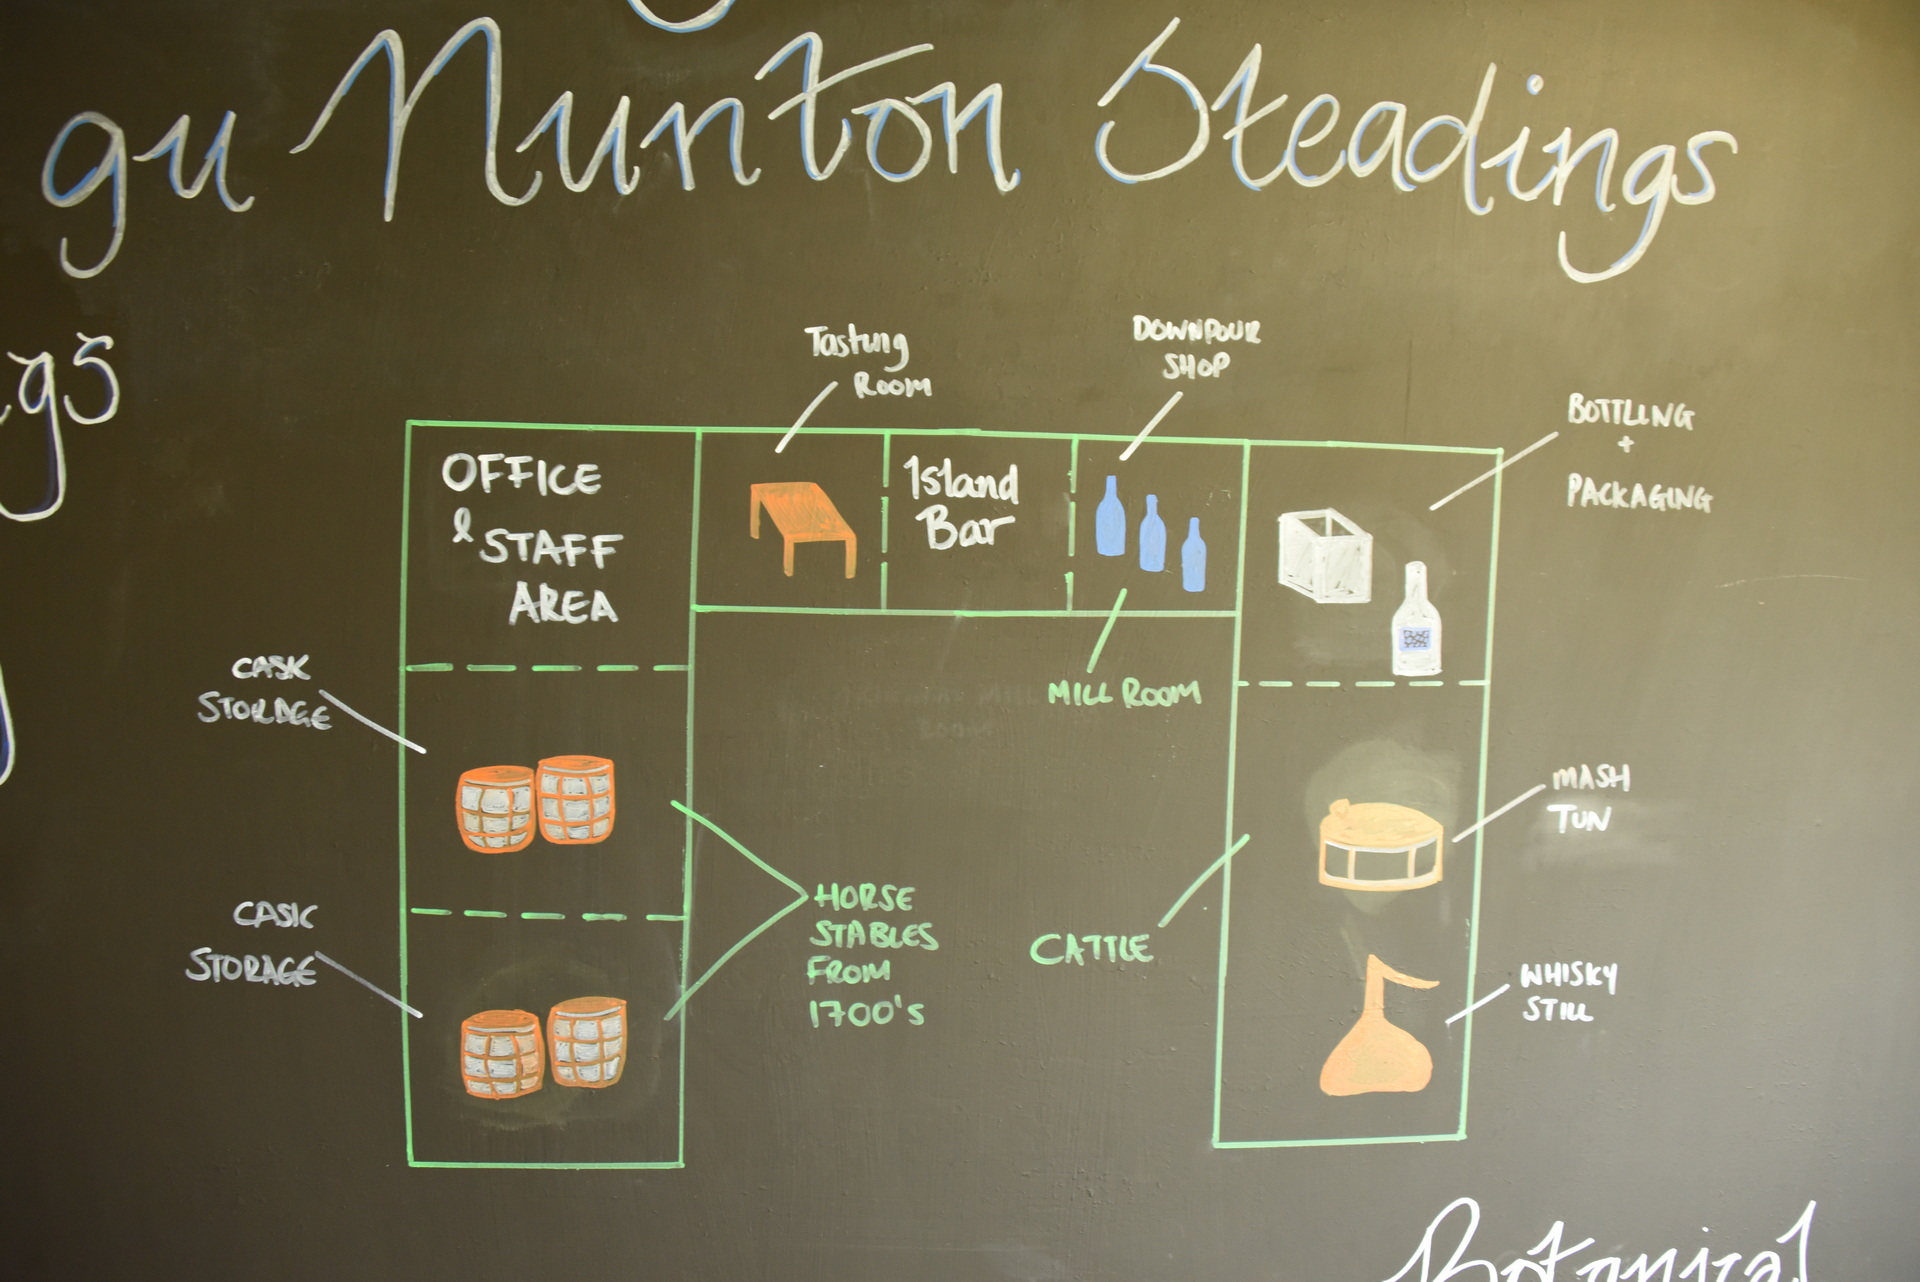
16 Juni – Ardnamurchan
Even in de shop gekeken, en een inieminie klein glaasje kunnen proeven, nog een flesje gekocht en wat foto’s maken.
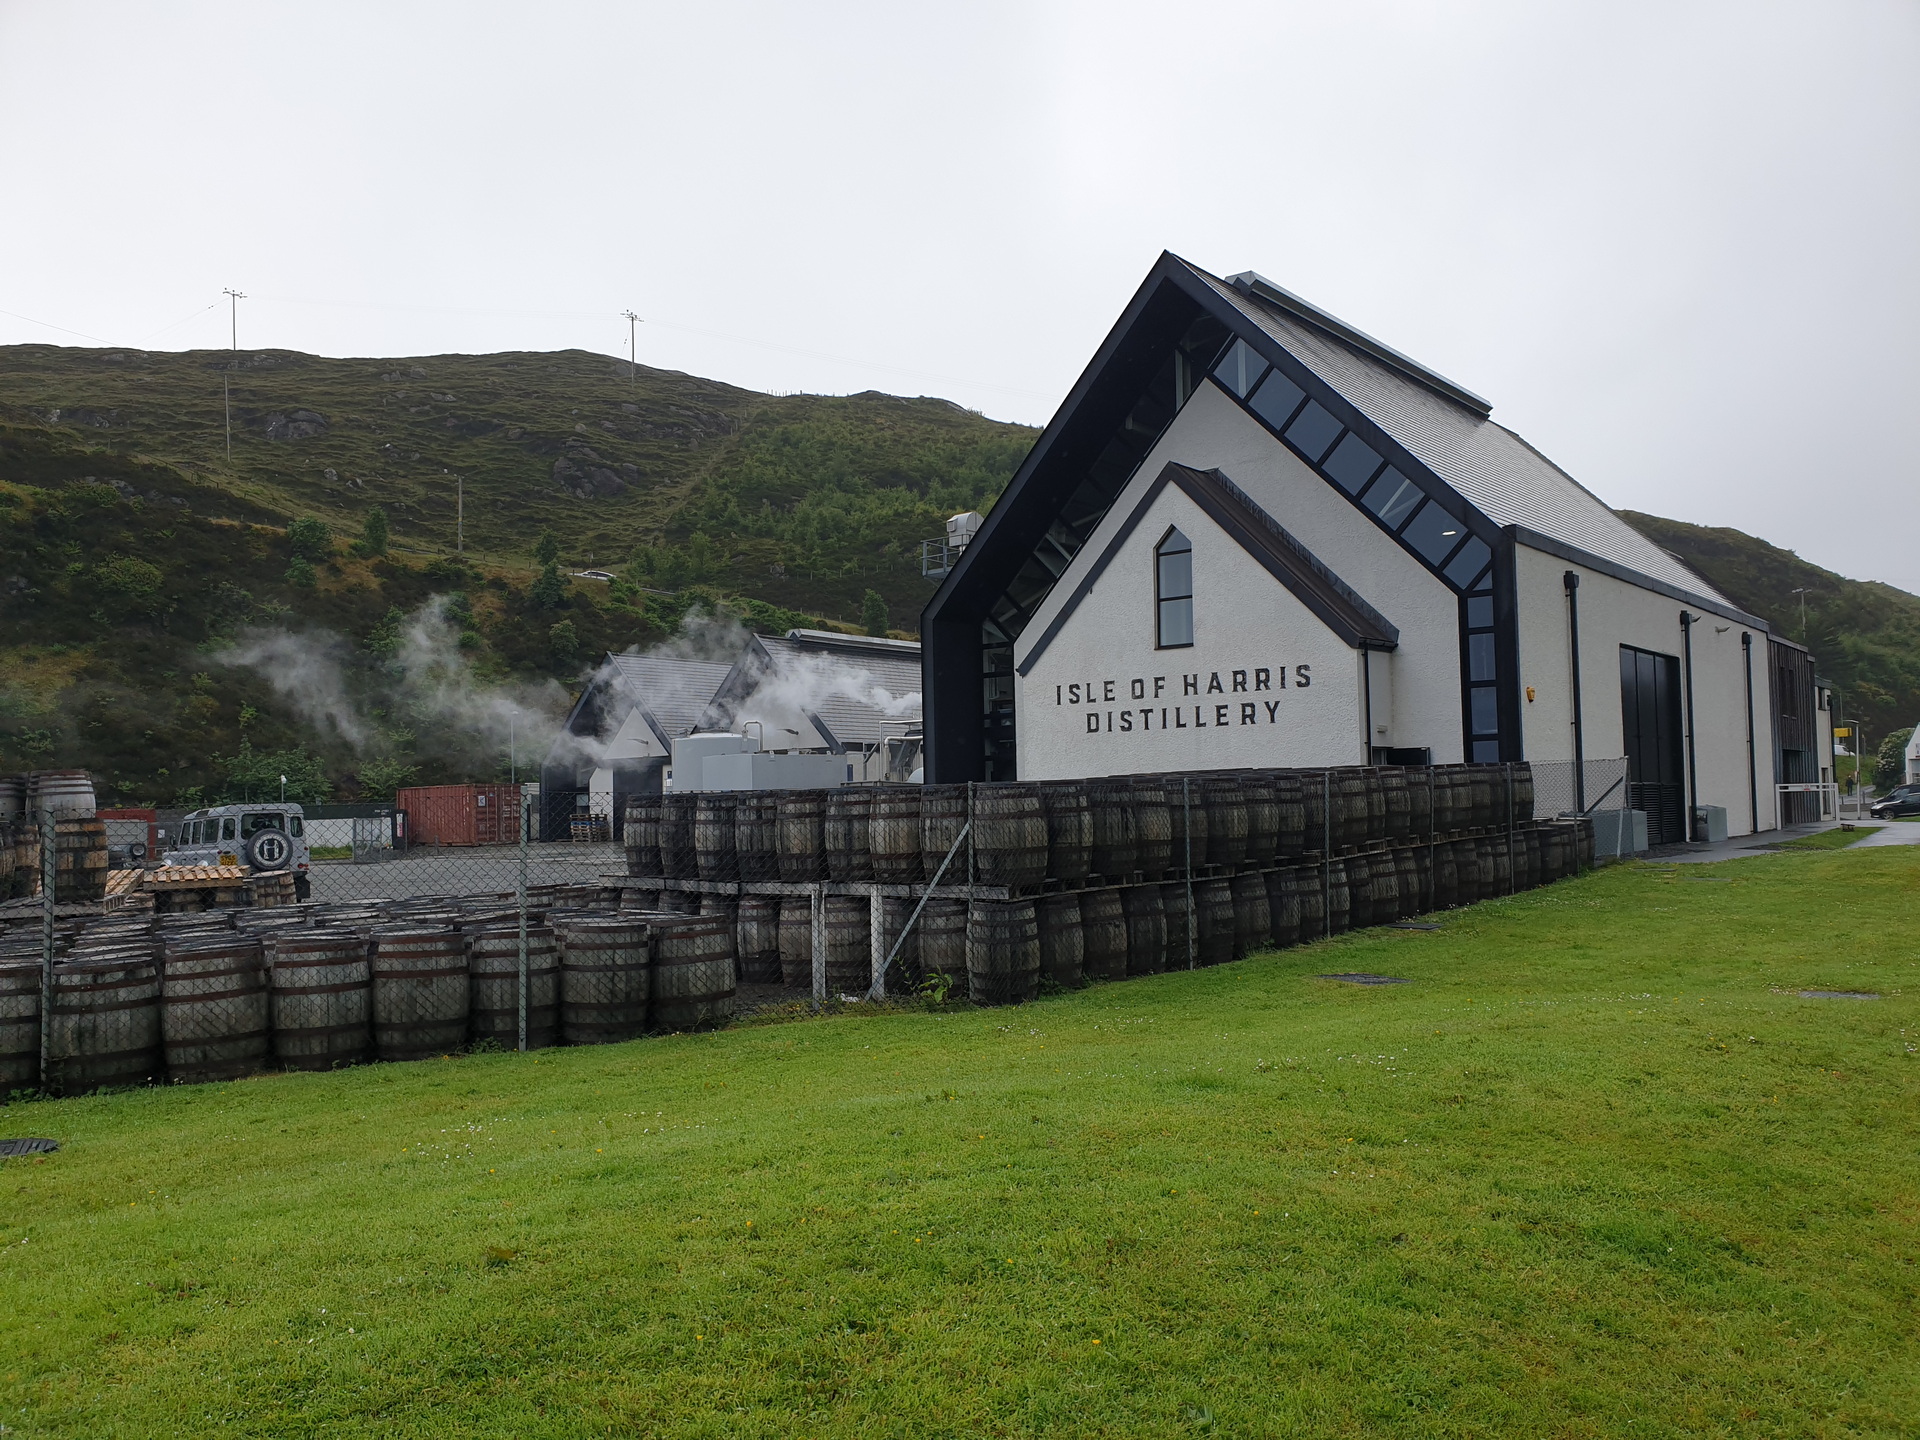
20 Juni – North Uist Distillery (Benbecula), Isle of Harris distillery (Isle of Harris
We hebben nog een korte stop gemaakt bij de North Uist Distillery, welke om 10 uur open zou gaan. Deze destilleerderij is nog maar net begonnen dus heeft nog geen Whisky, maar zoals zovele startende destillerderijen, mogen ze wel gin maken. Hier hebben we een bezoekje gebracht aan het shopje waar ze hun downpour gin verkochten (welke we bij de AirBnB van Isabel & Robert hadden geproefd). We hebben een fles gekocht (al was het vanwege de mooie fles)
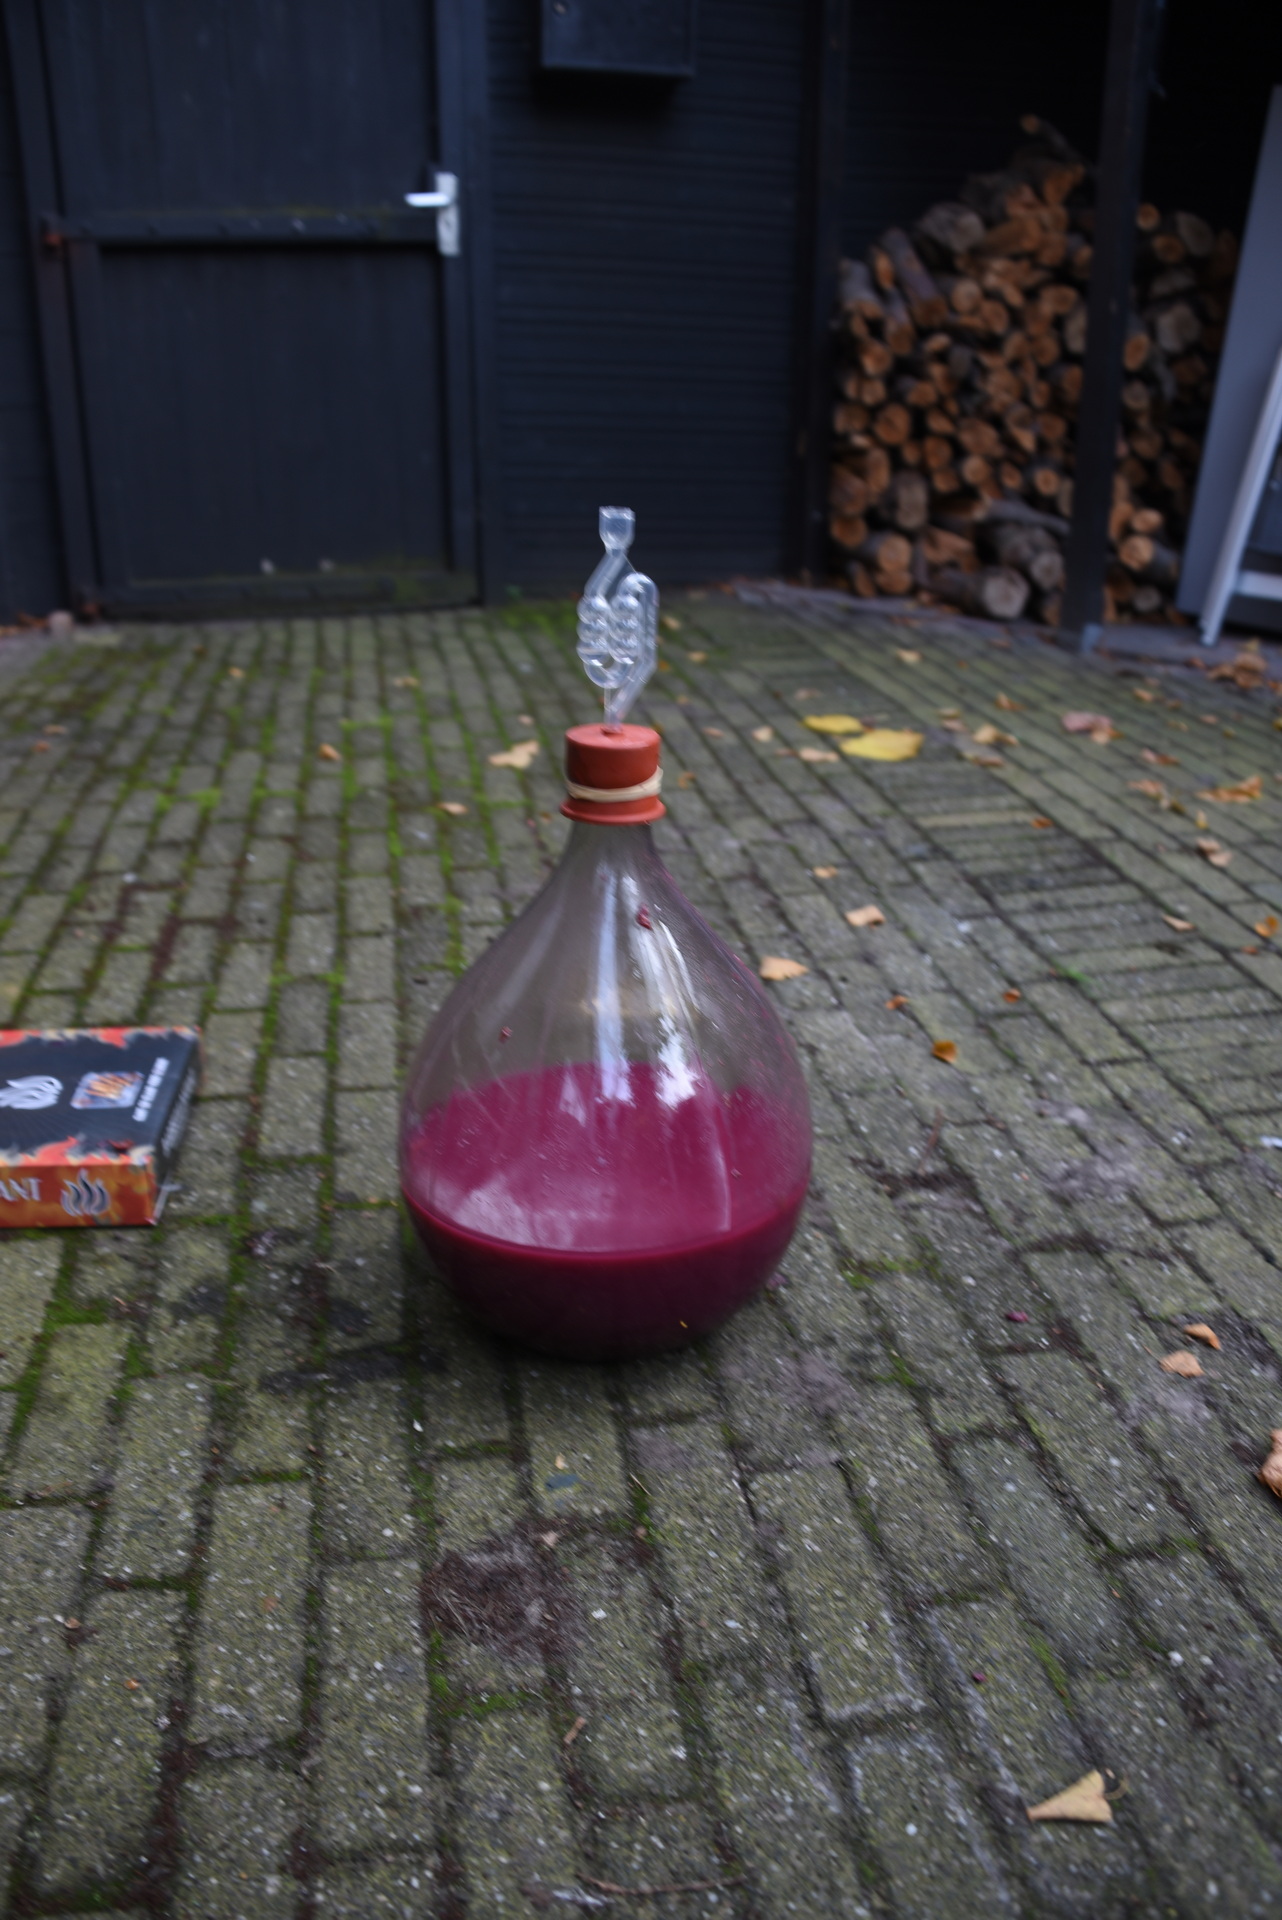
Hier komt t dan 🙂
Hier hebben we een bezoekje gebracht aan de Isle of Harris distillery. Ook hier zijn ze nog te jong om al een whisky te hebben gebotteld. Maar ook hier zijn ze begonnen met een gin, deze bevat sugar kelp als speciaal extra ingrediënt.
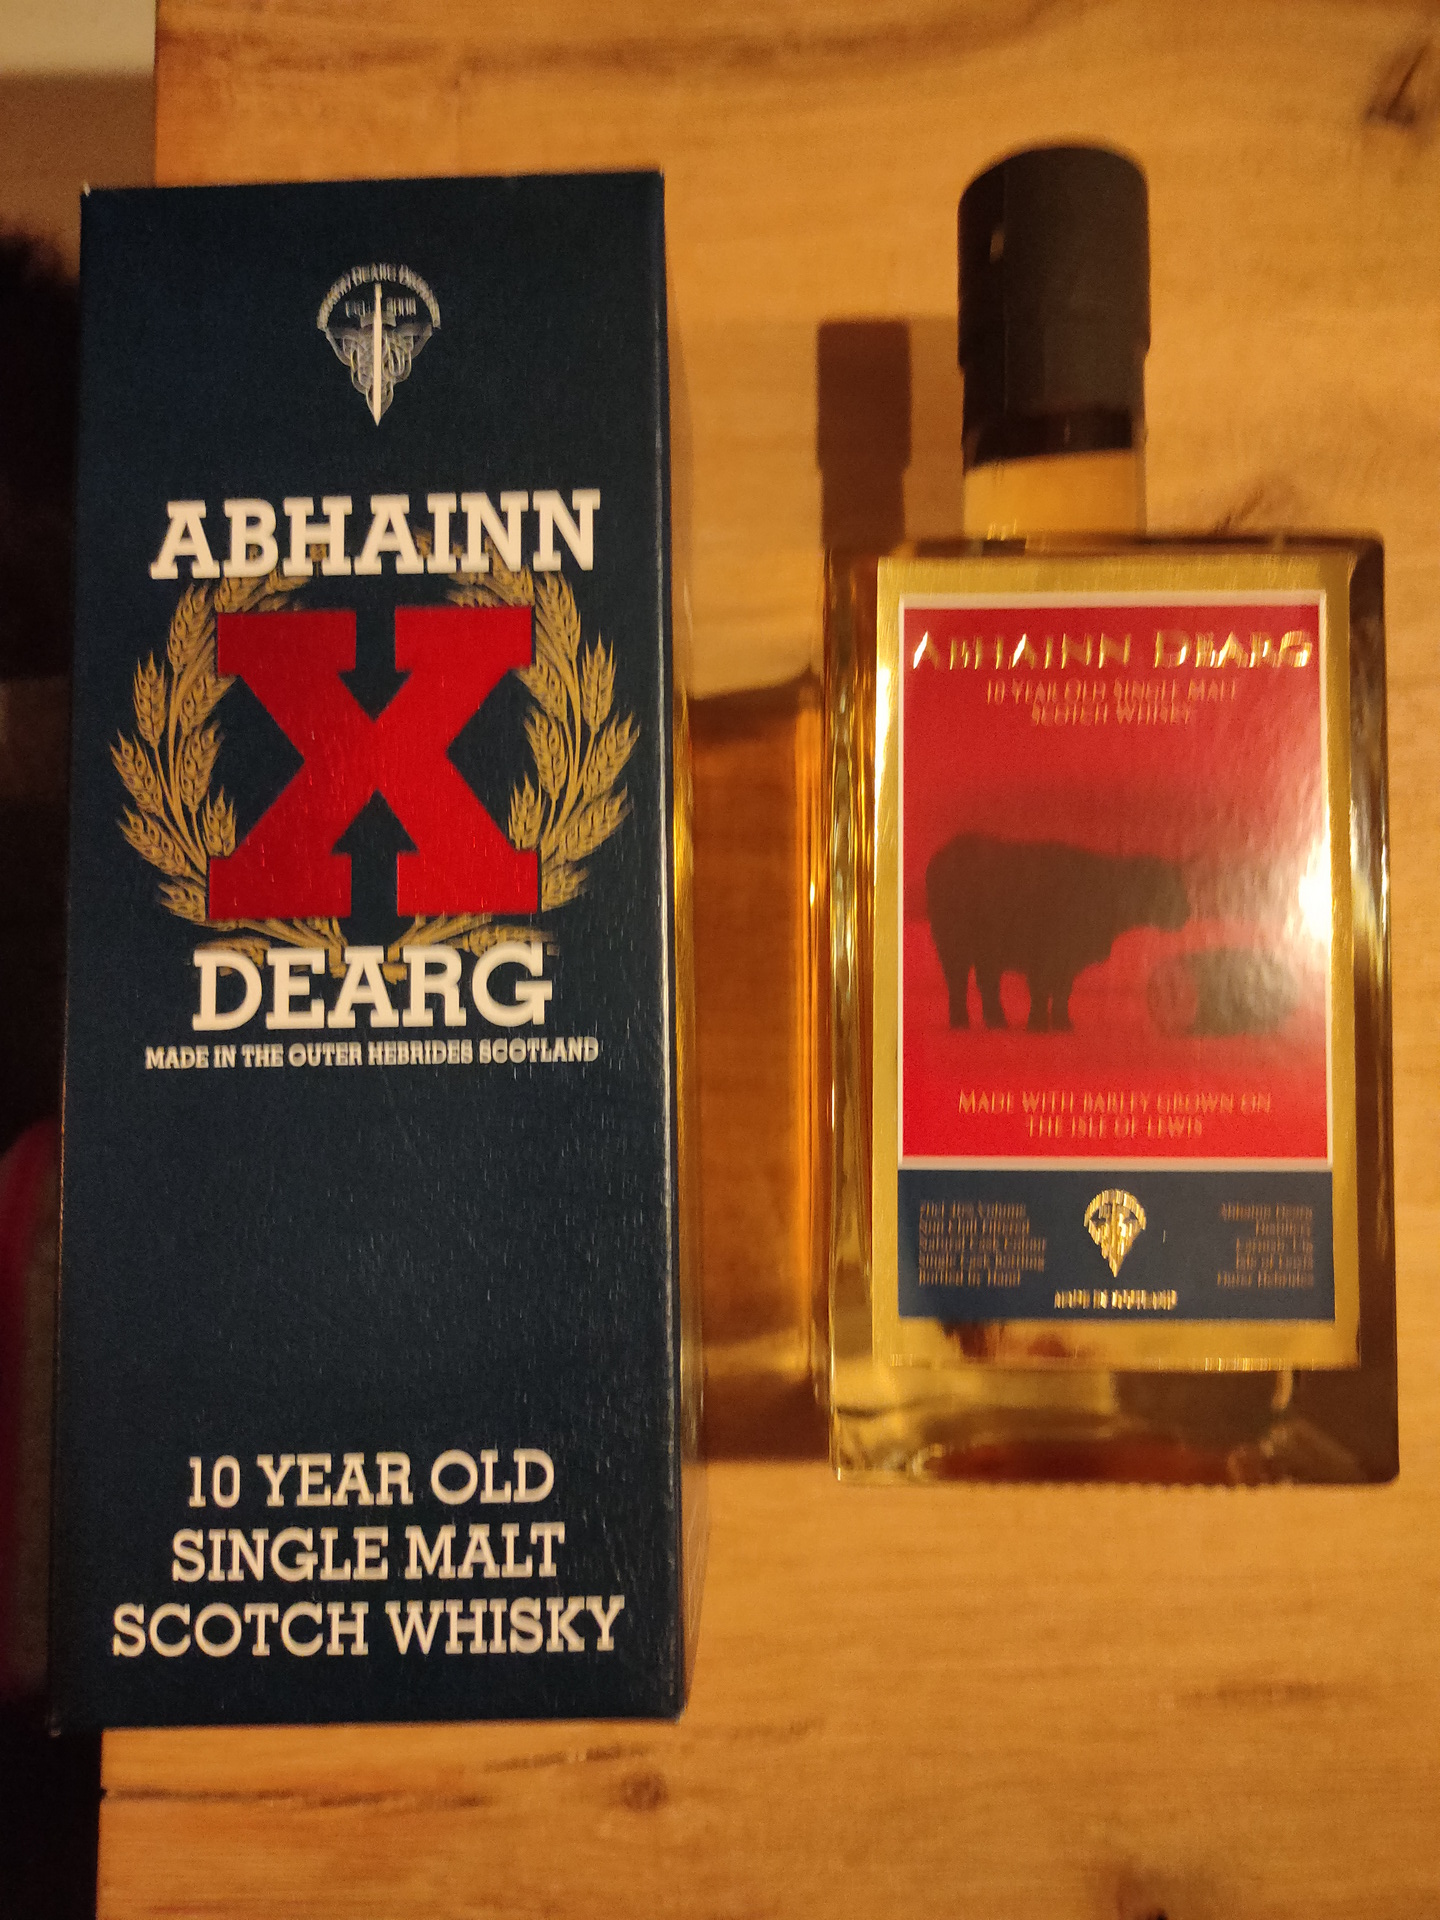
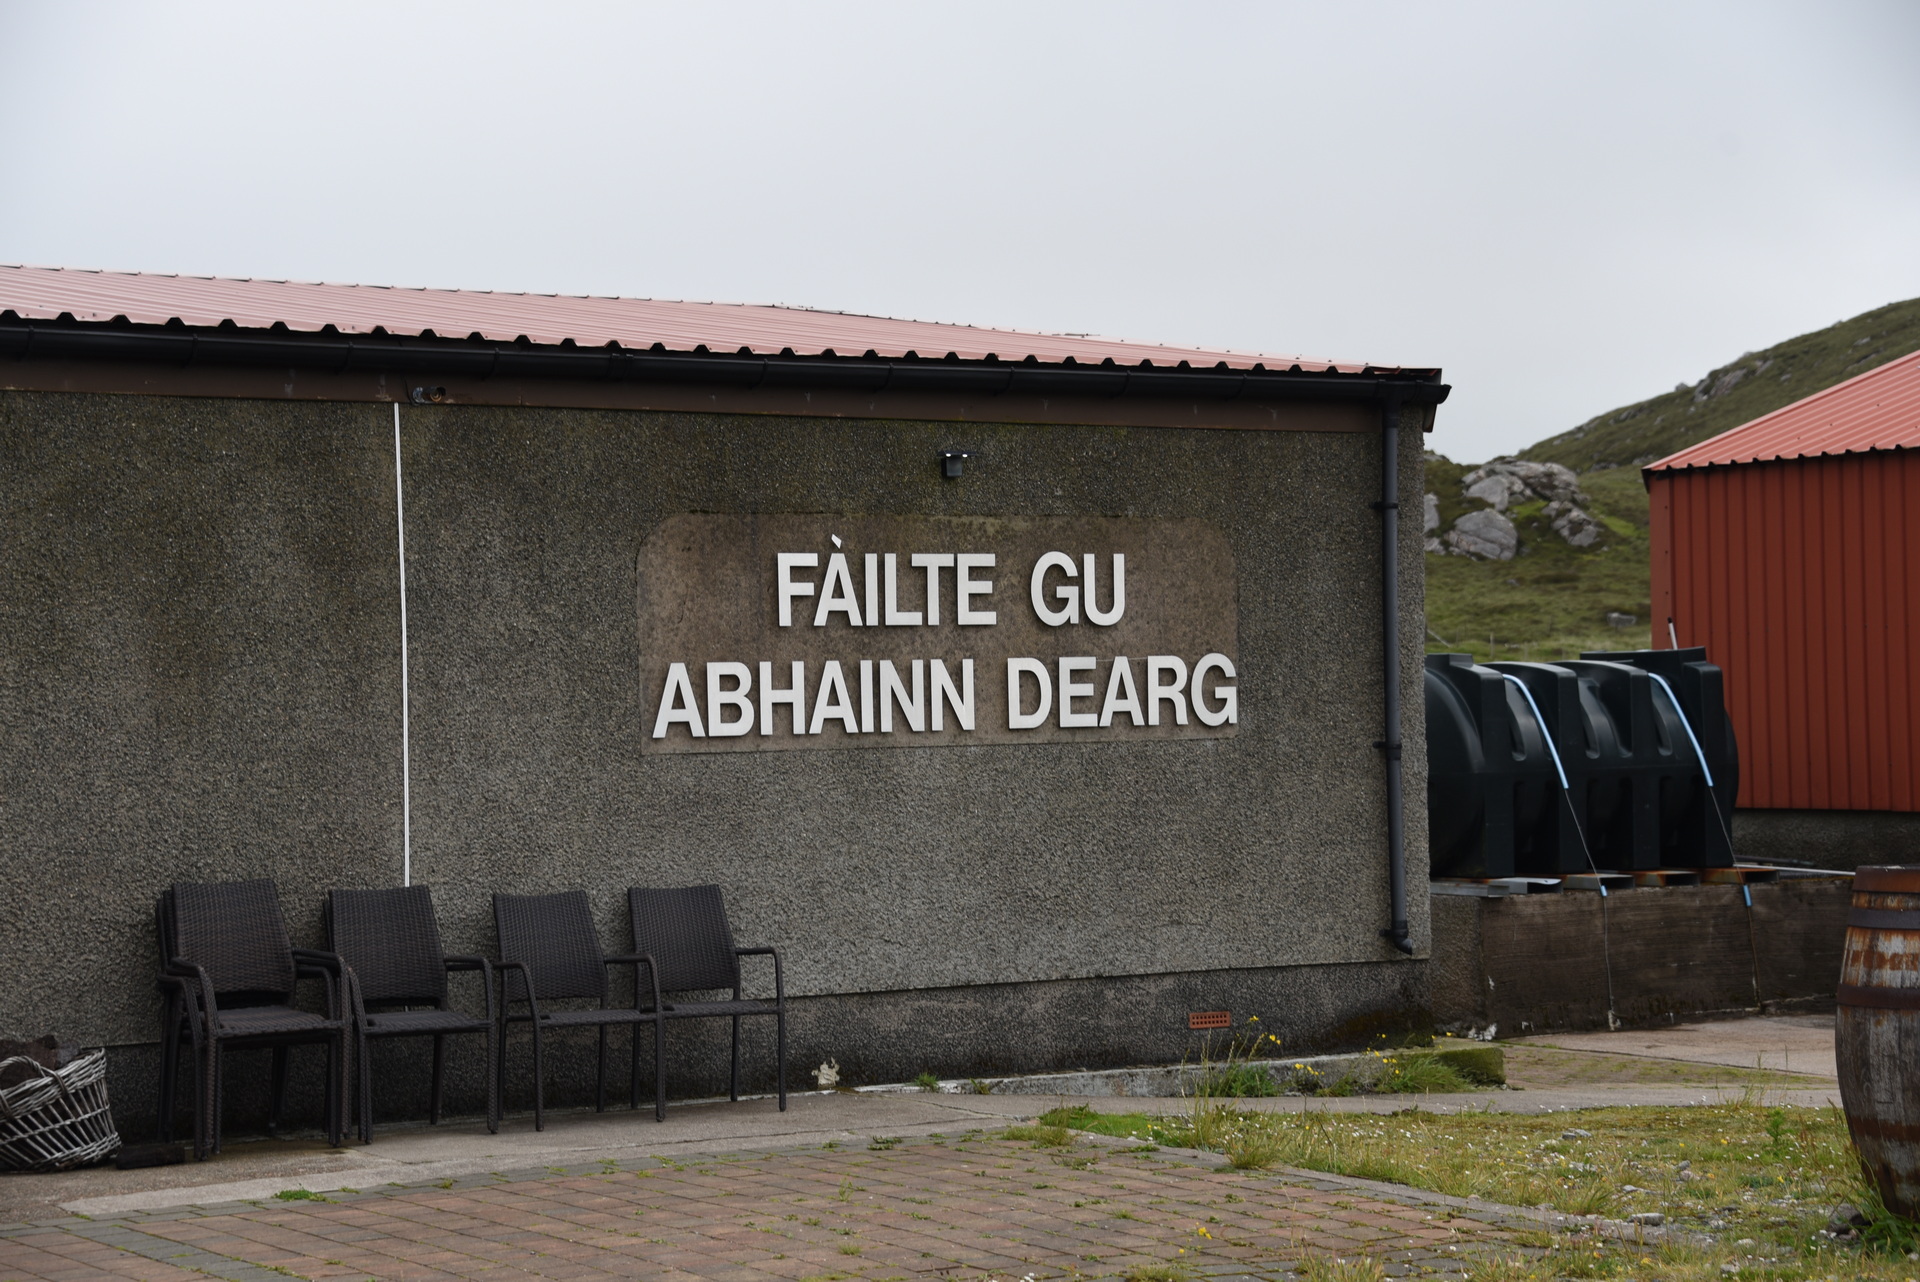
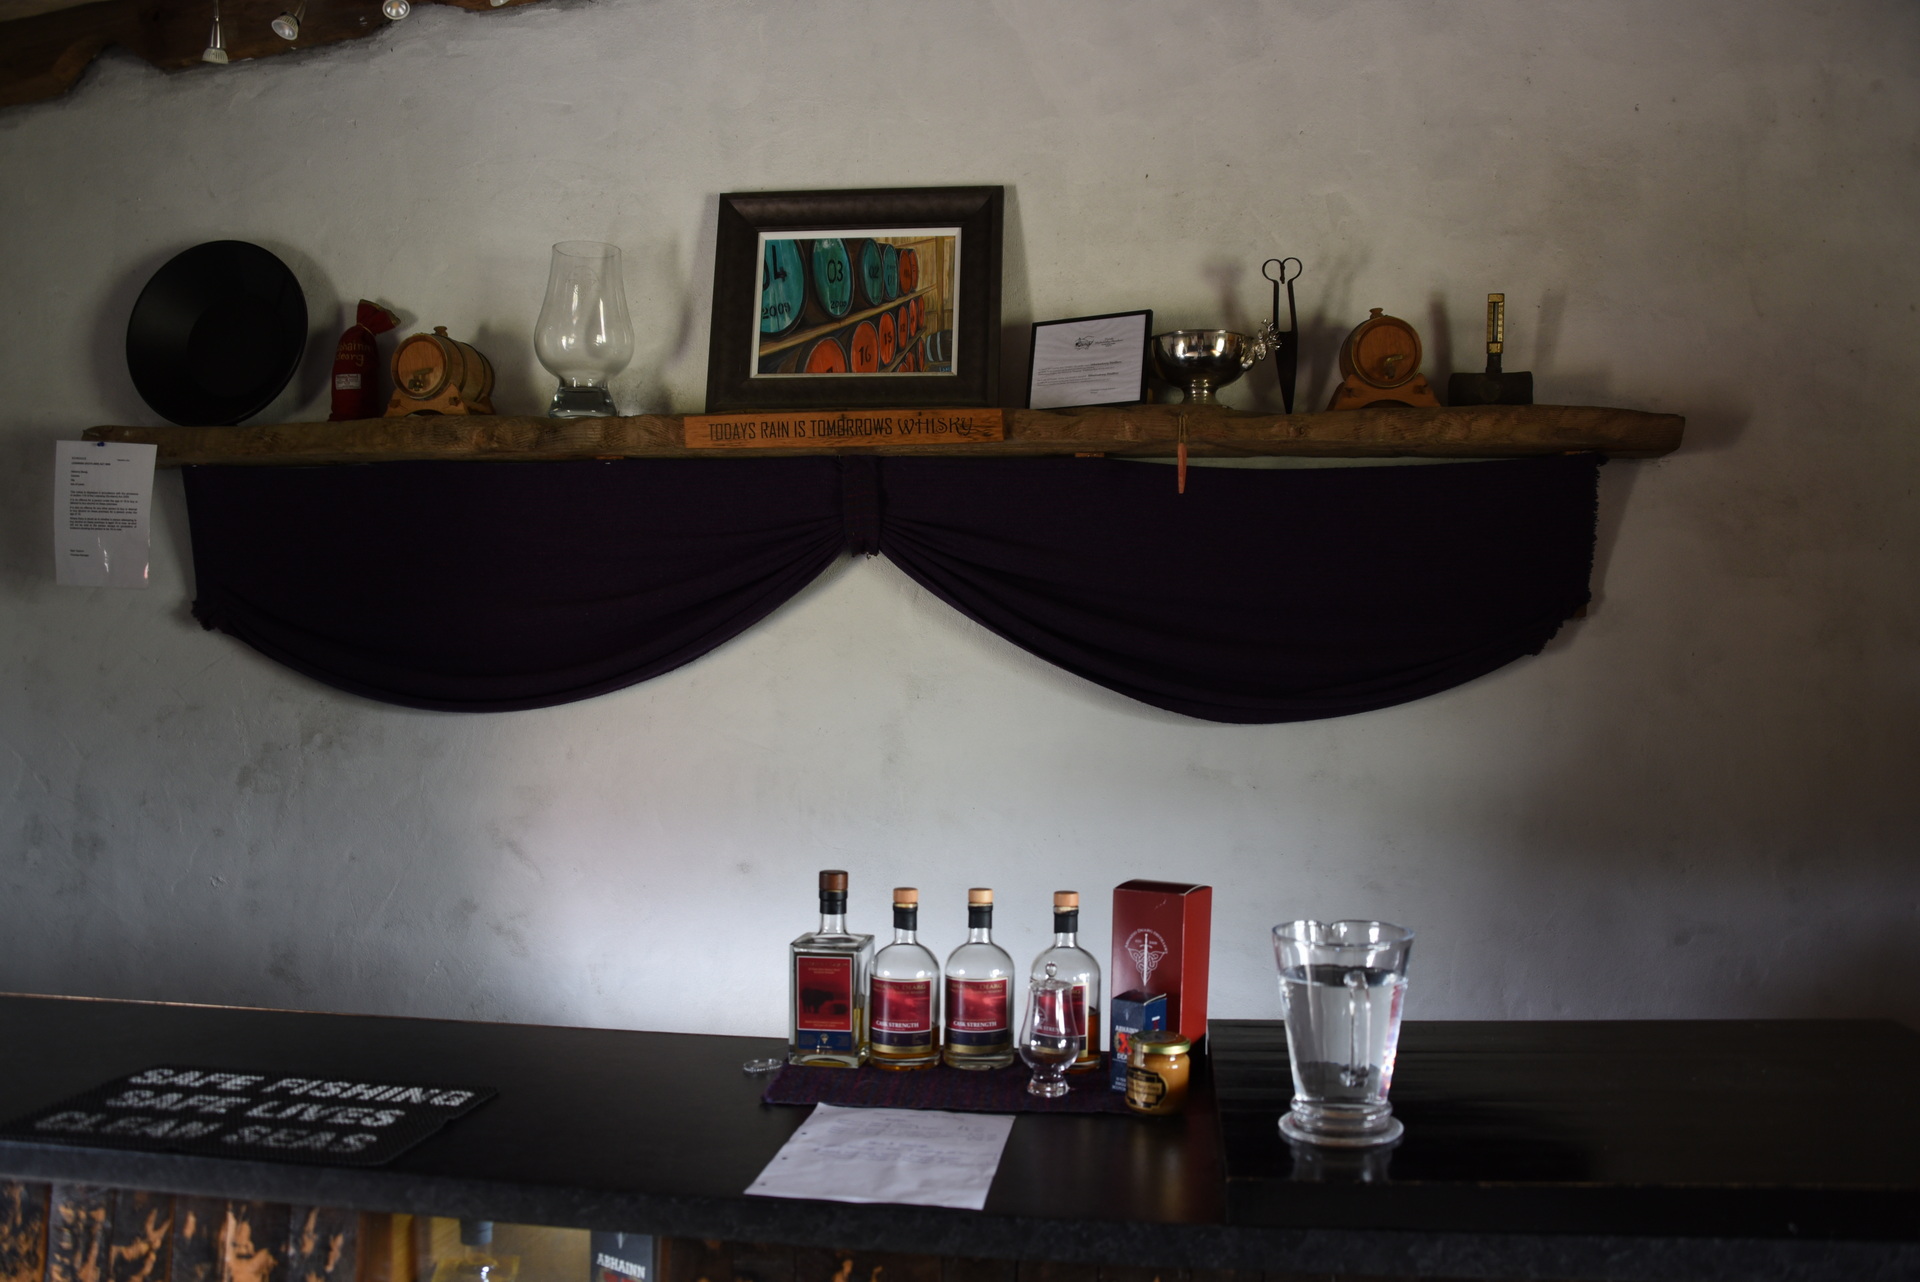
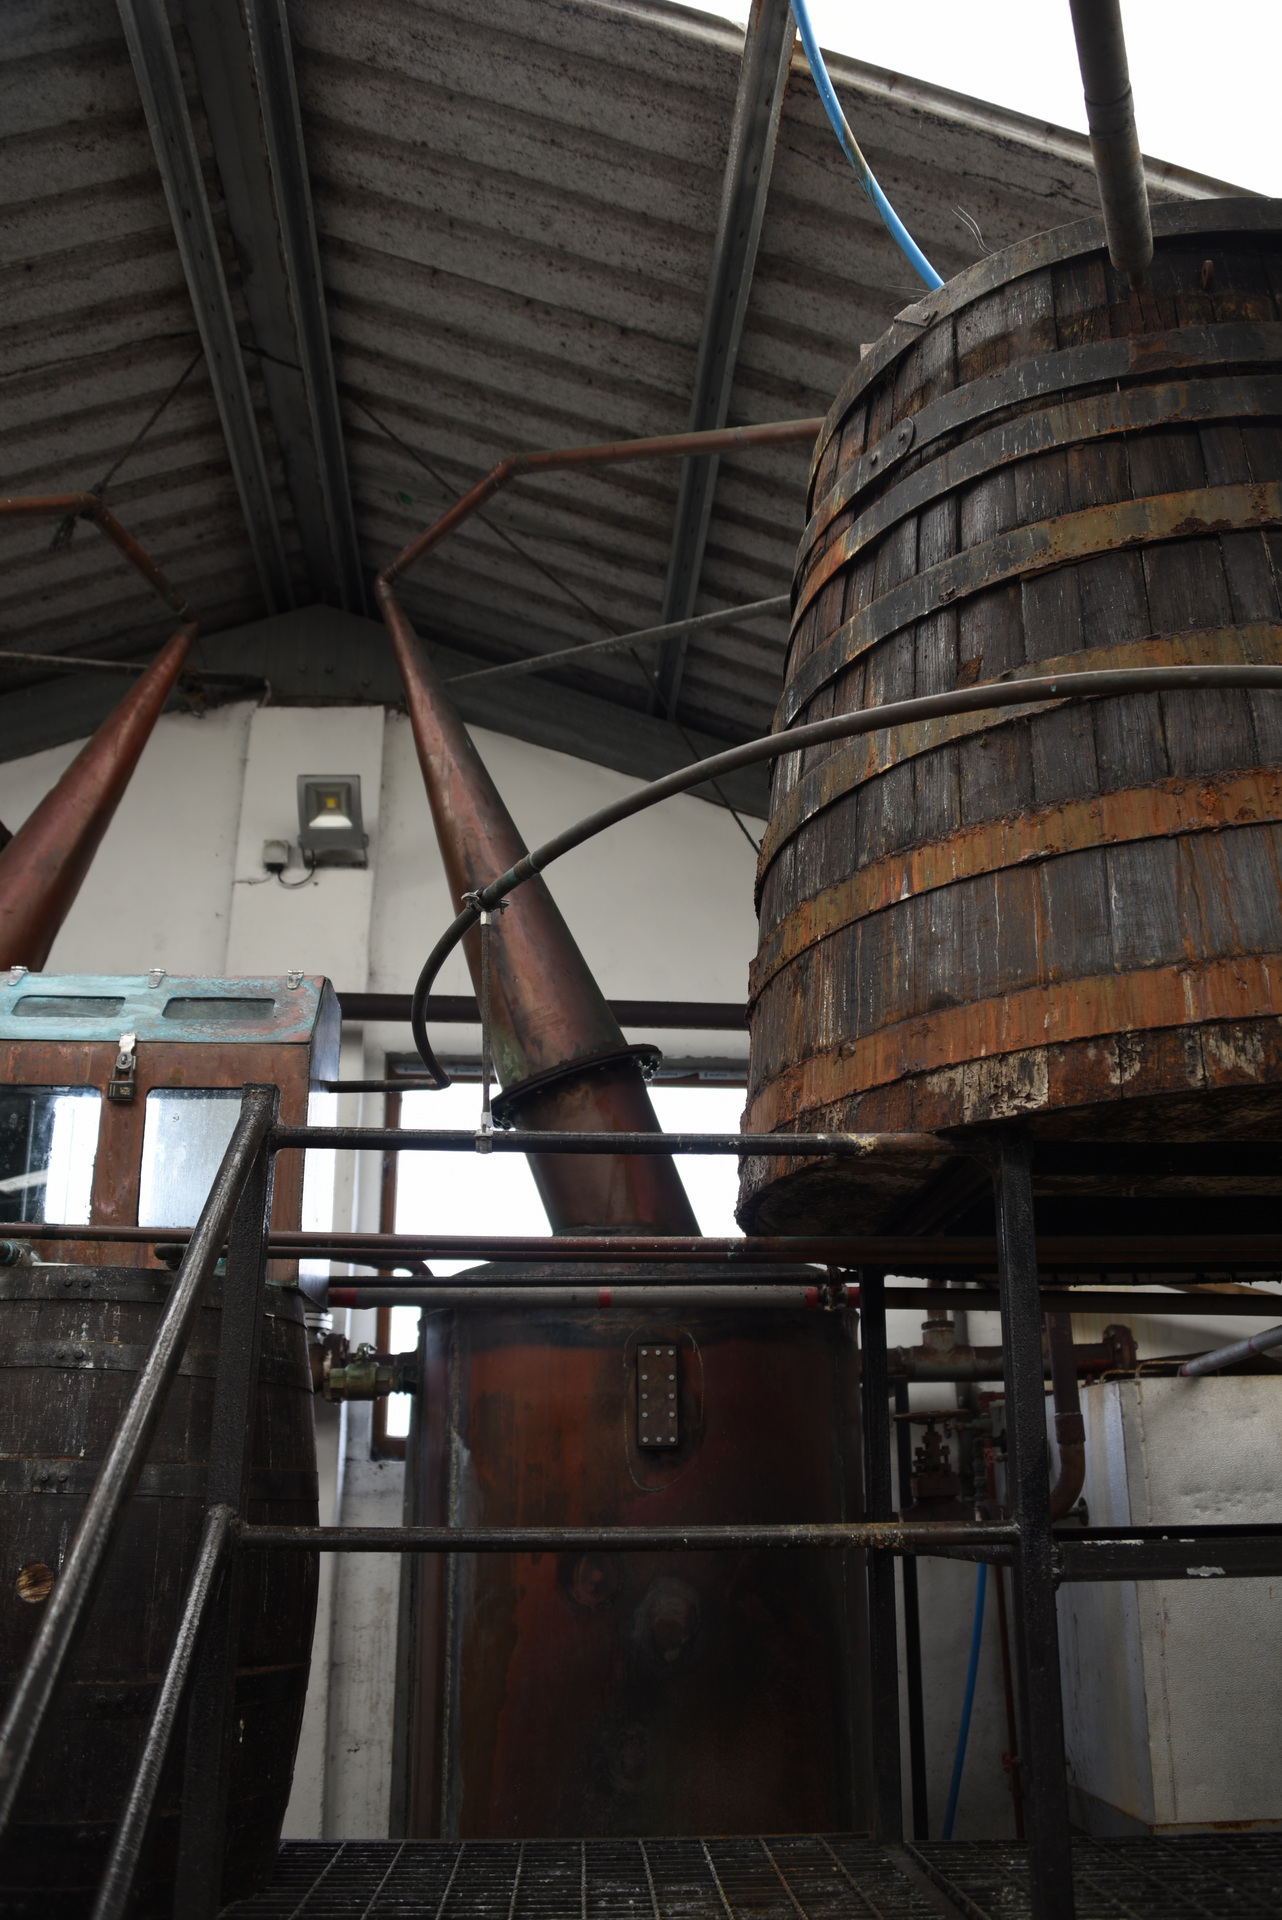
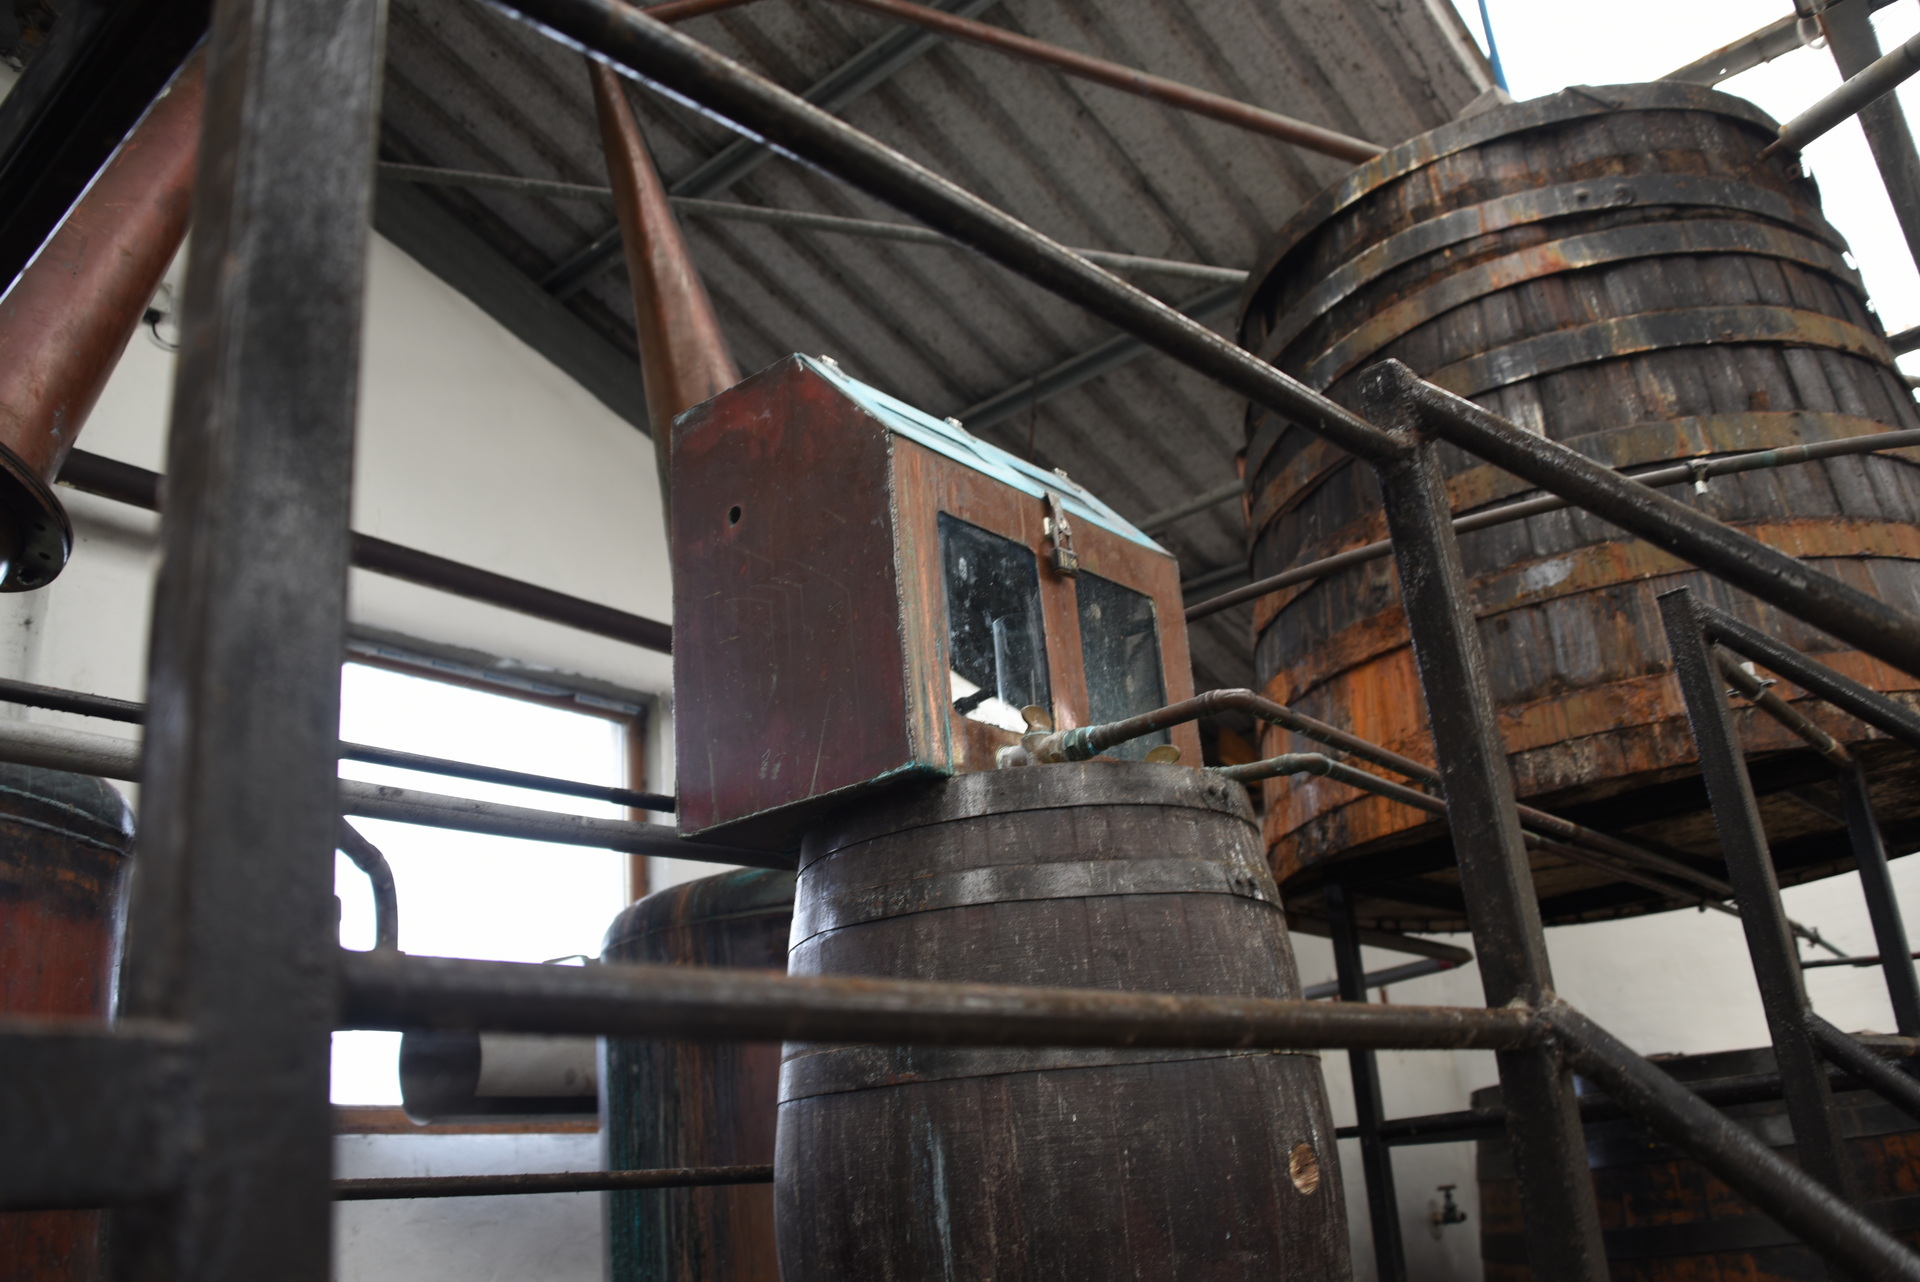
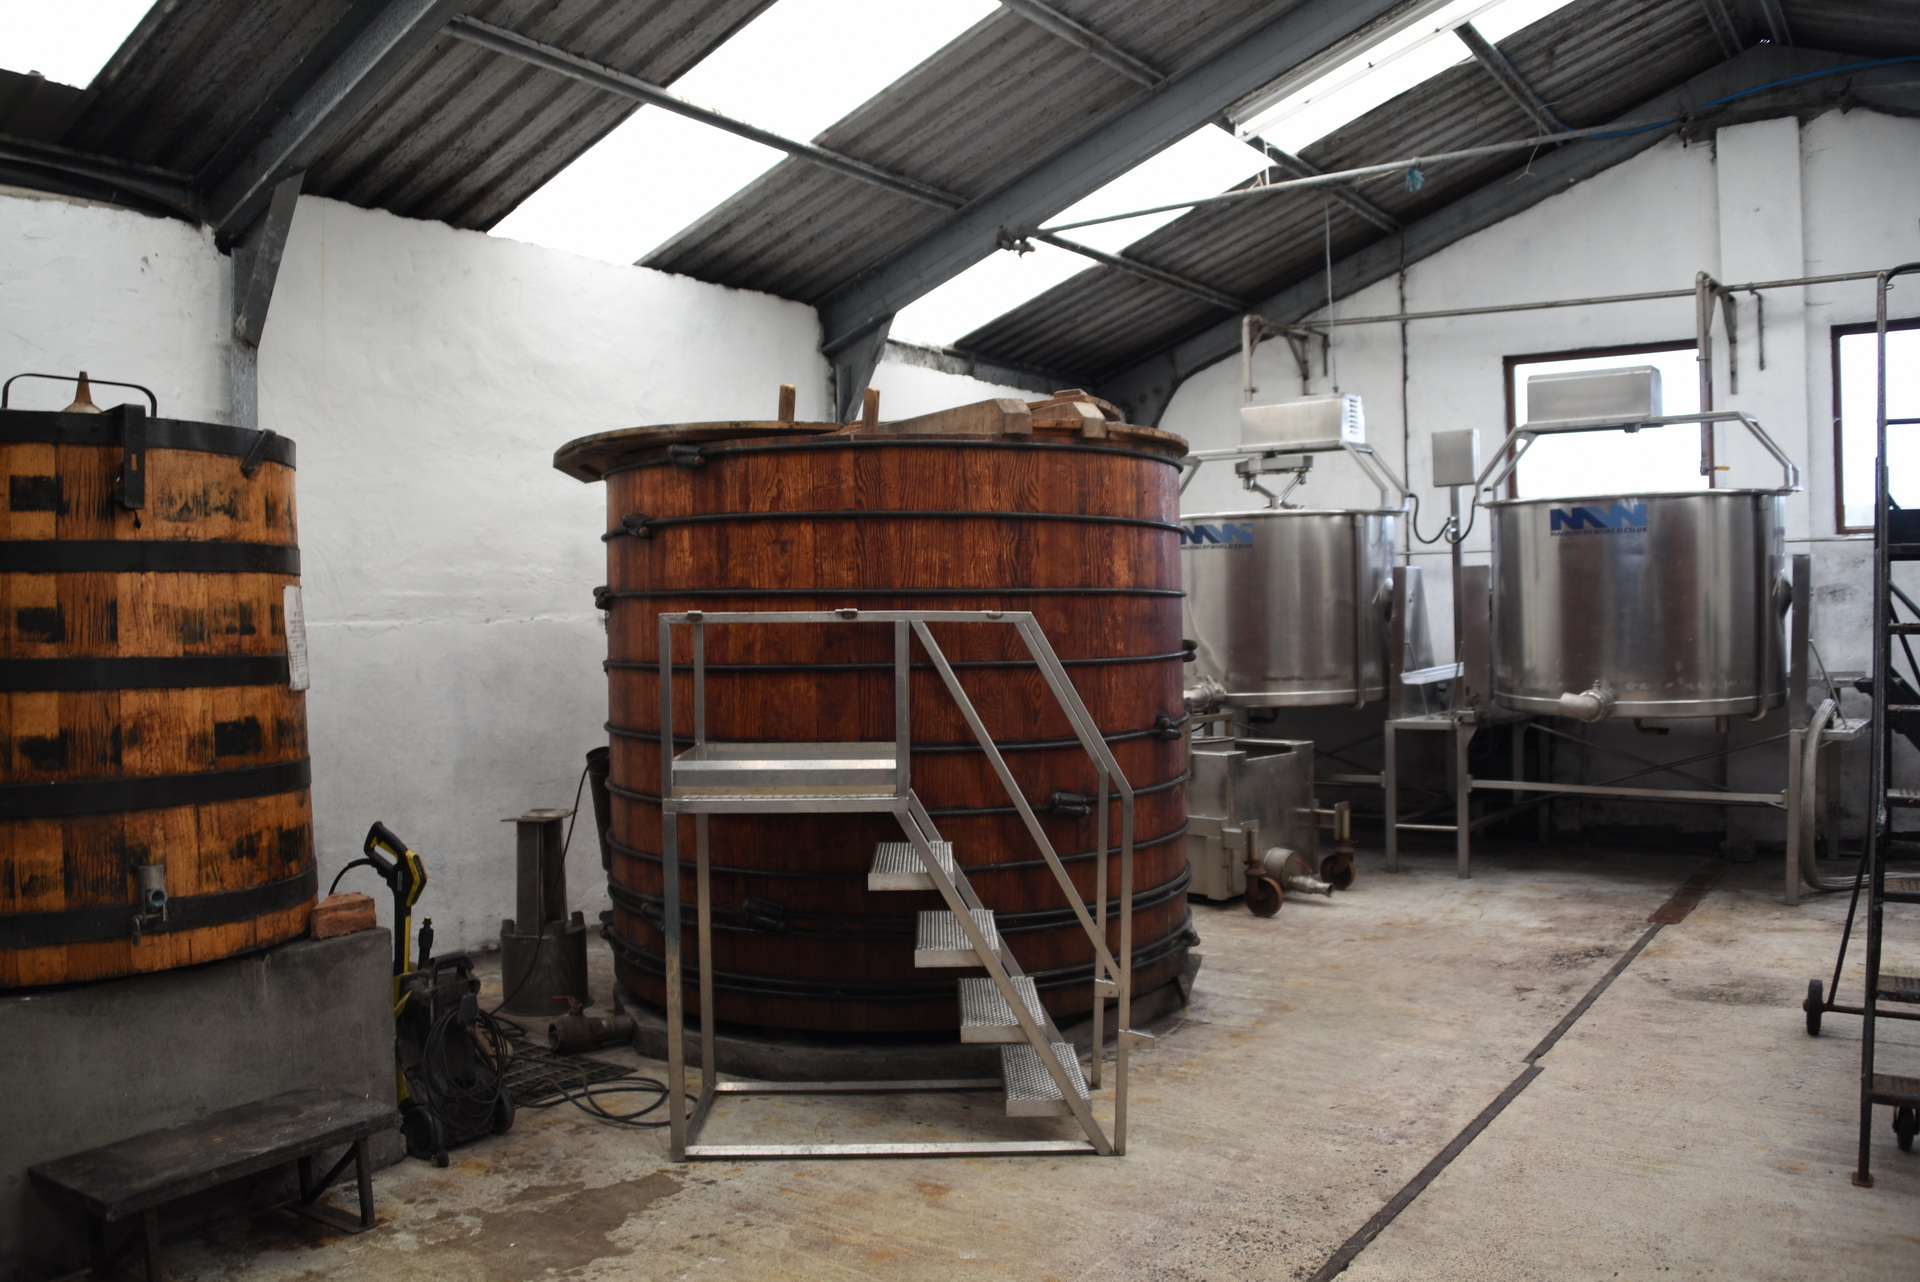
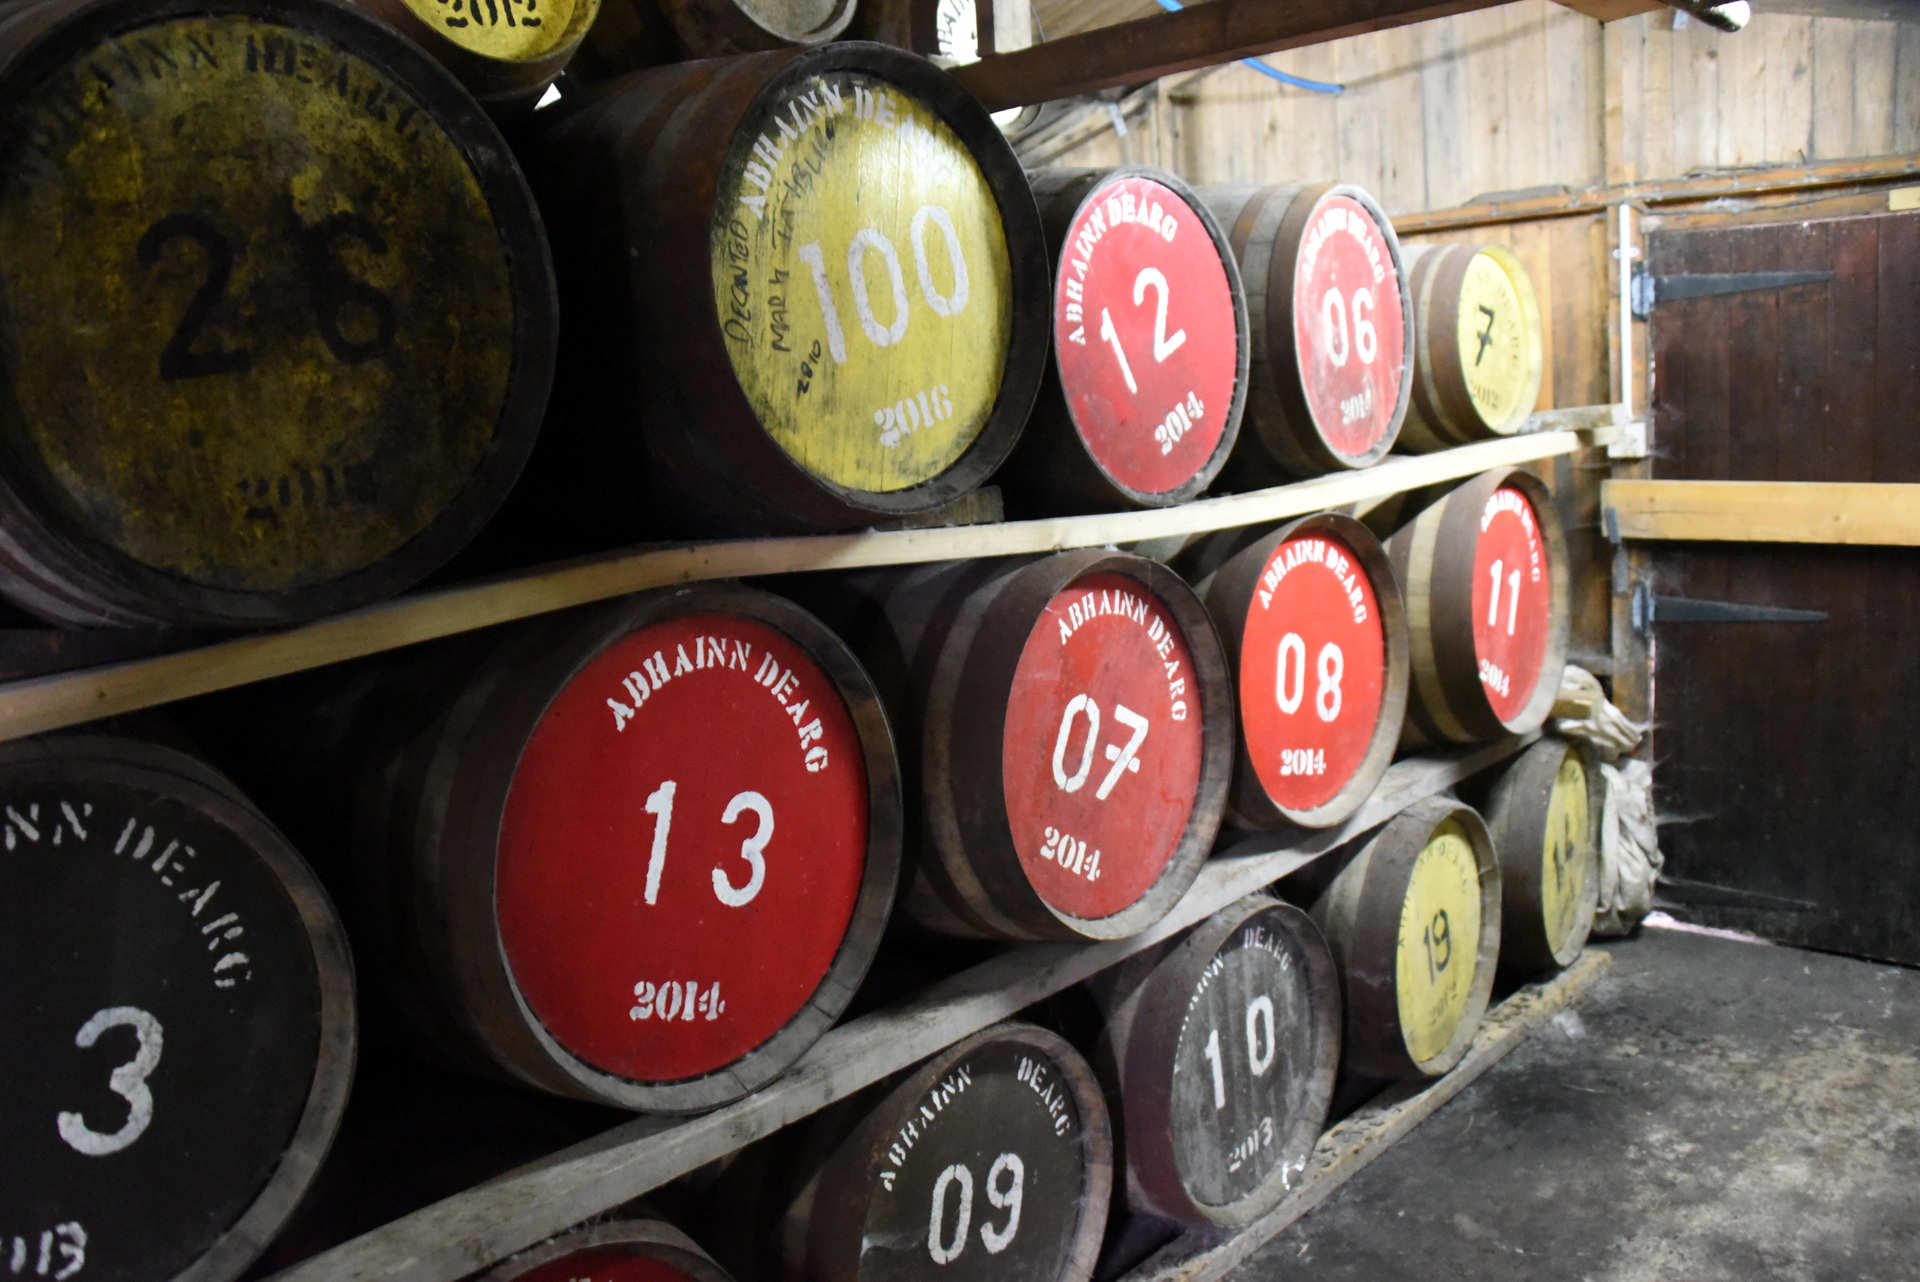
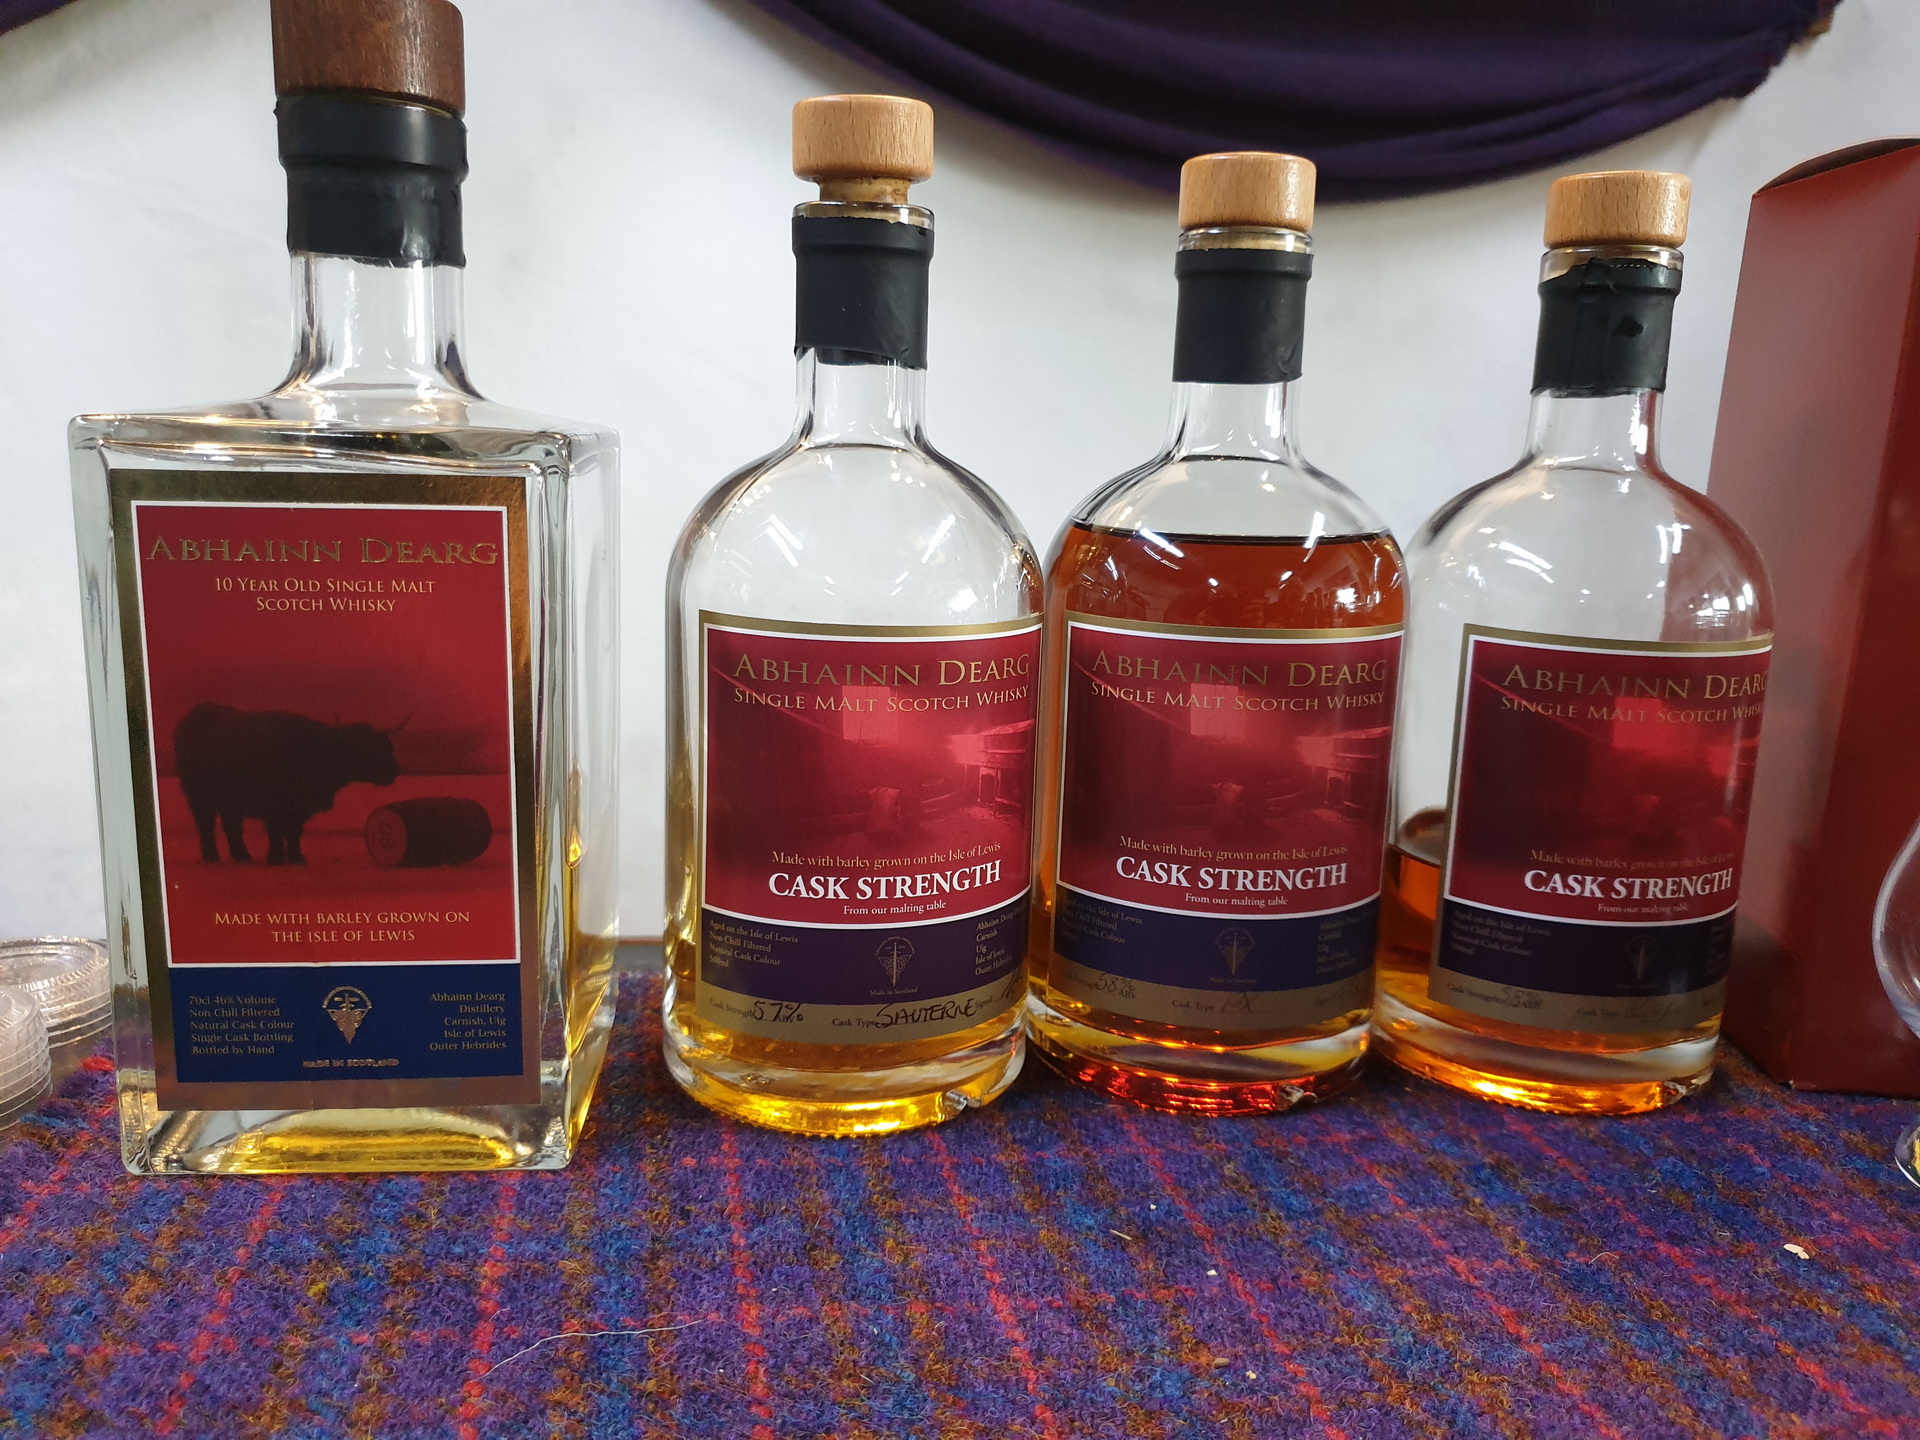
23 Juni – Abhainn Dearg Distillery (Isle of Lewis)
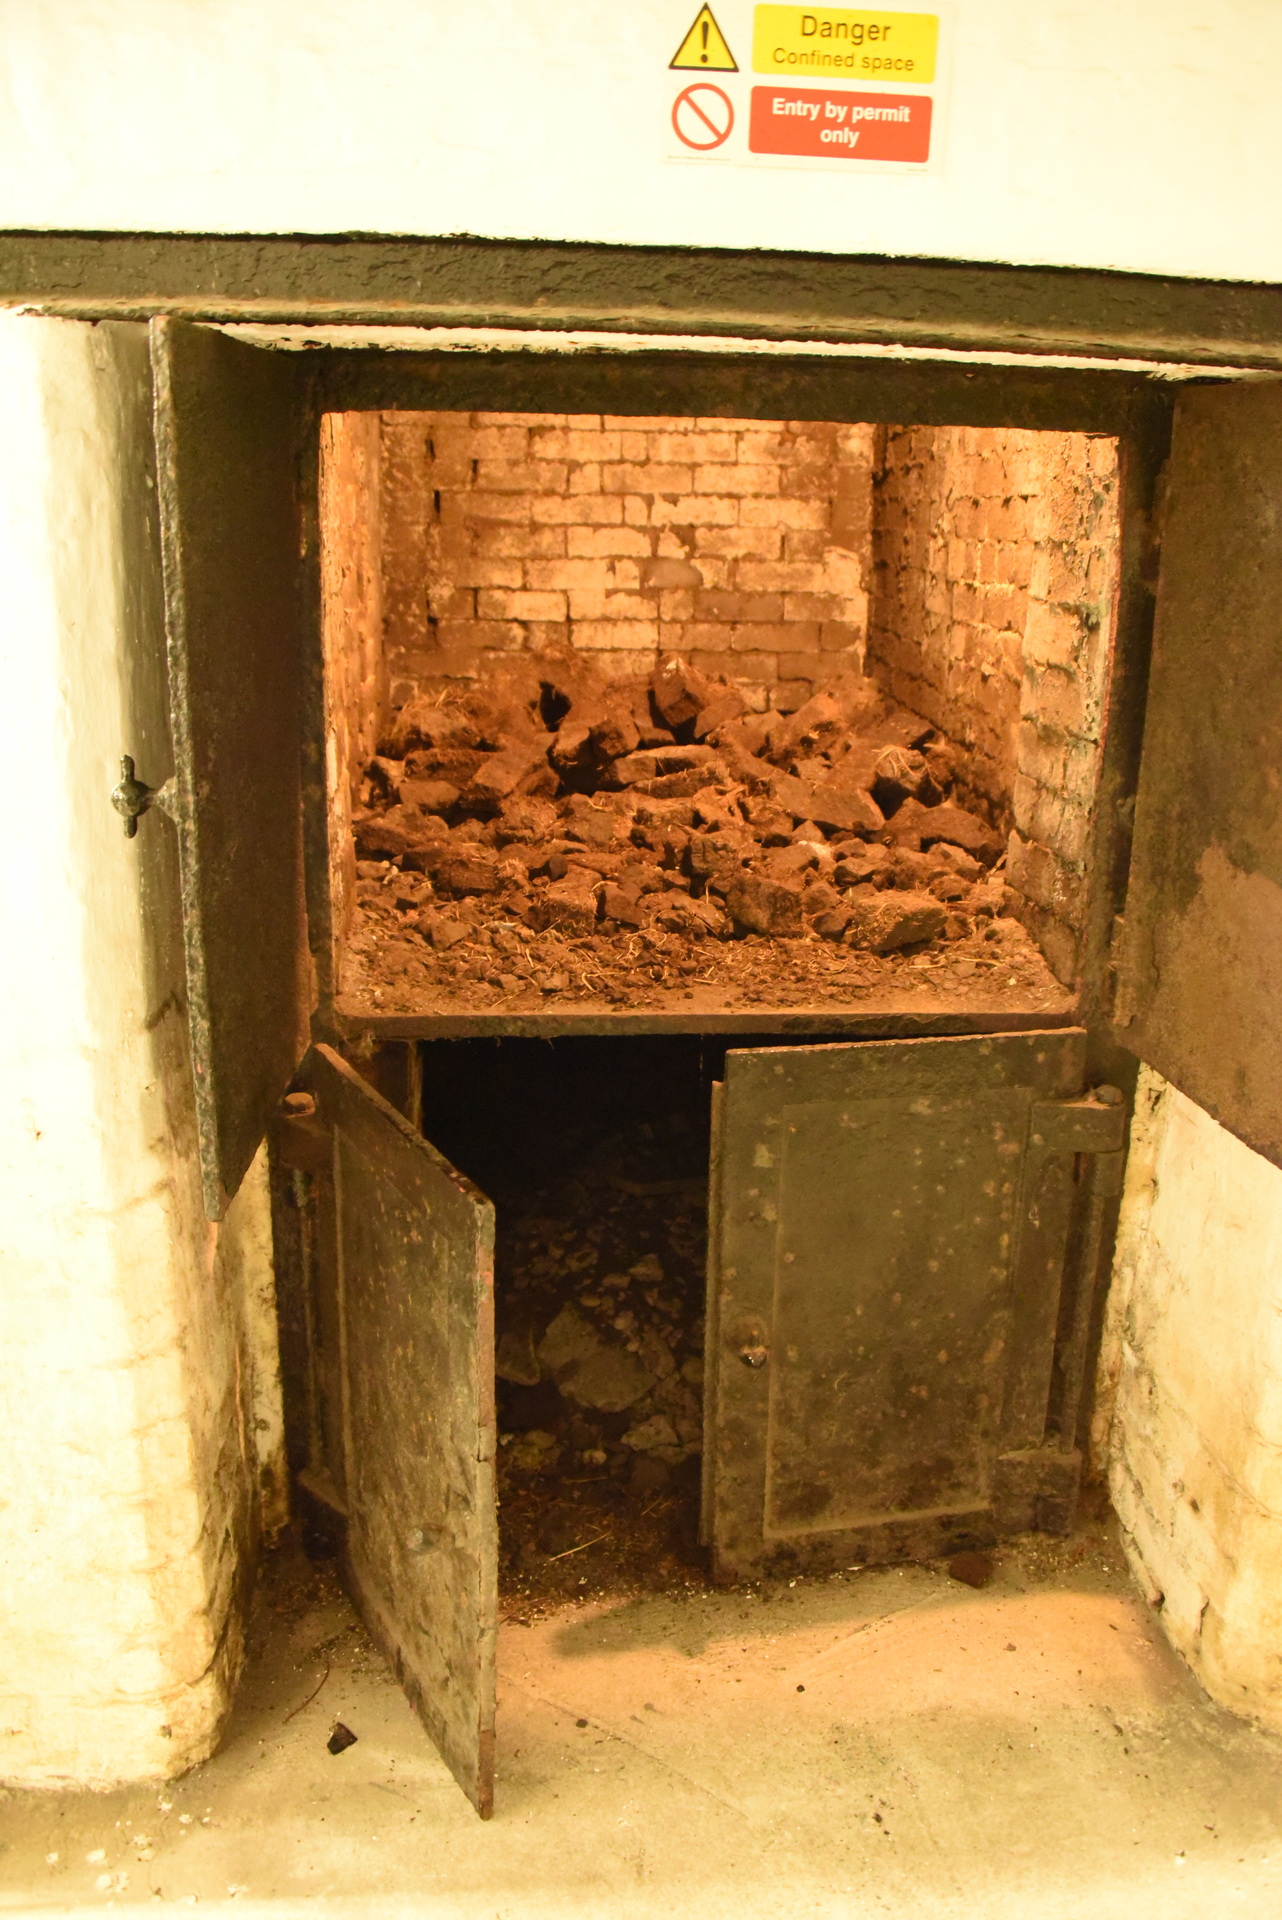
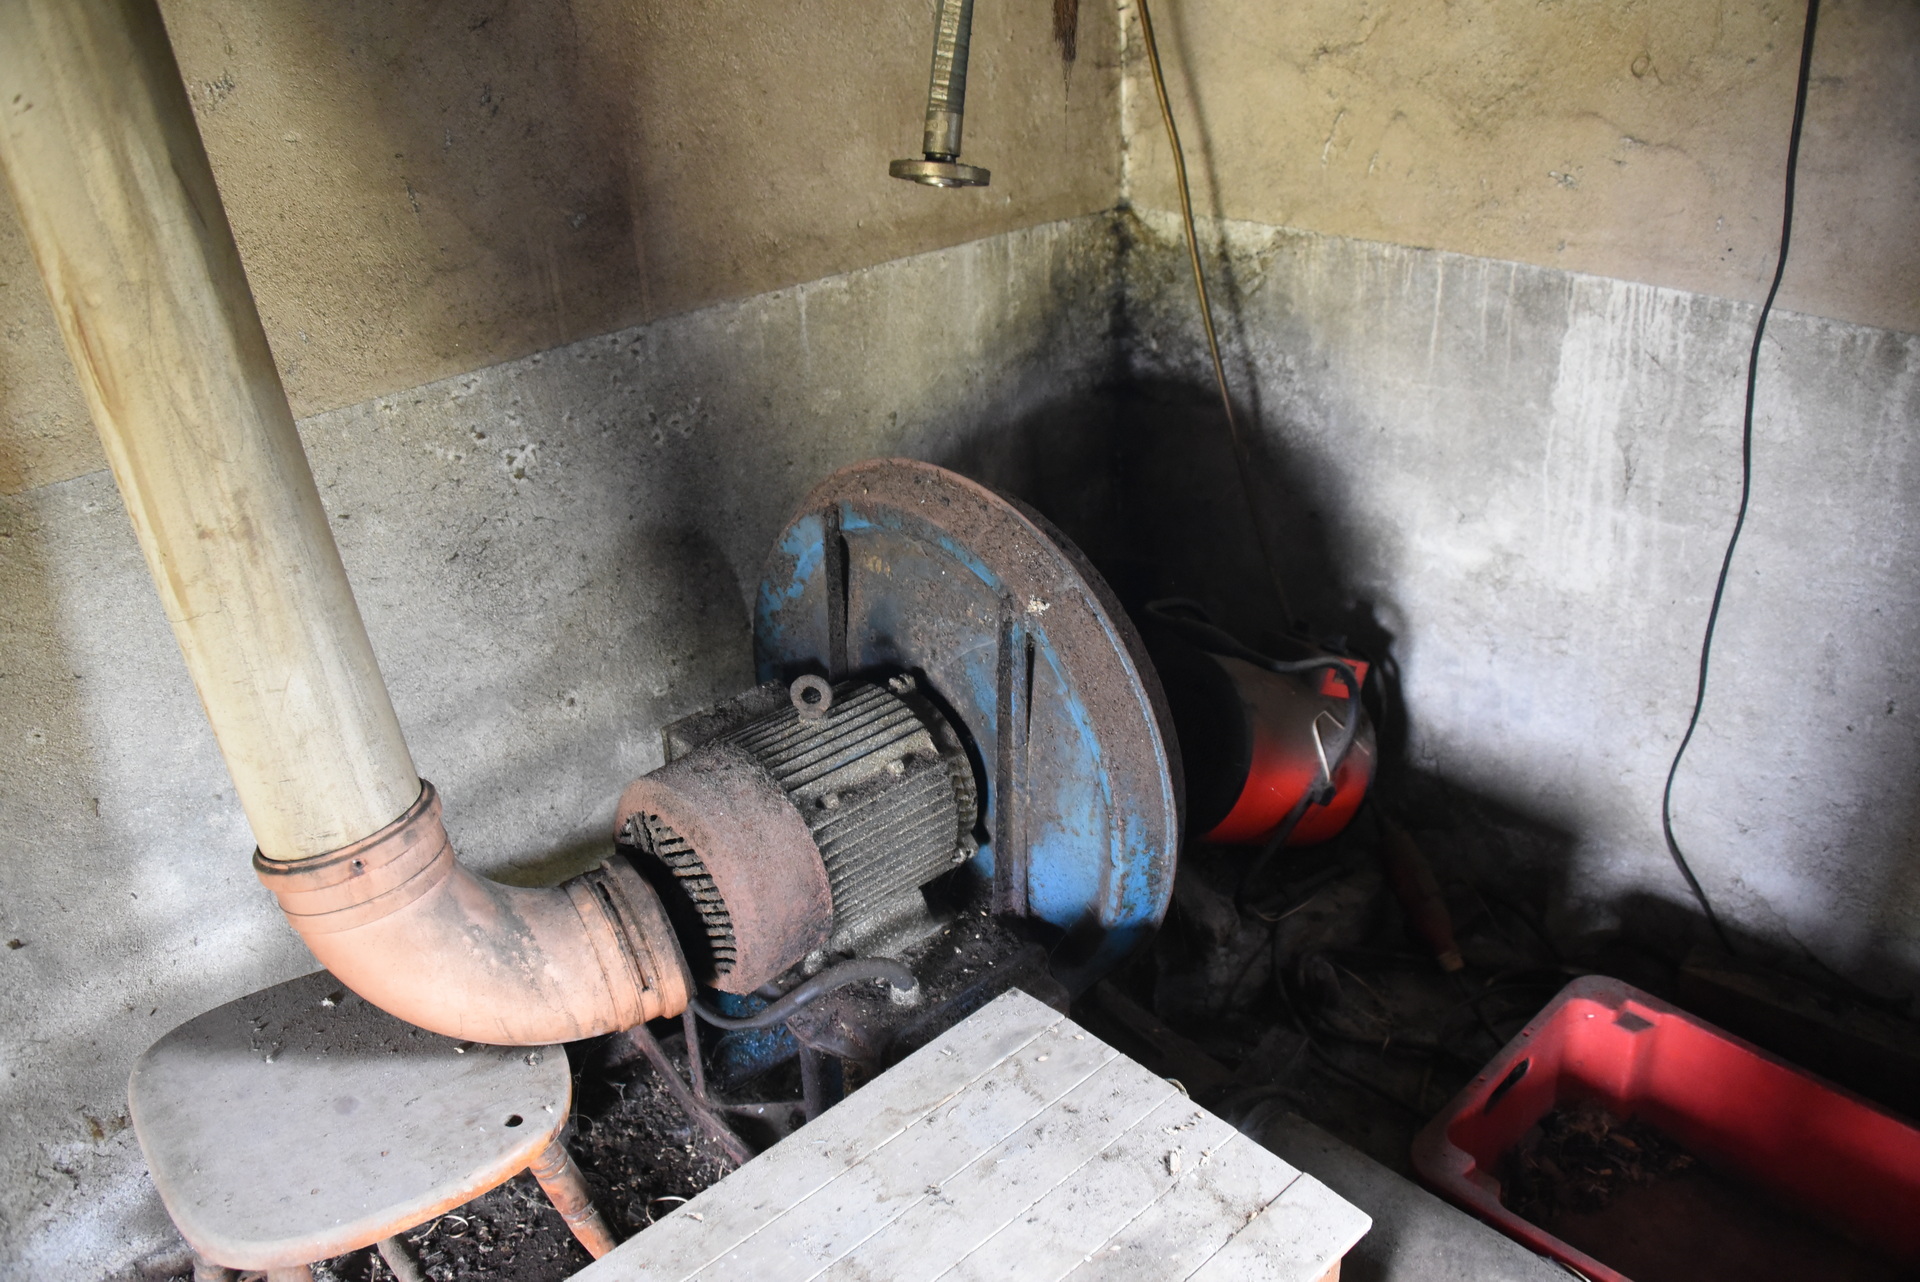
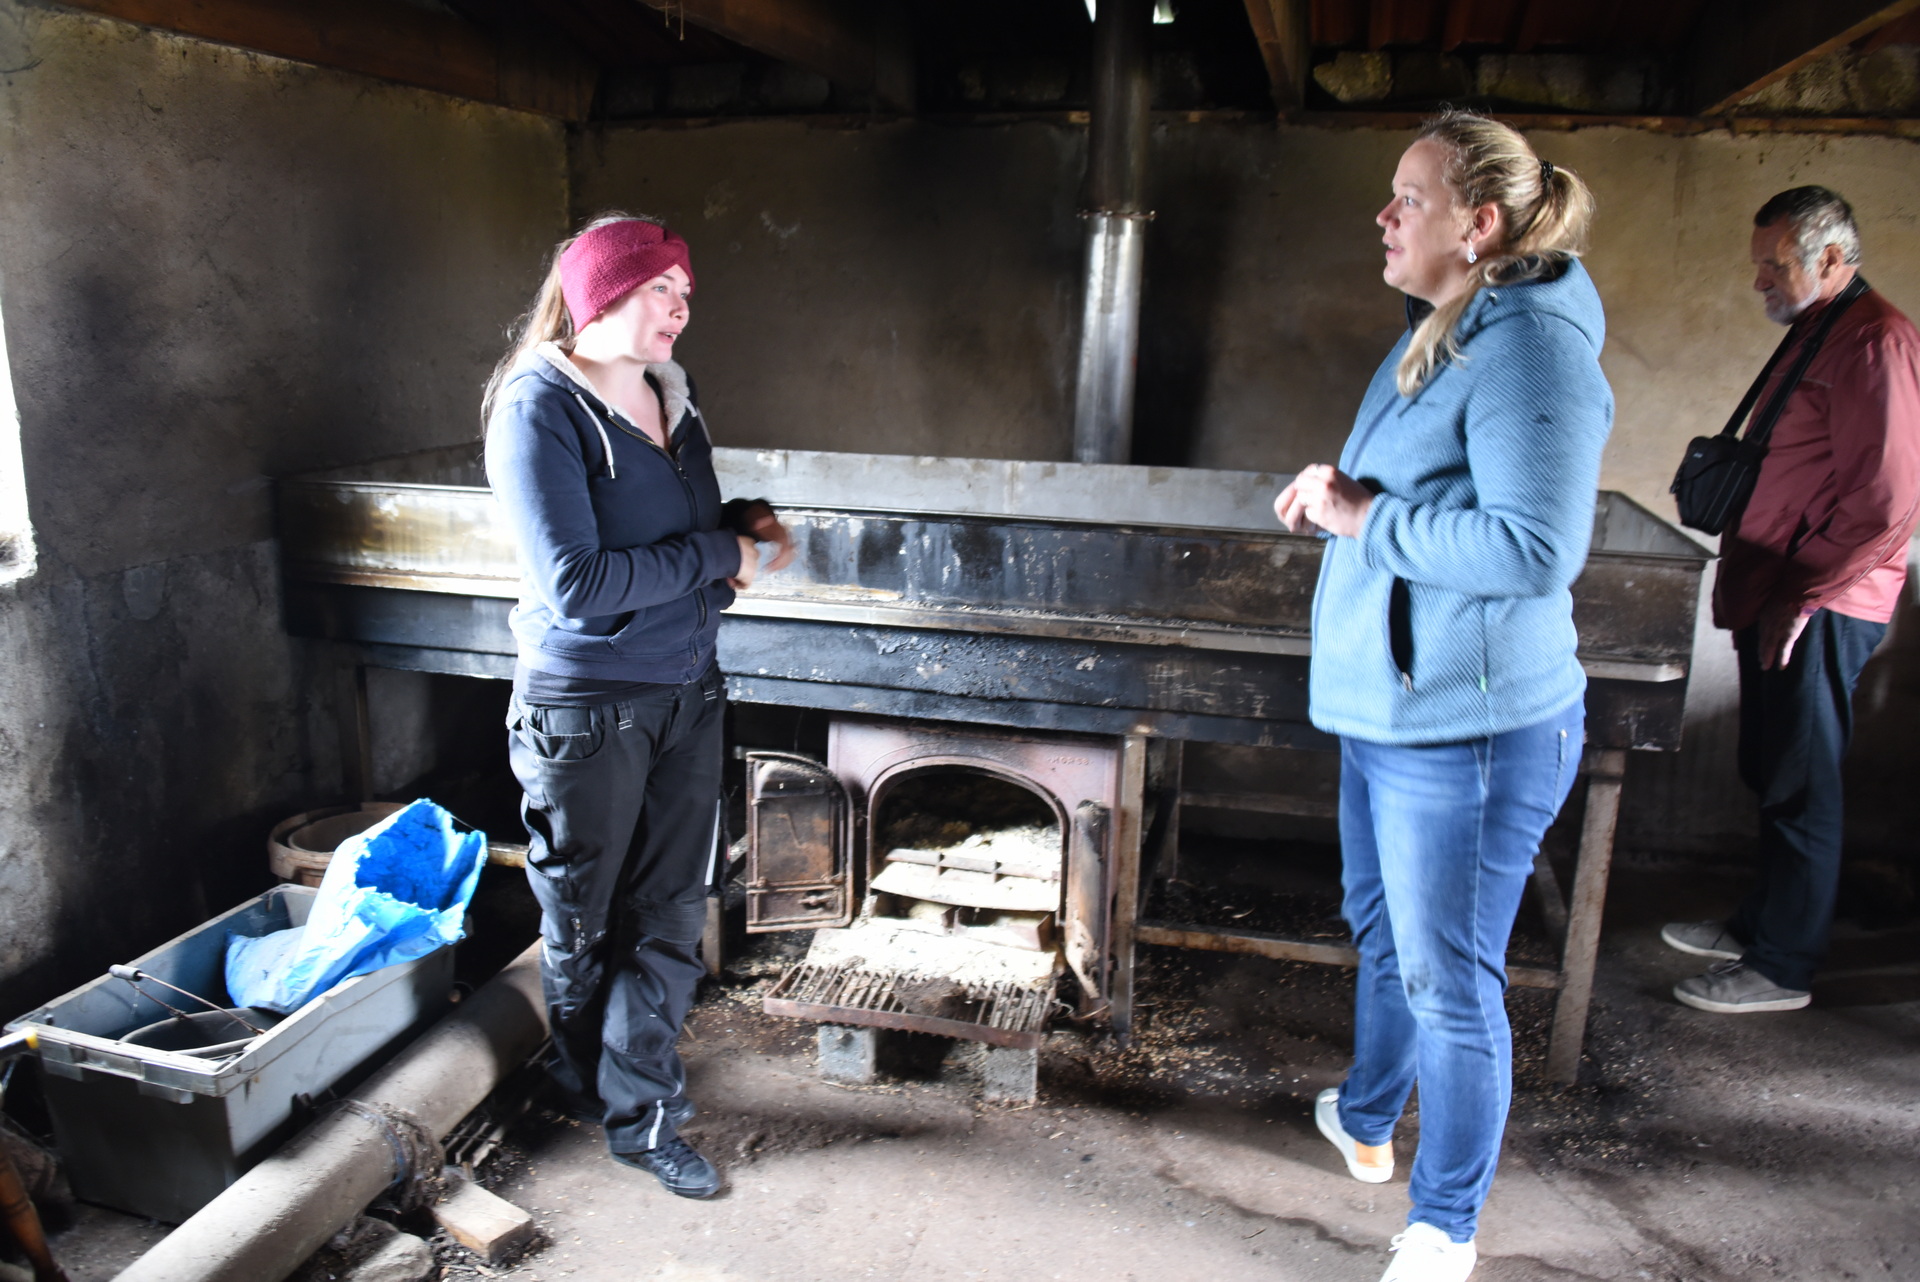
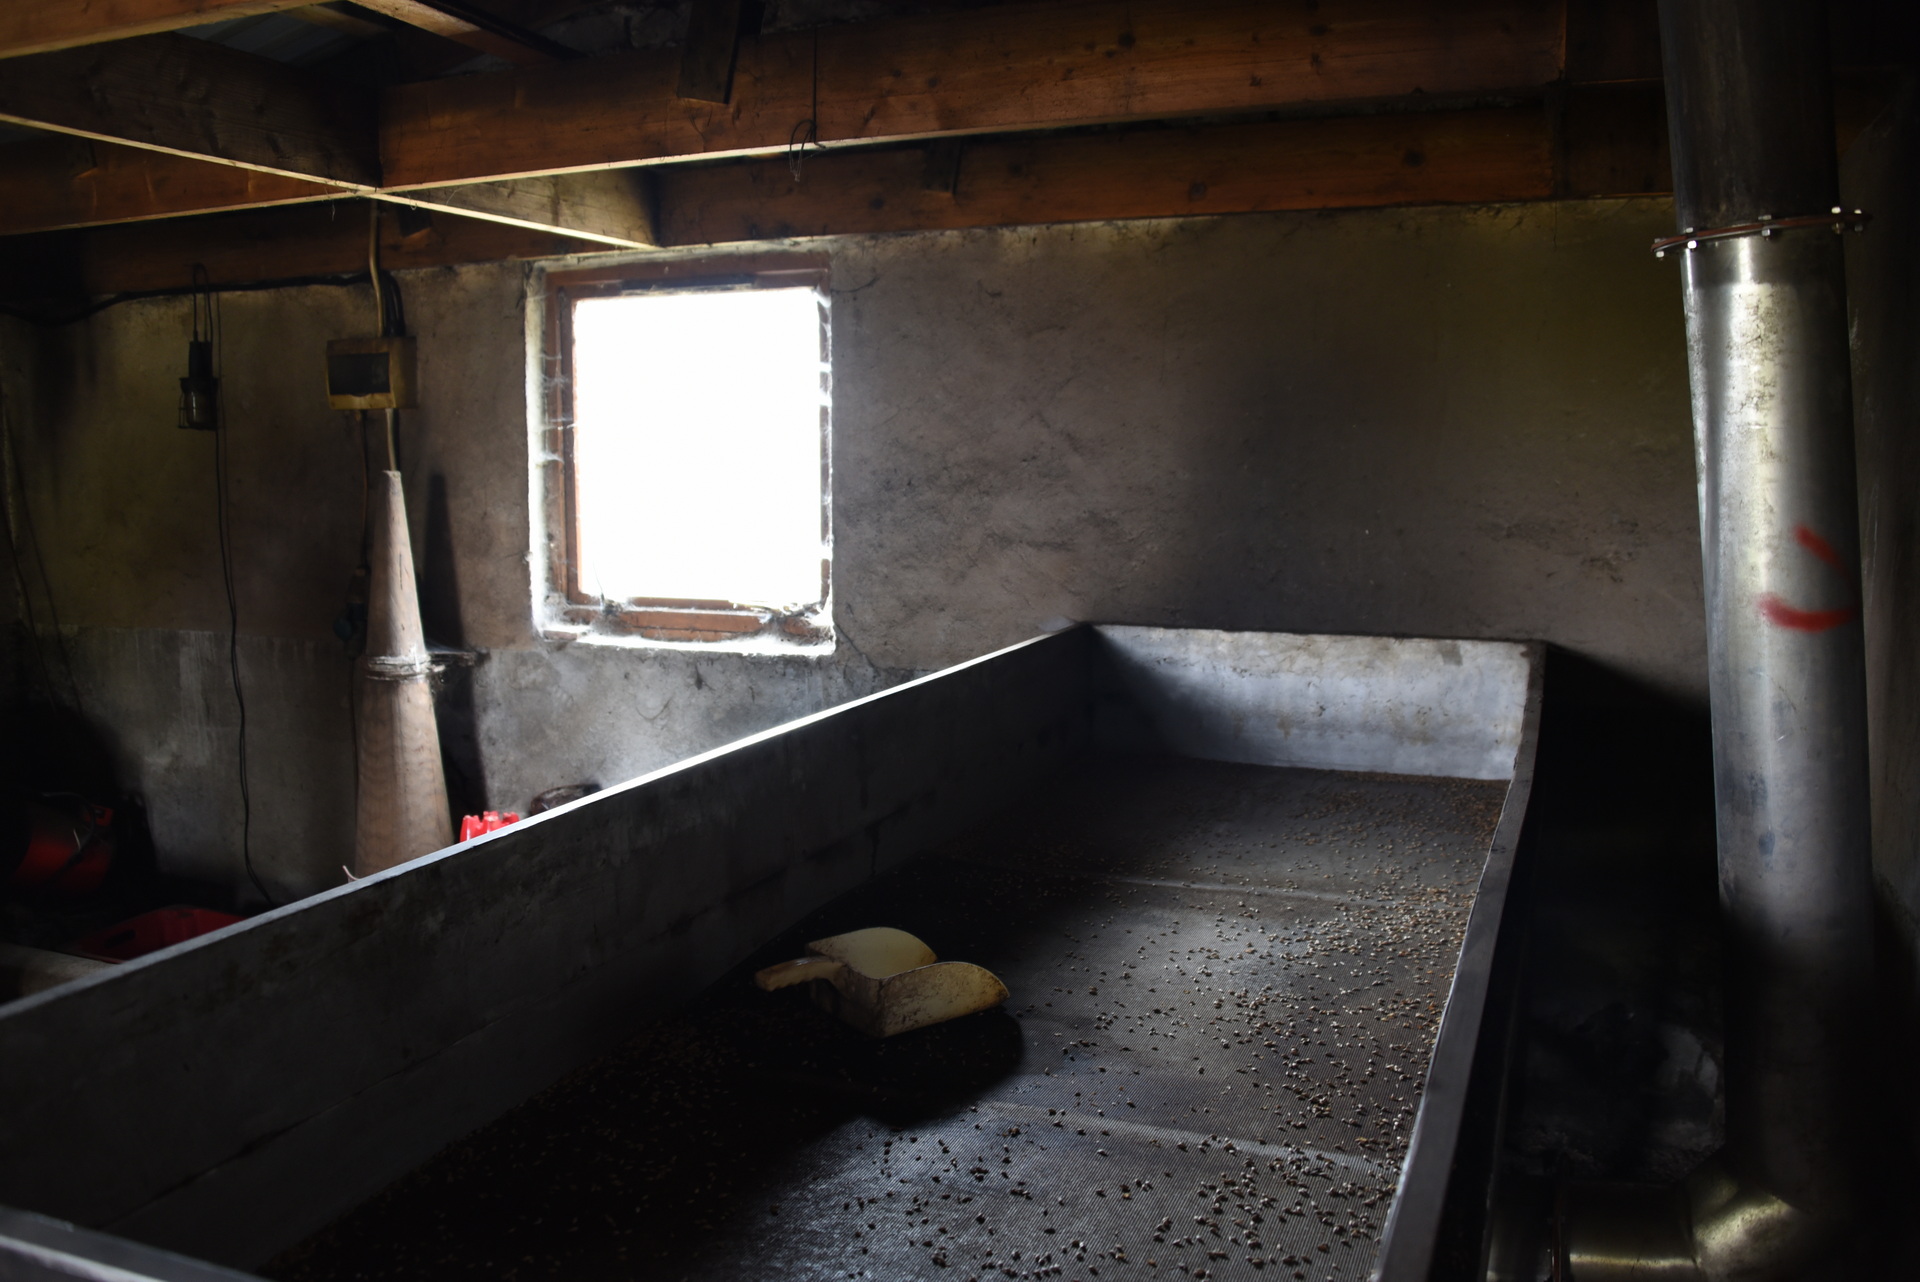
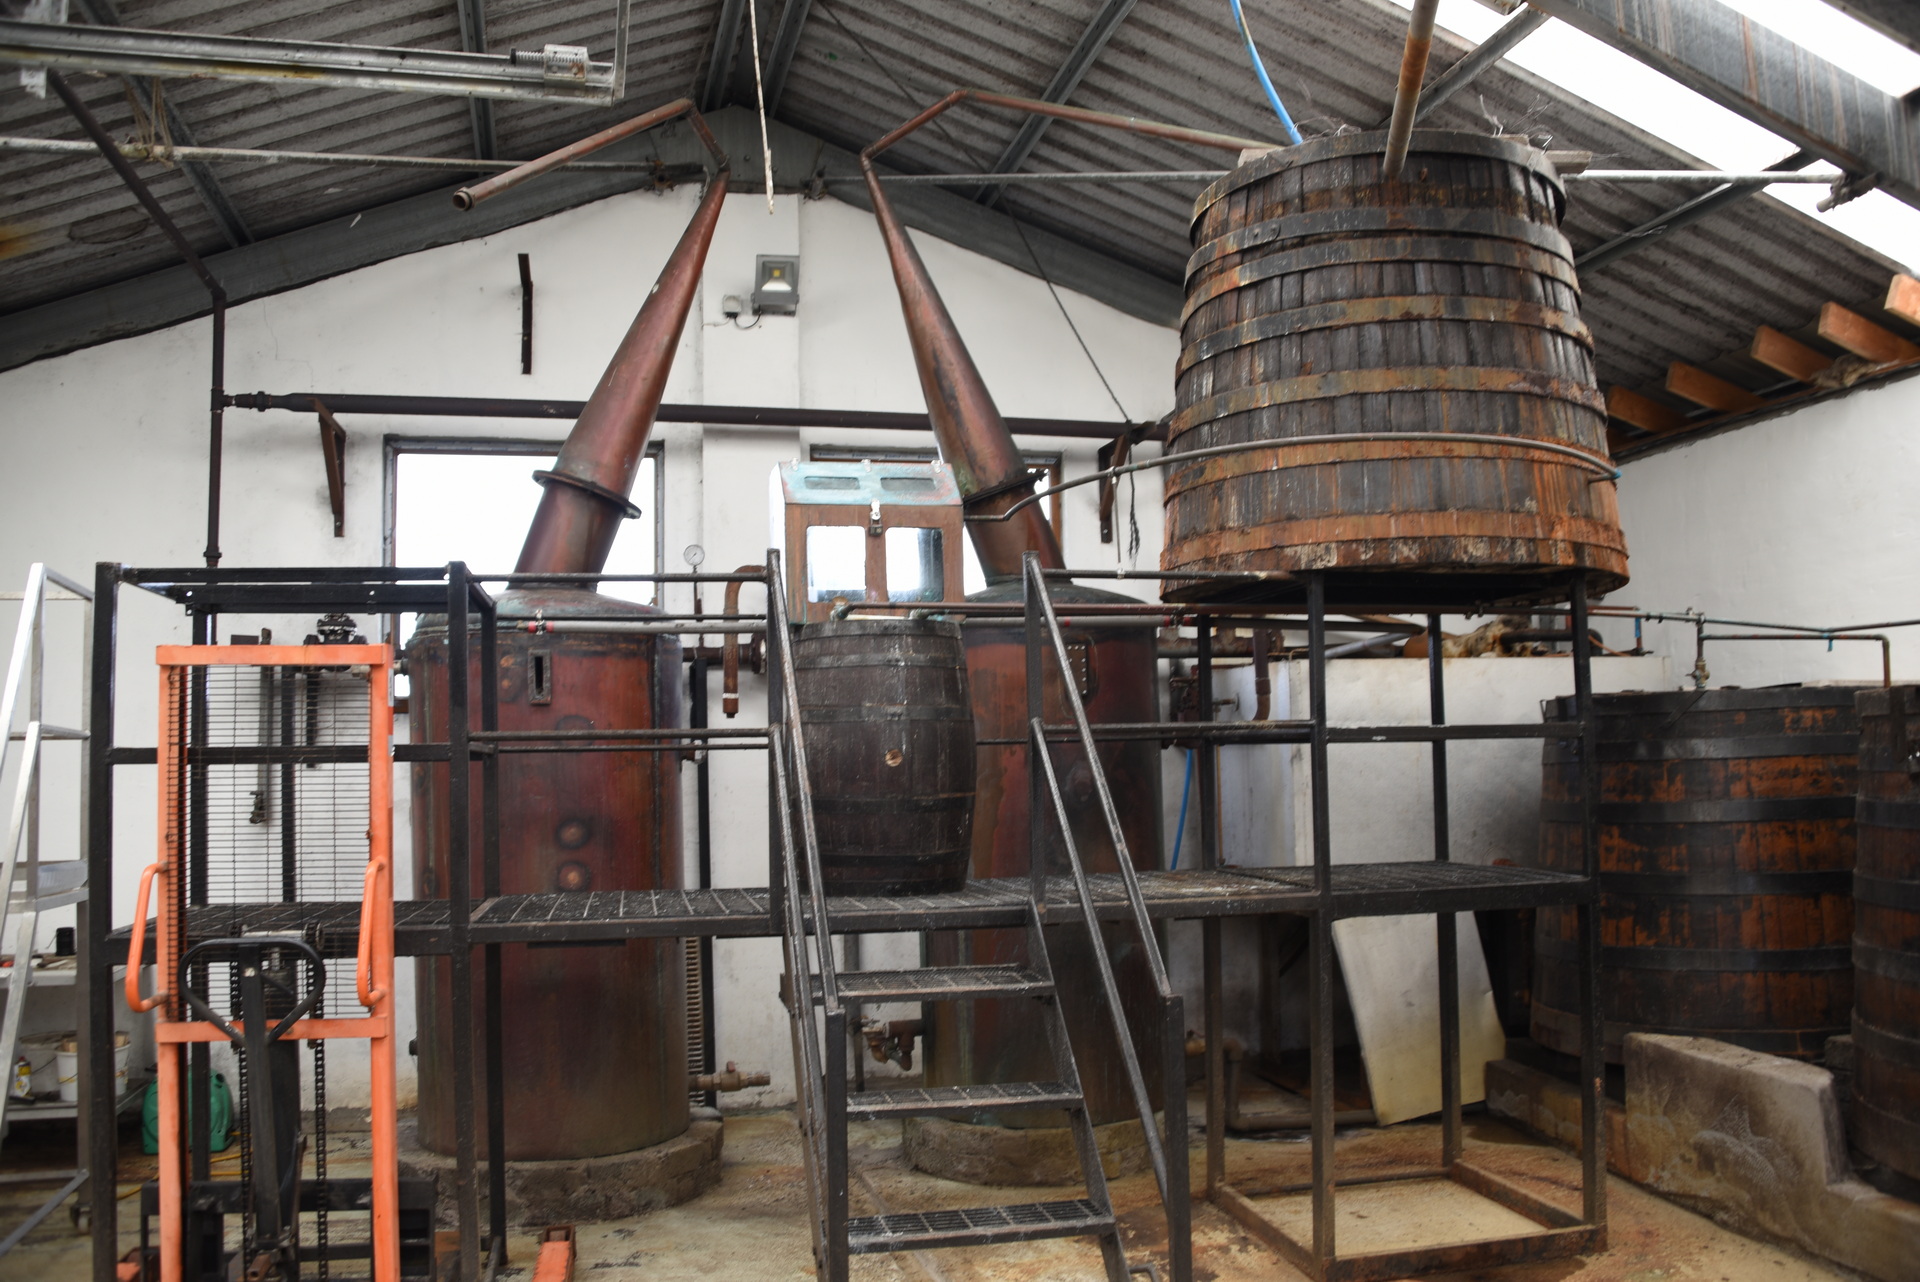
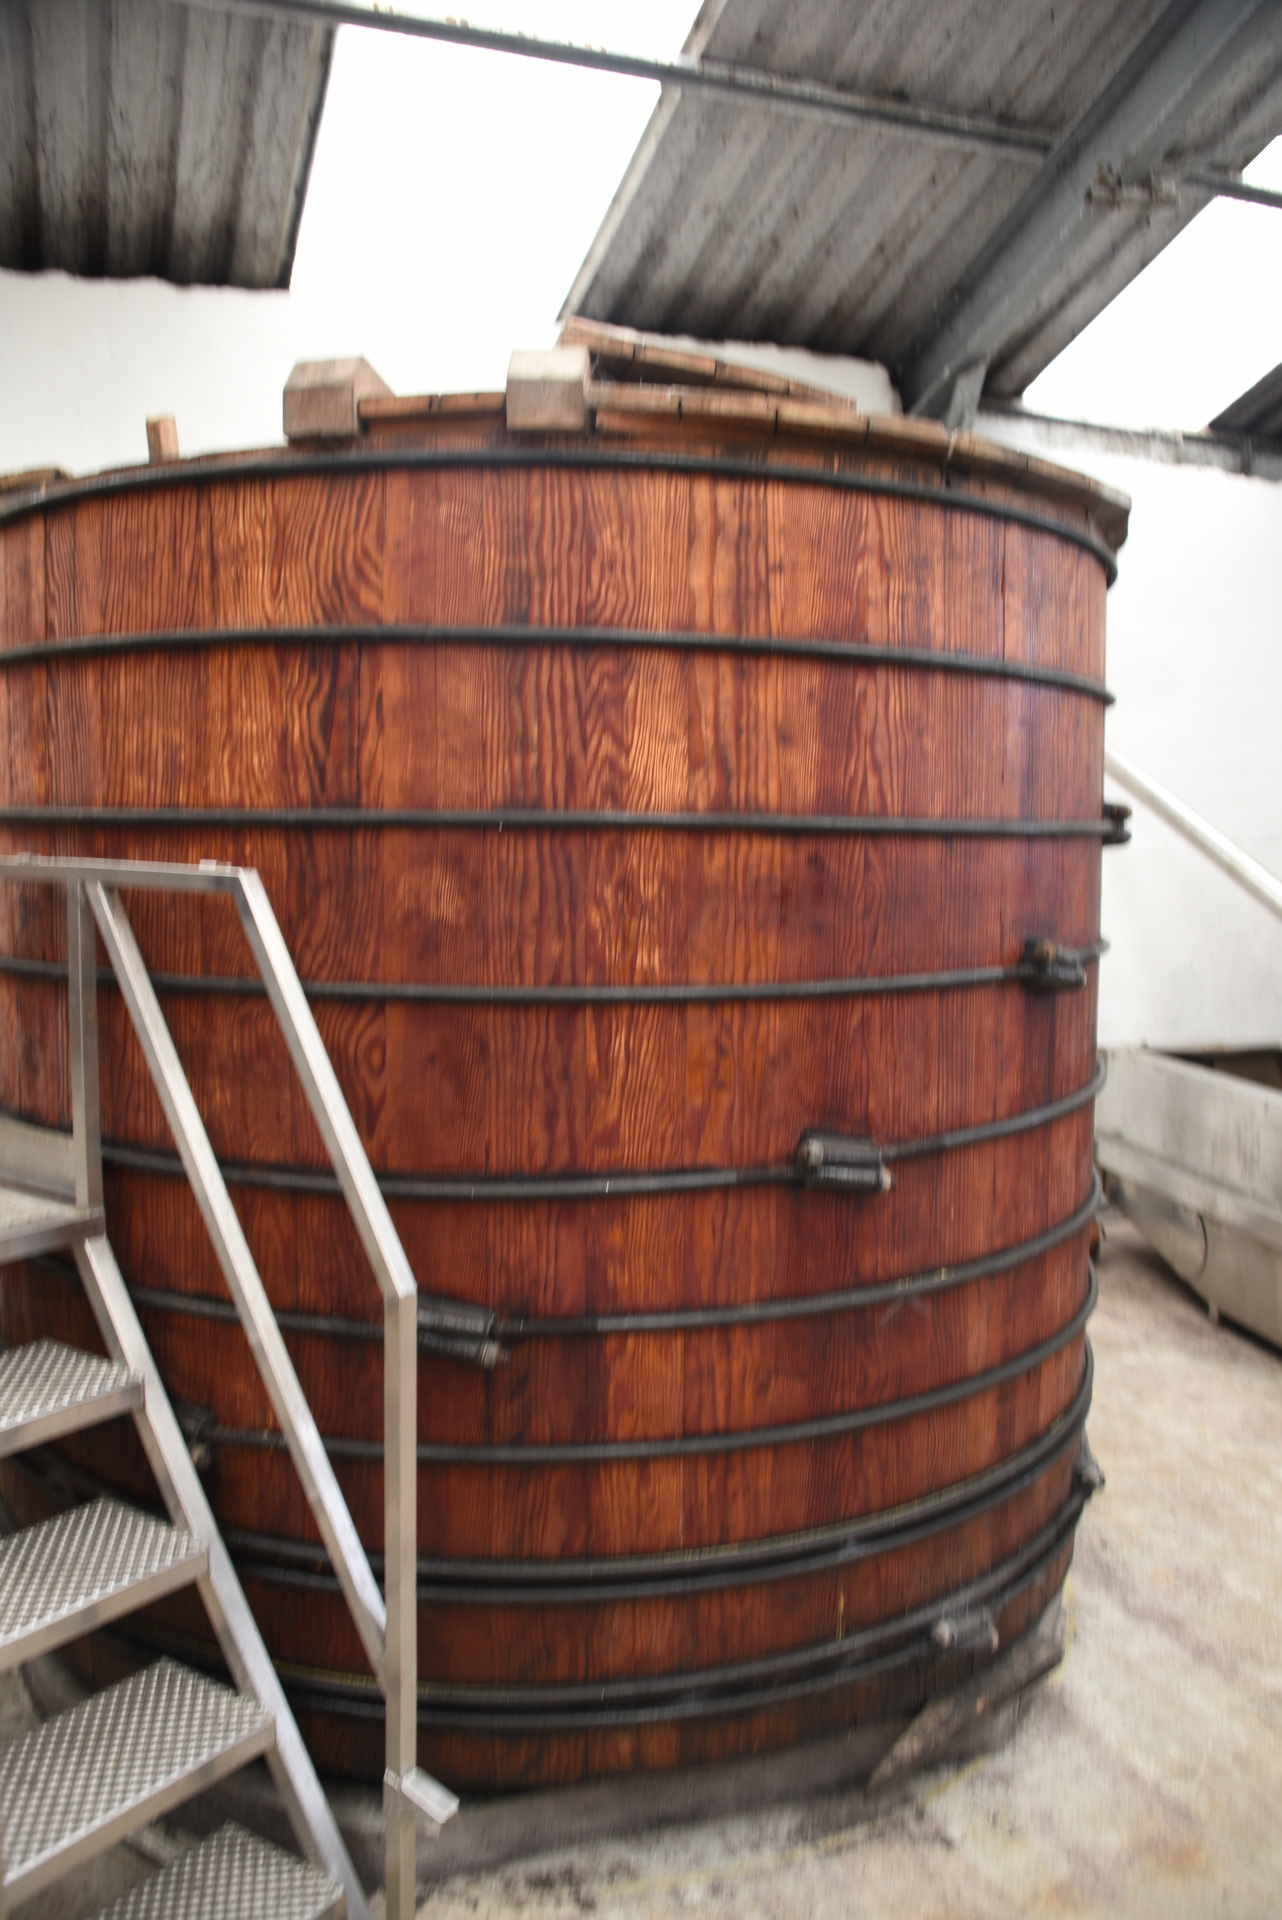
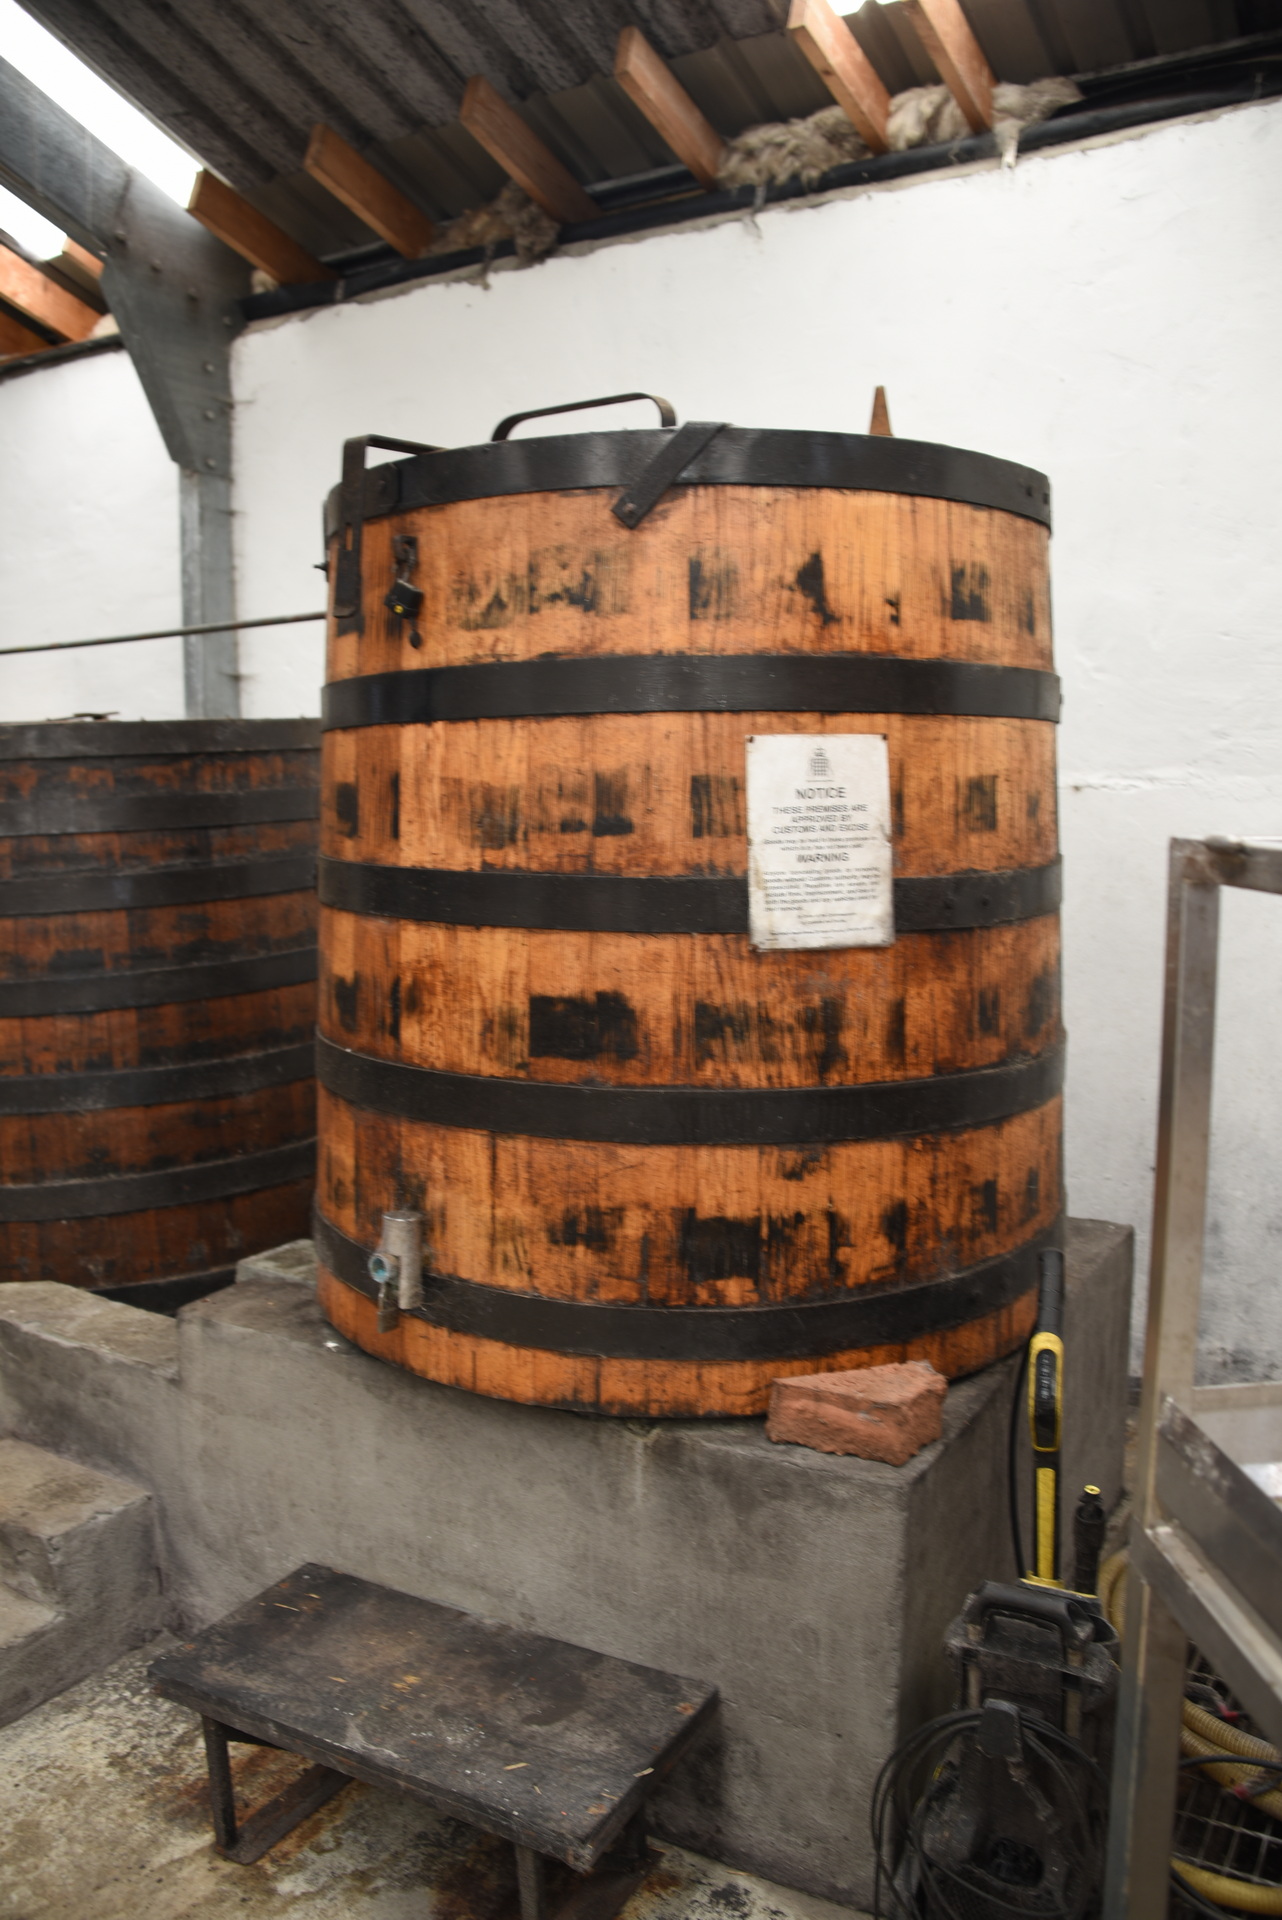
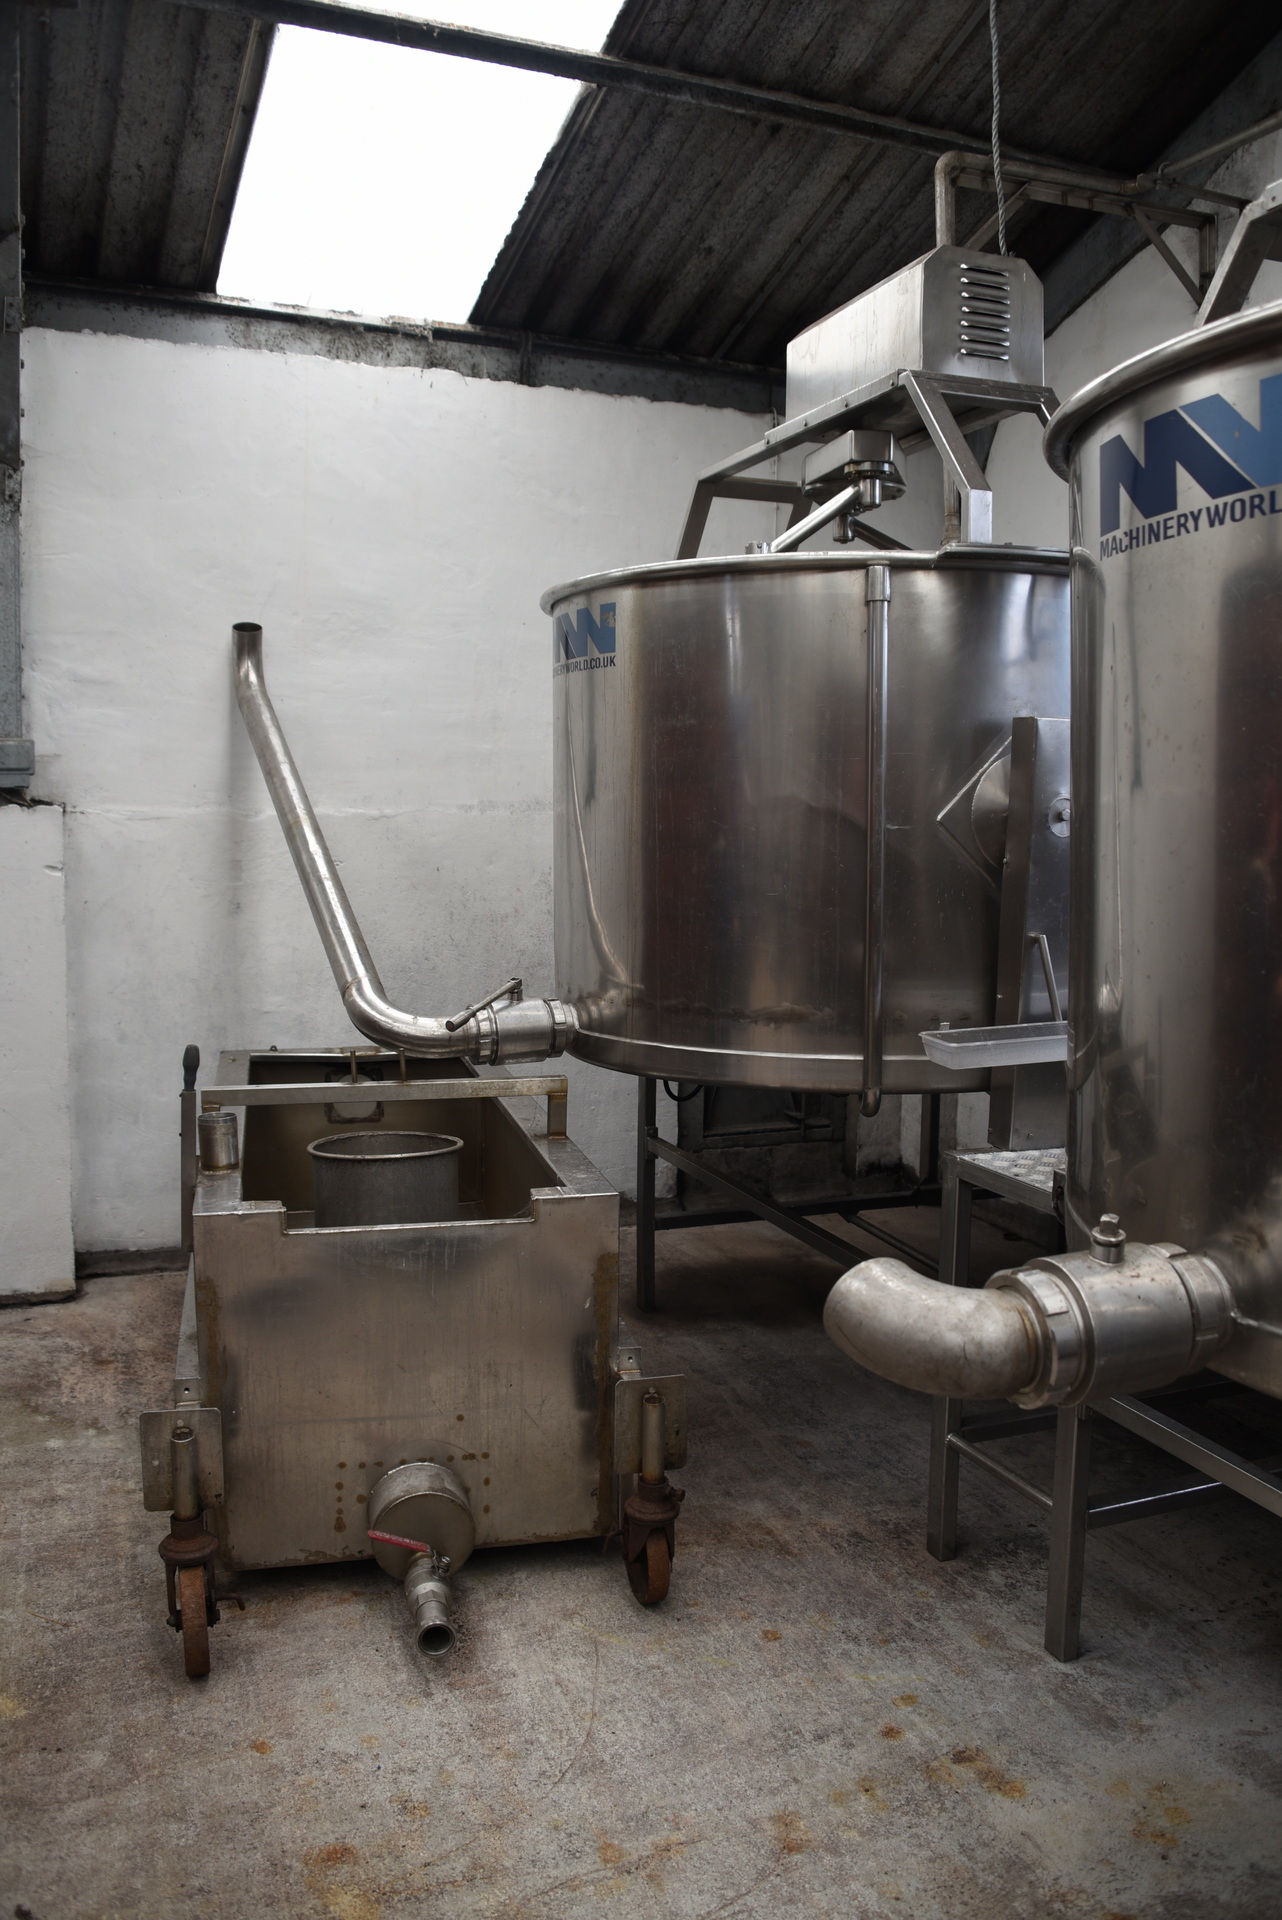
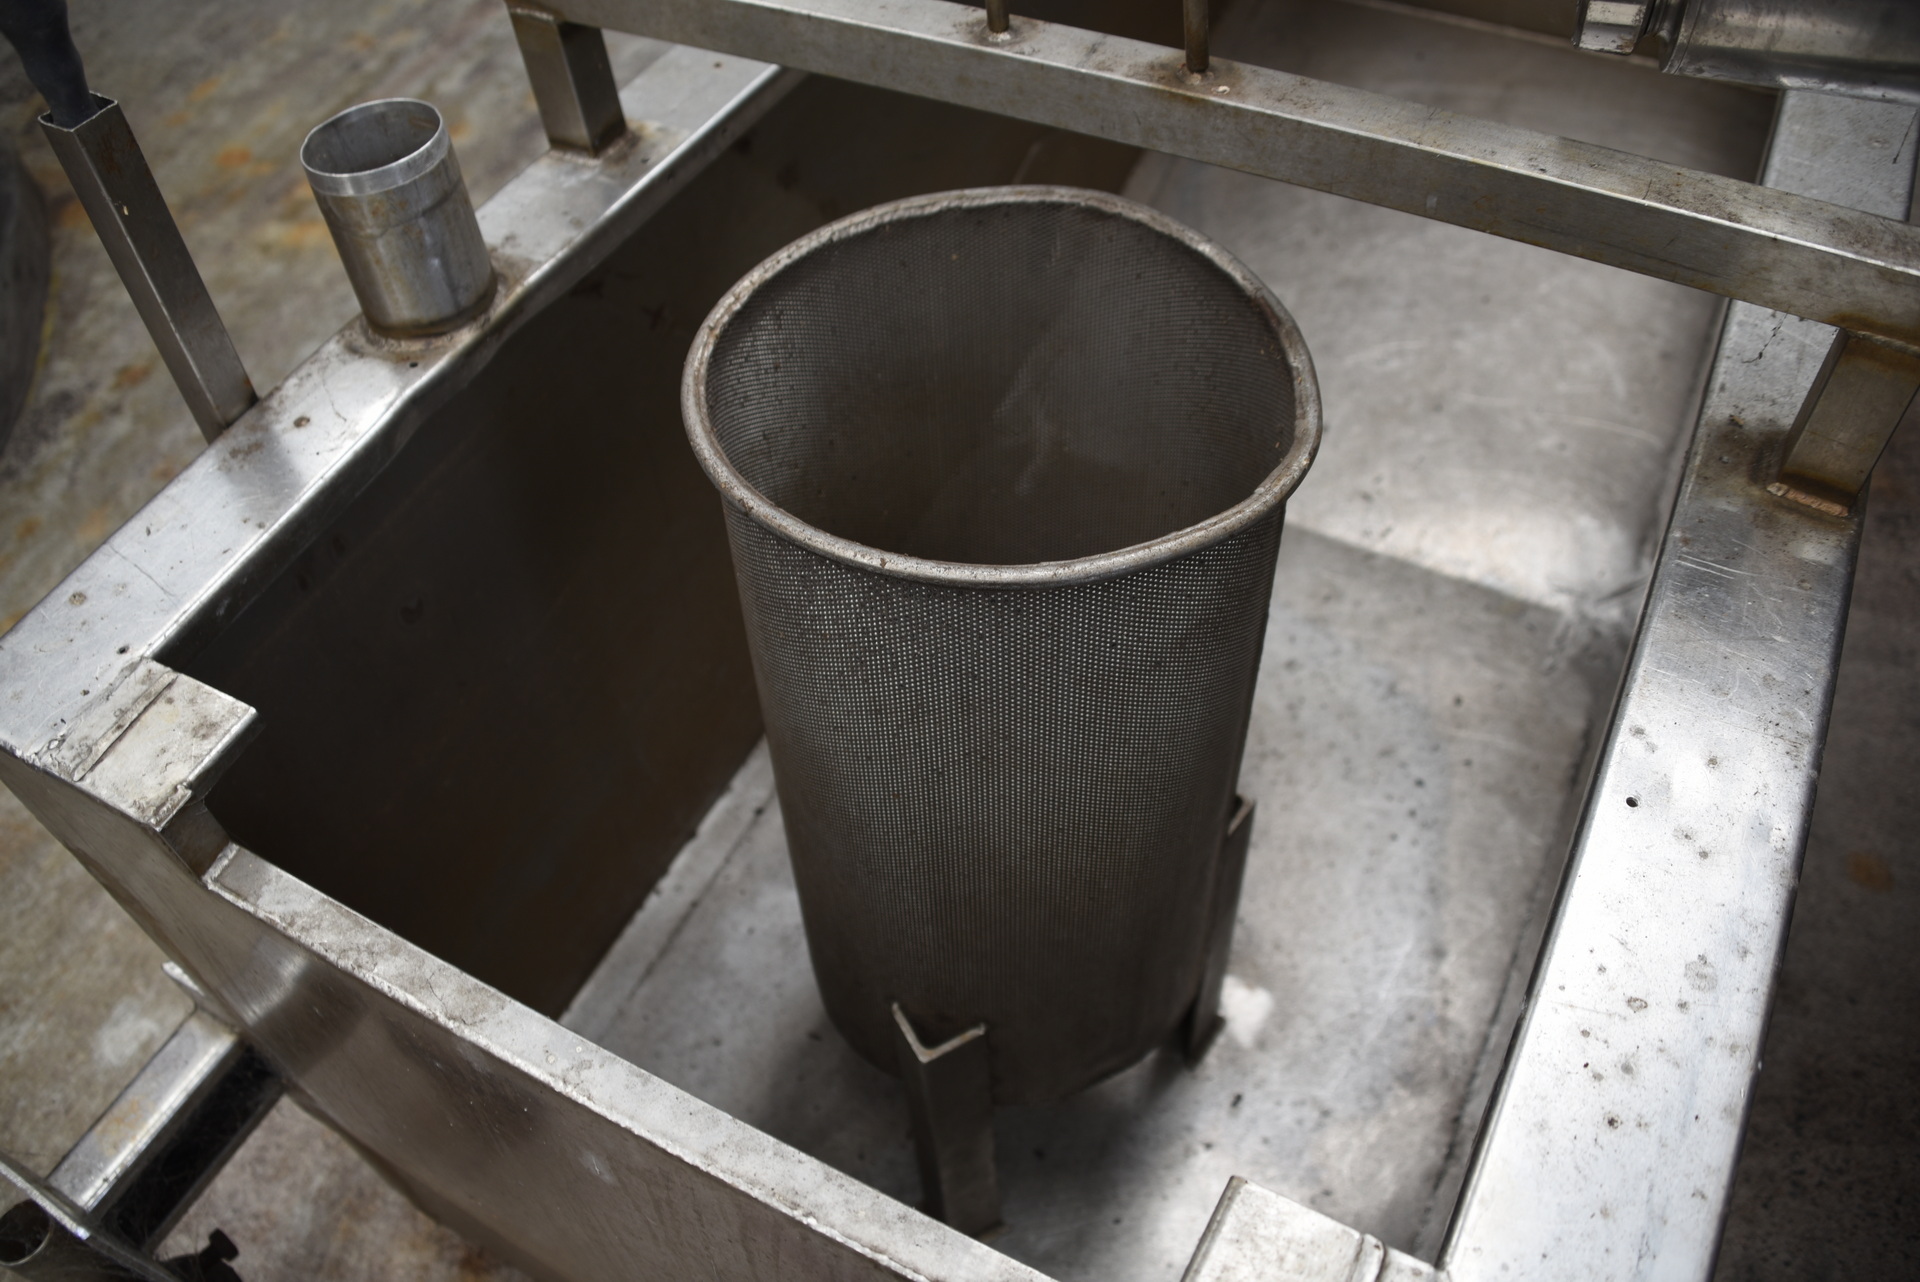
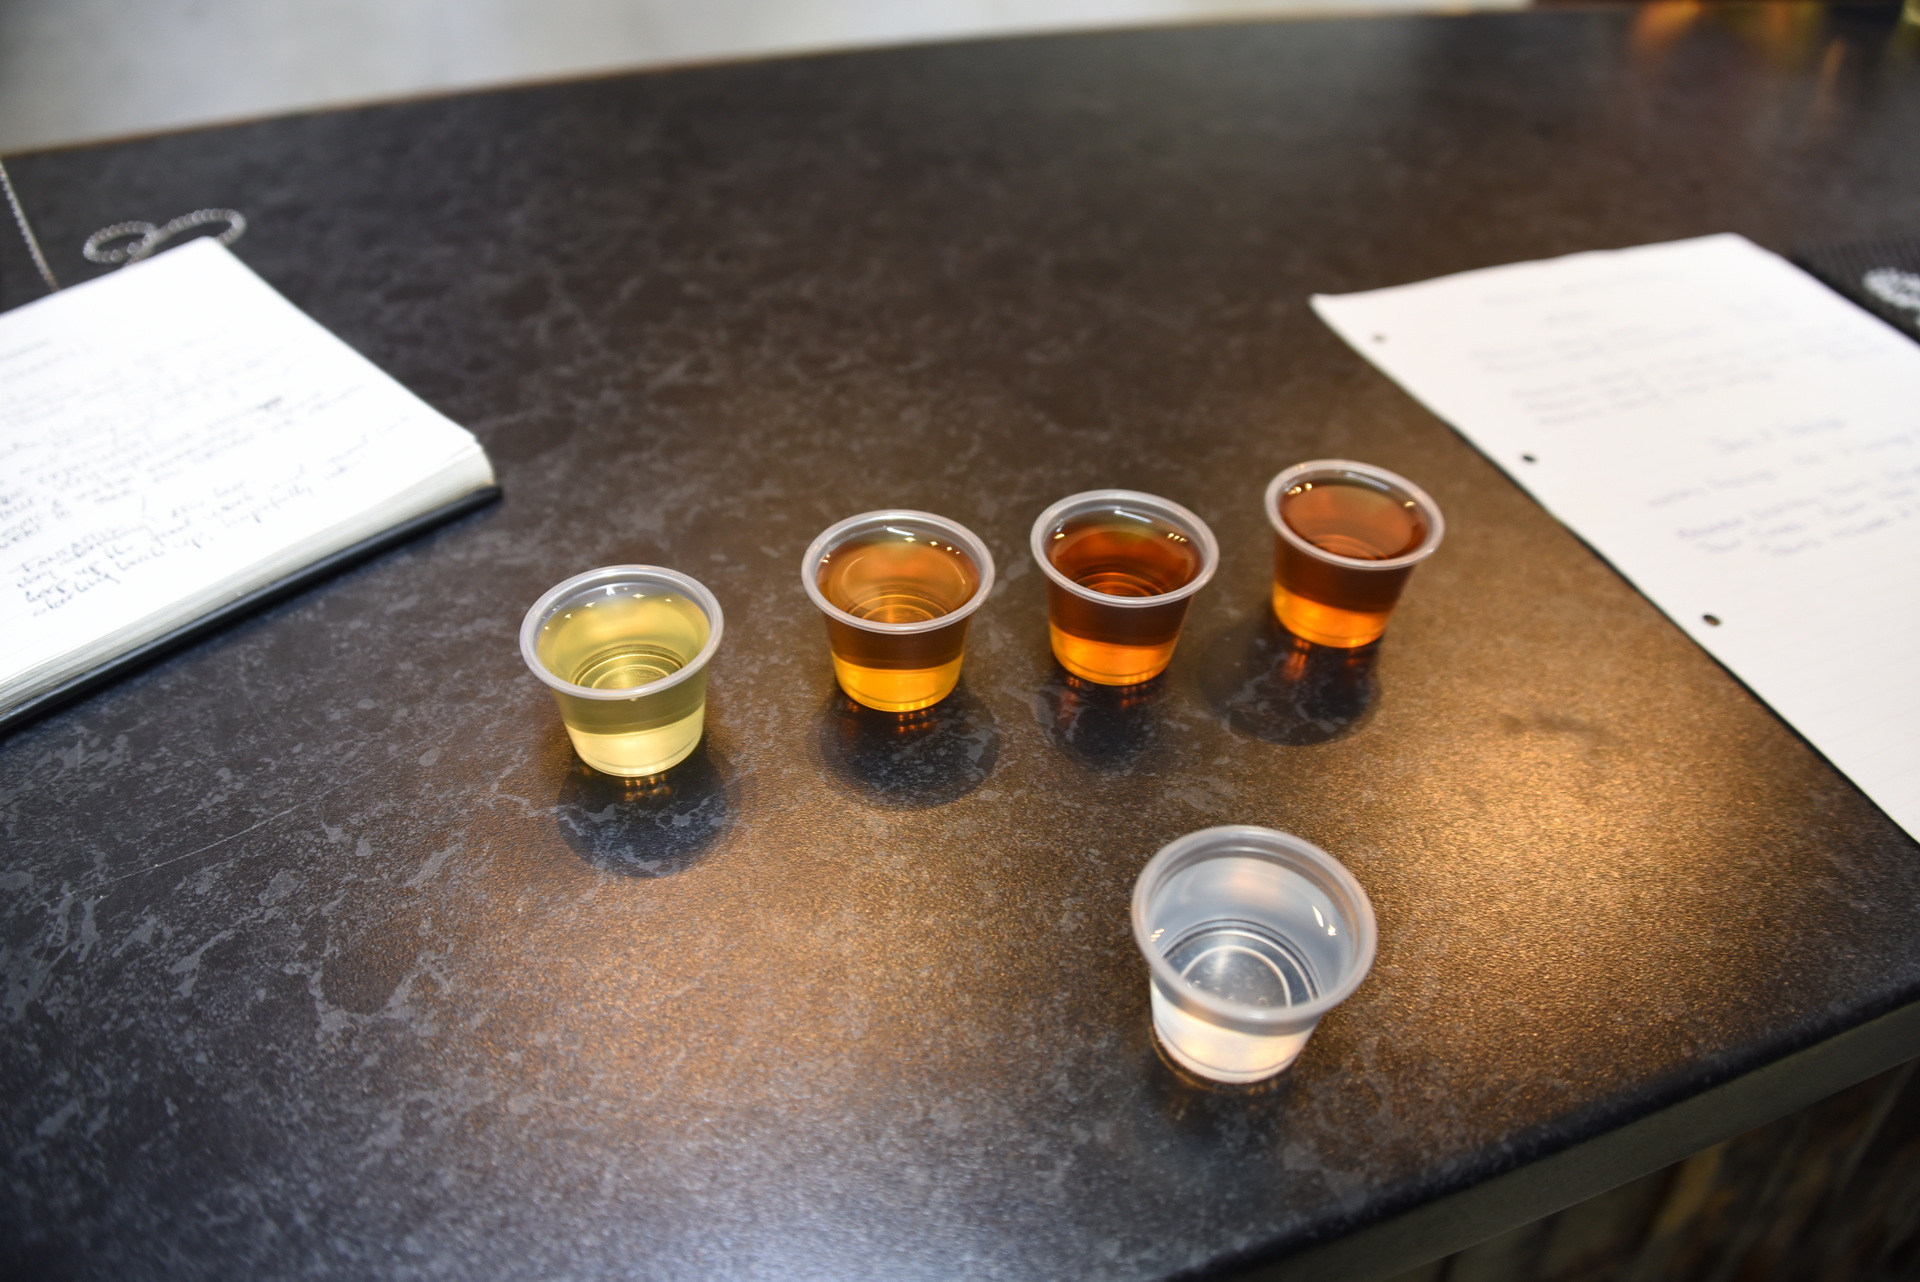
Het was een uurtje rijden naar de Abhainn Dearg distillery. Hier hadden we voor 11 uur een rondleiding geboekt; we kwamen netjes 10 voor 11 aan. Dit was een zeer kleinschalige craft distilleerderij op een soort boerderij. Terwijl we over het erf liepen werden we gewezen op het schuurtje waar we moesten zijn. De tour begon bij de mouterij, en toen naar de ruimte met de stills. Hier bleek het dat de distillery al geruime tijd (18 maanden) uit of business was doordat de wash stills lek waren en vervangen moesten worden, wat mede door corona erg veel vertraging opliep. Naar de toer, ging we terug naar de ruimte waar we gestart waren waar we elk 2 whiskies mochten proeven. Samen konden we ze alle 4 proeven: hun 10 jaar whisky of bourbon vatten gerijpt, en de 3 cask strengths op 3 verschillende vaten gerijpt (dessertwijn, sherry, en een roja rode wijn). Uiteindelijk hebben we nog een flesje van de 10 jaar meegenomen. En om 12 uur zijn we weer in de auto gesprongen. Dit was een leuke andere distiller, één waarbij mensen het niet zo nauw namen met hoe ze de whisky maken. Spinnenwebben, koper buisjes beetje aan elkaar gesoldeerd. Doffe stills die niet mooi rond waren, maar een cilinder met wat smalle buisjes. Whatever gets the job done.
24 Juni Edradour, Blair Atholl Distillery (Mainland)
Omdat we toch via Pitlochry naar het zuiden gingen, maar even lans de woonplaats van de helaas te vroeg overleden held van ons Gordon Duncan. Hier ligt het kleinste destillery van Scotland Edradour, maar deze is ‘temporarily closed’ Vanwege tijdgebrek van Blair Atholl alleen maar een foto gemaakt.
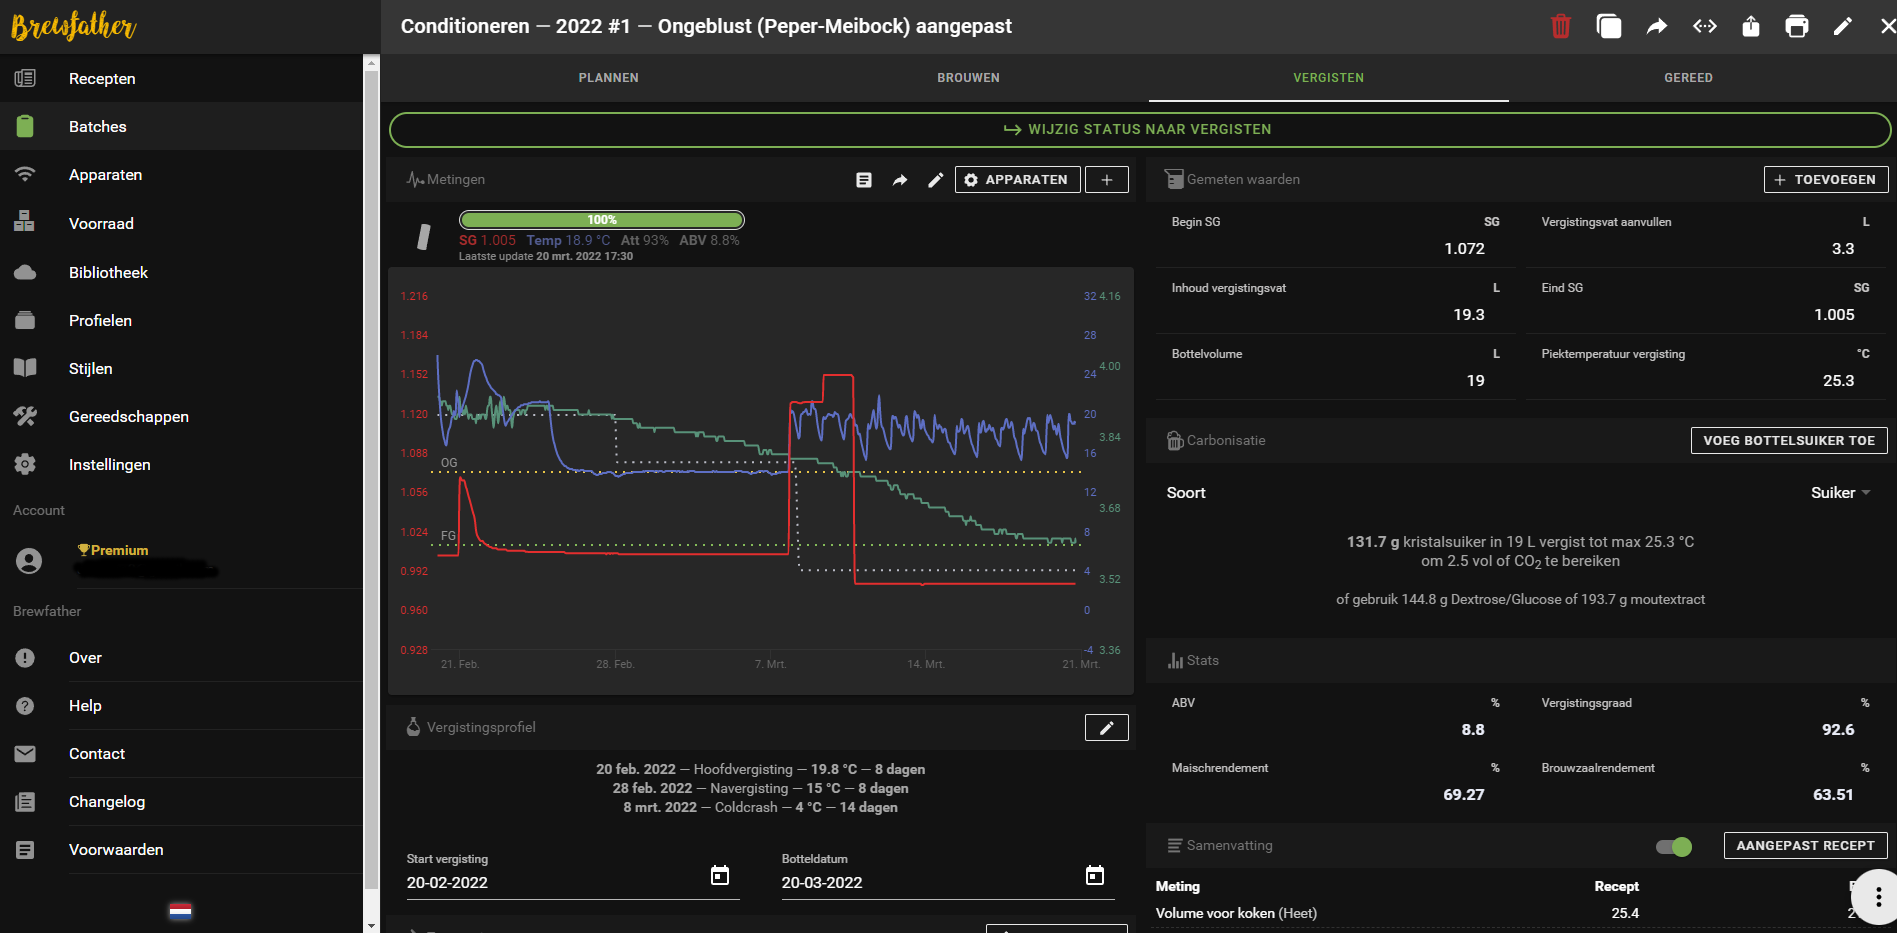
Beer at last taken out of the cooling unit. Cooling temperature was not perfect, need to fix some things in my brewing computer 🙂
Brewfather
Above the brewfather app. The transition from Brouwhulp to brewfather was big, but it is a great online tool, with perfect integration of tools like ispindel, or DIY tools!
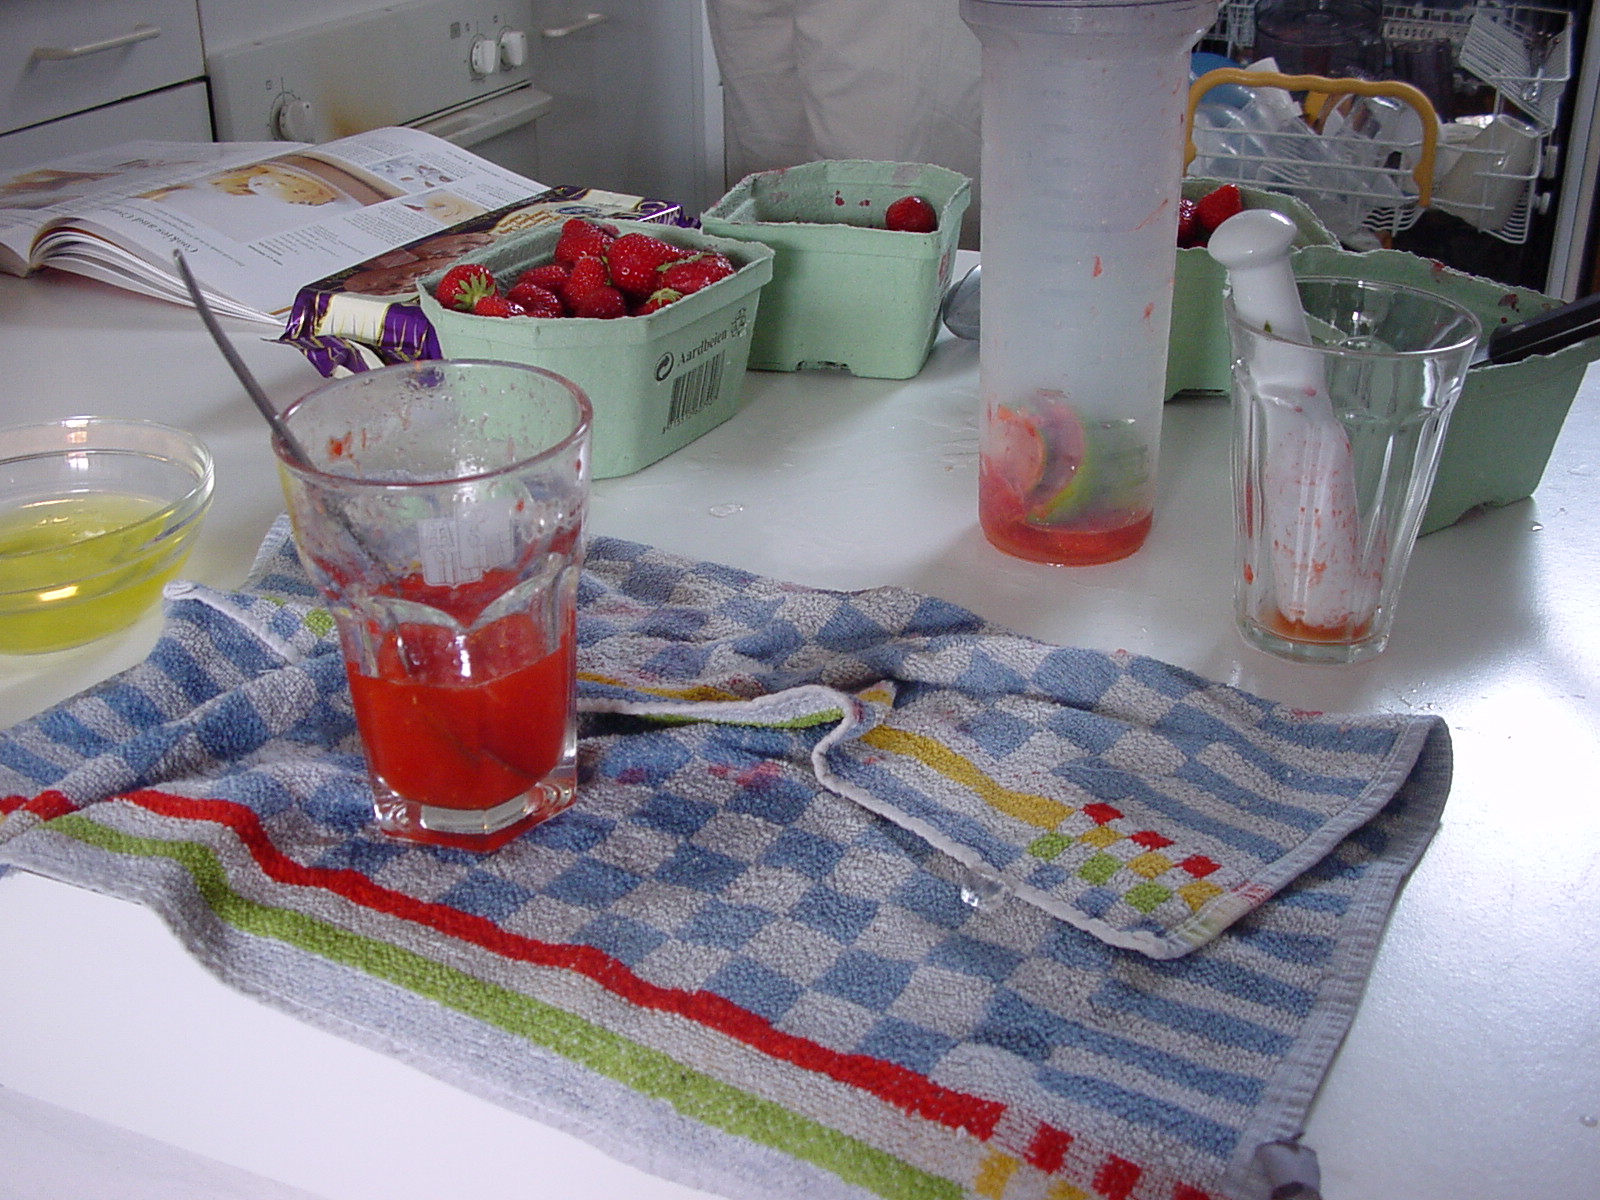
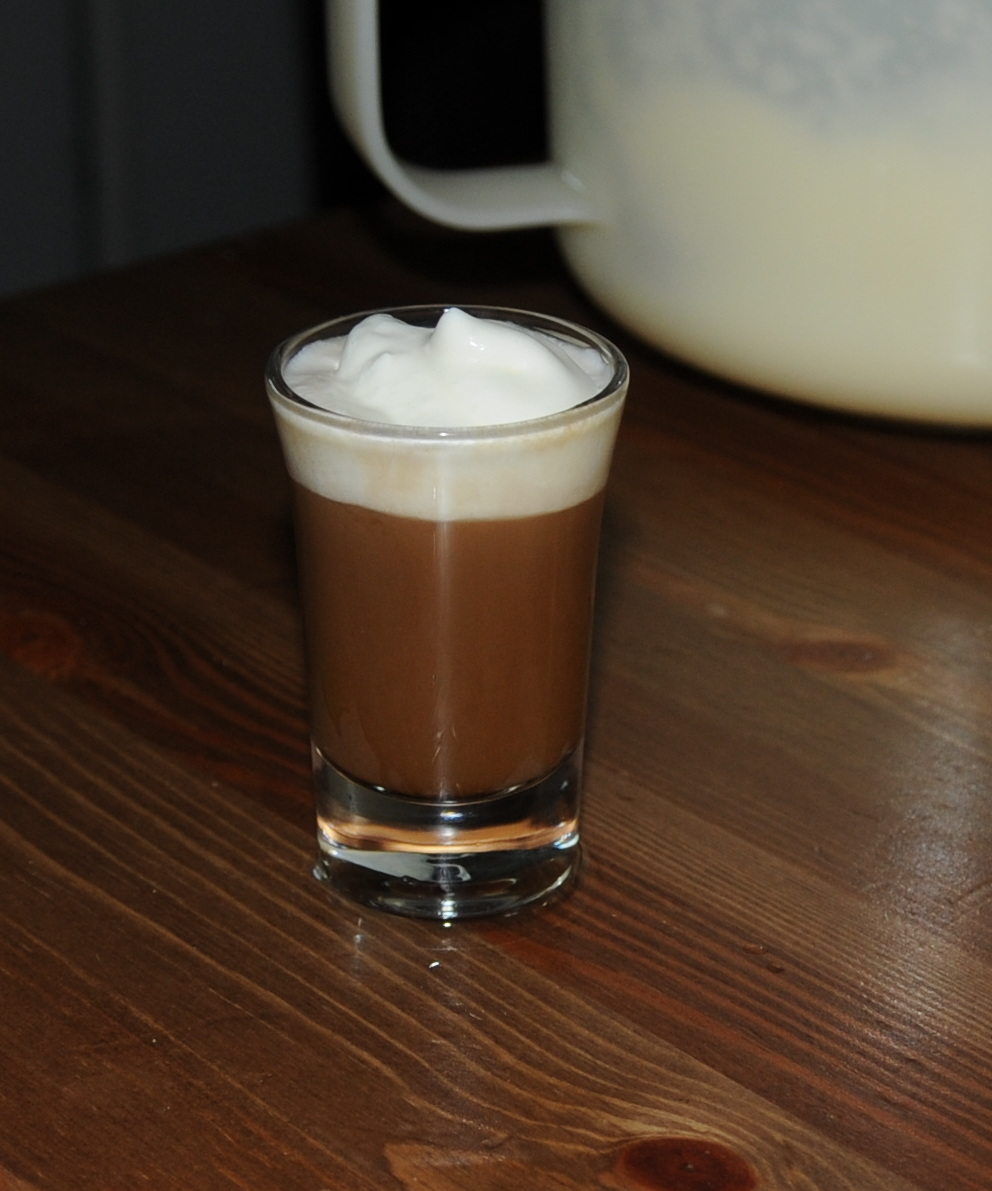
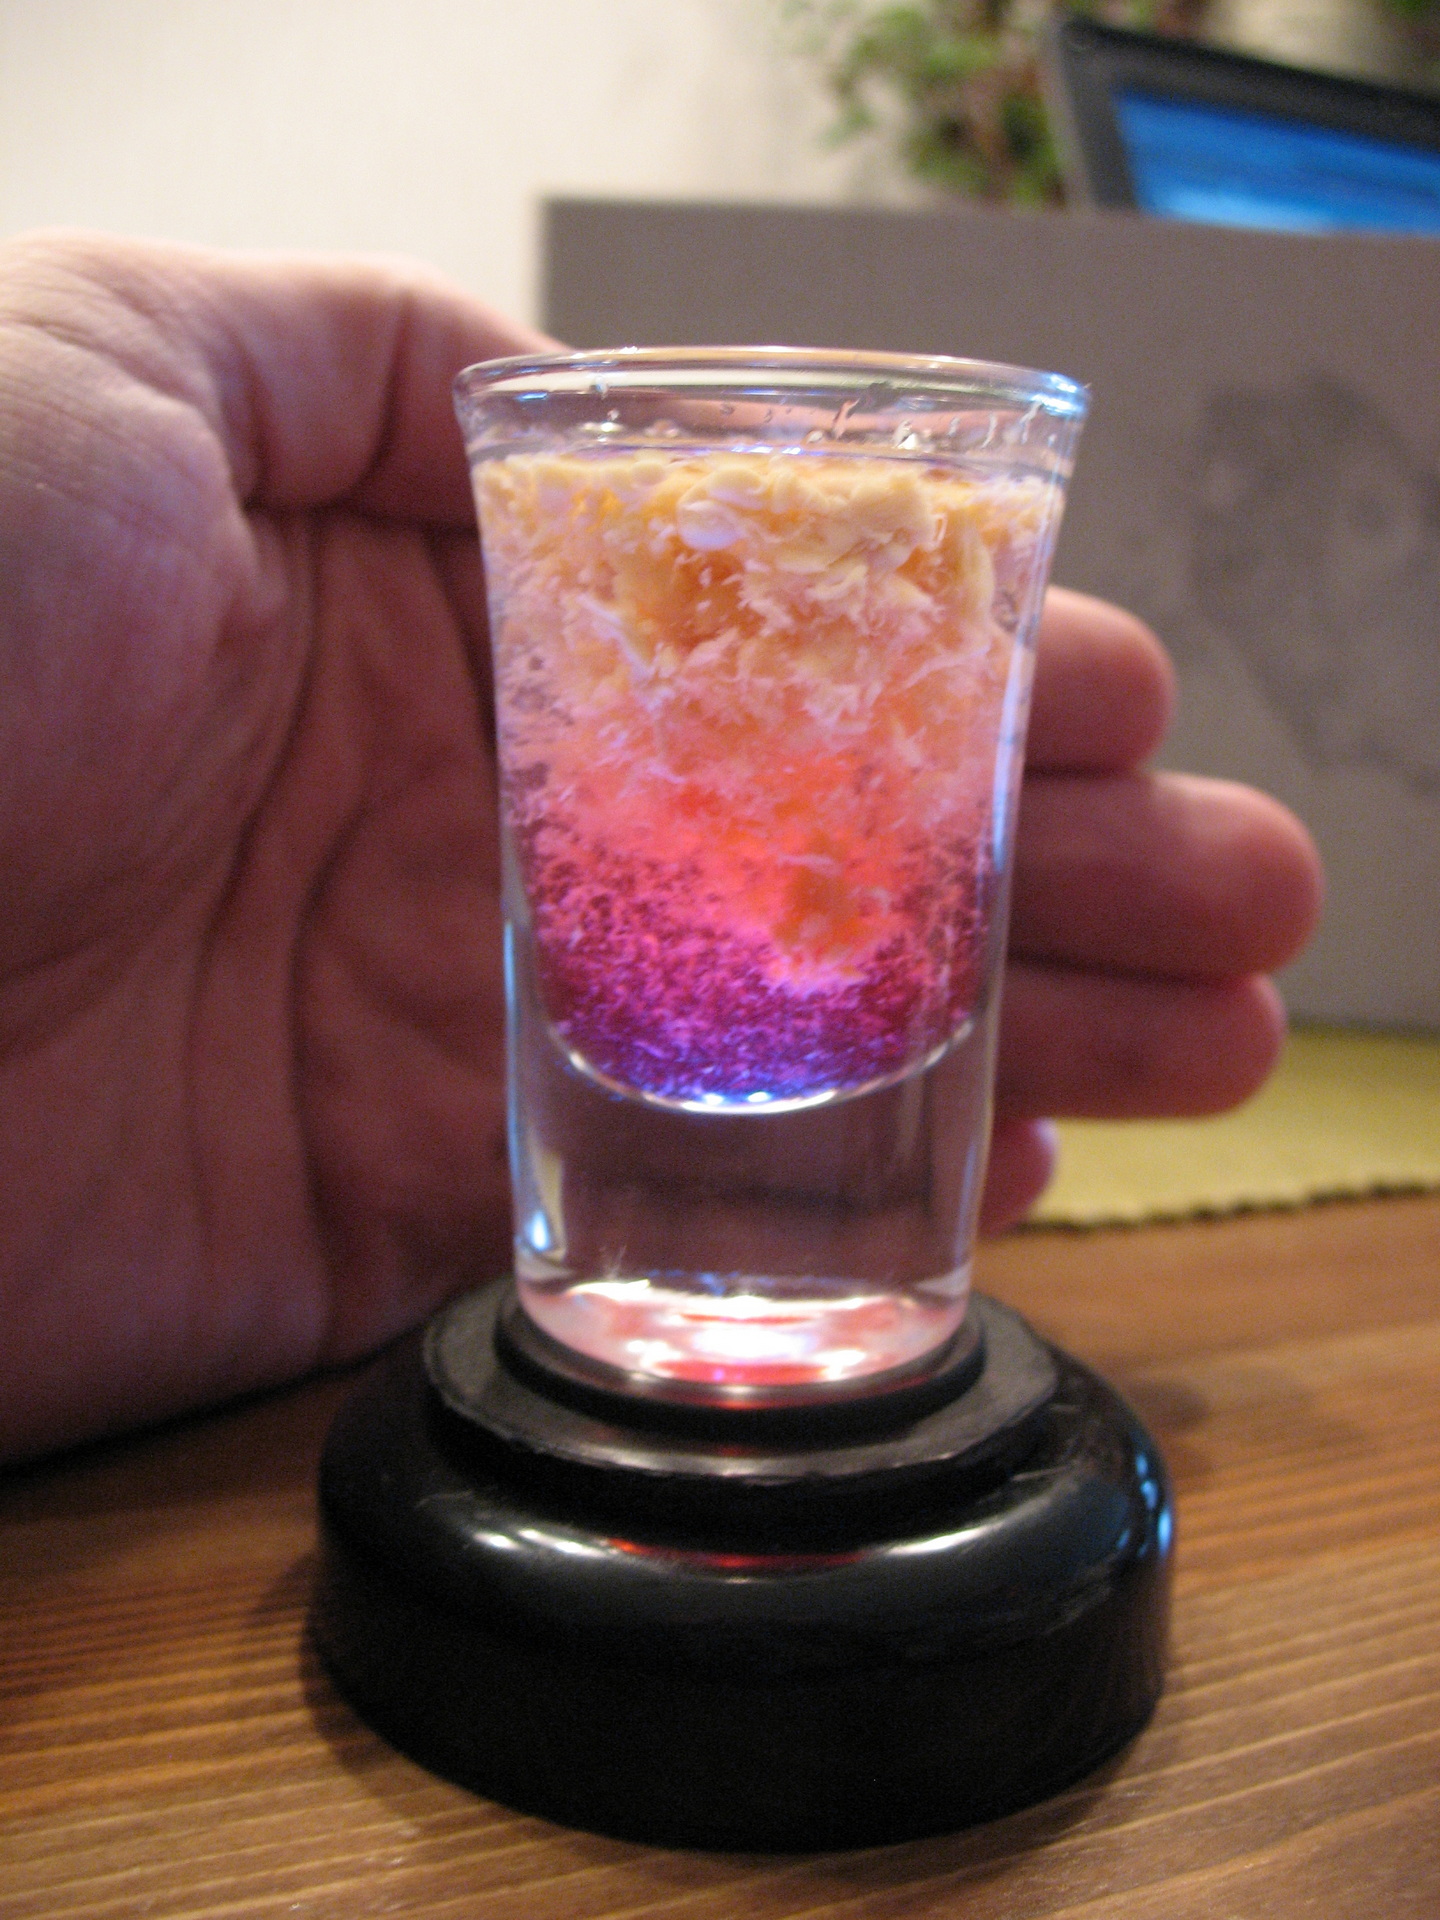
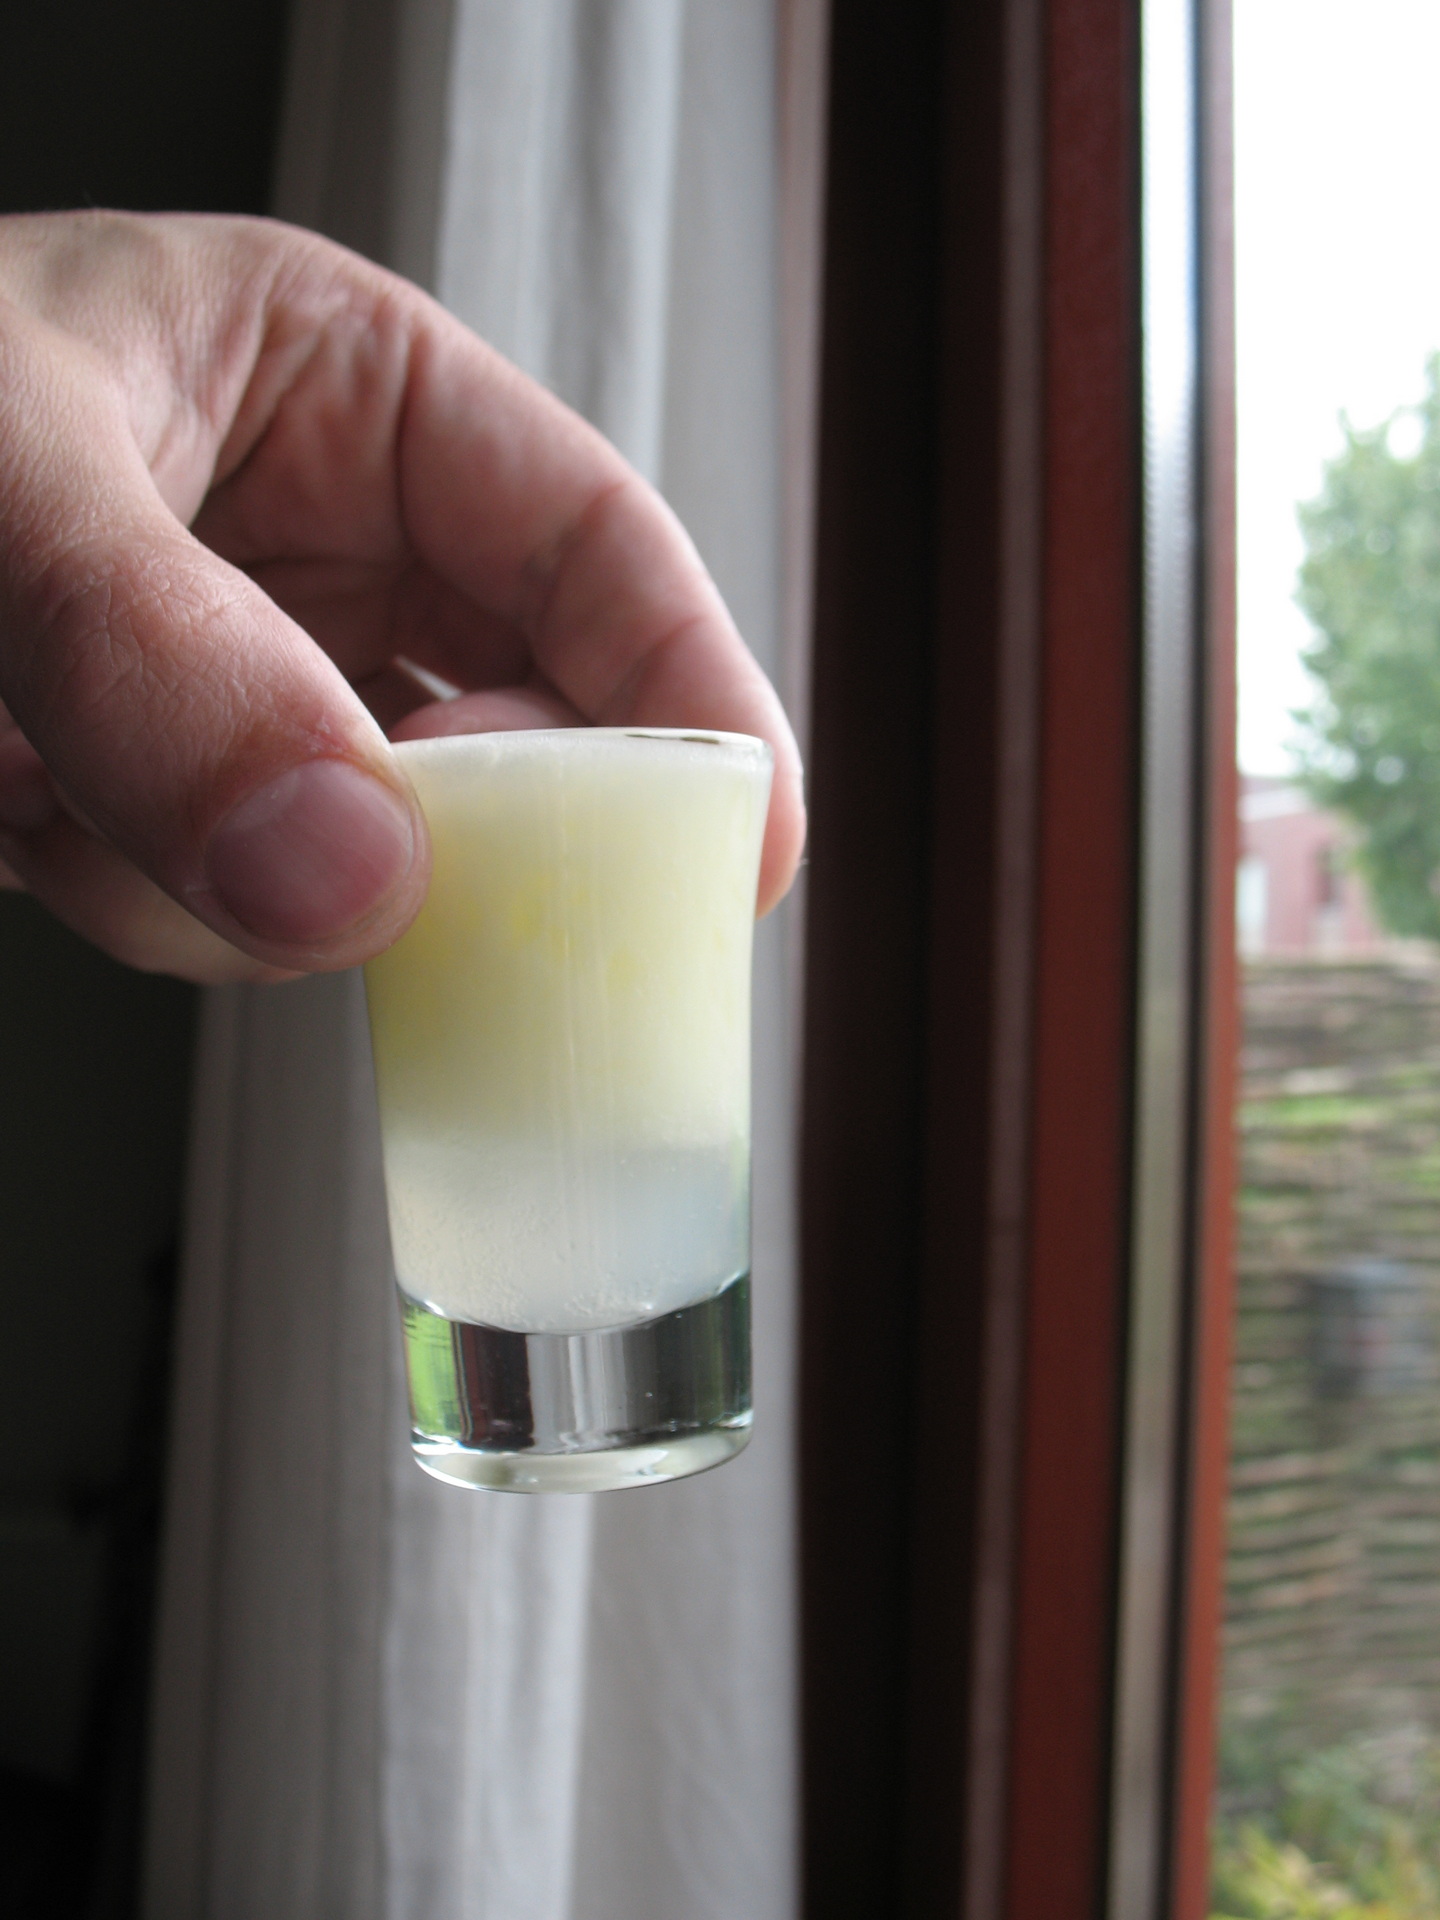
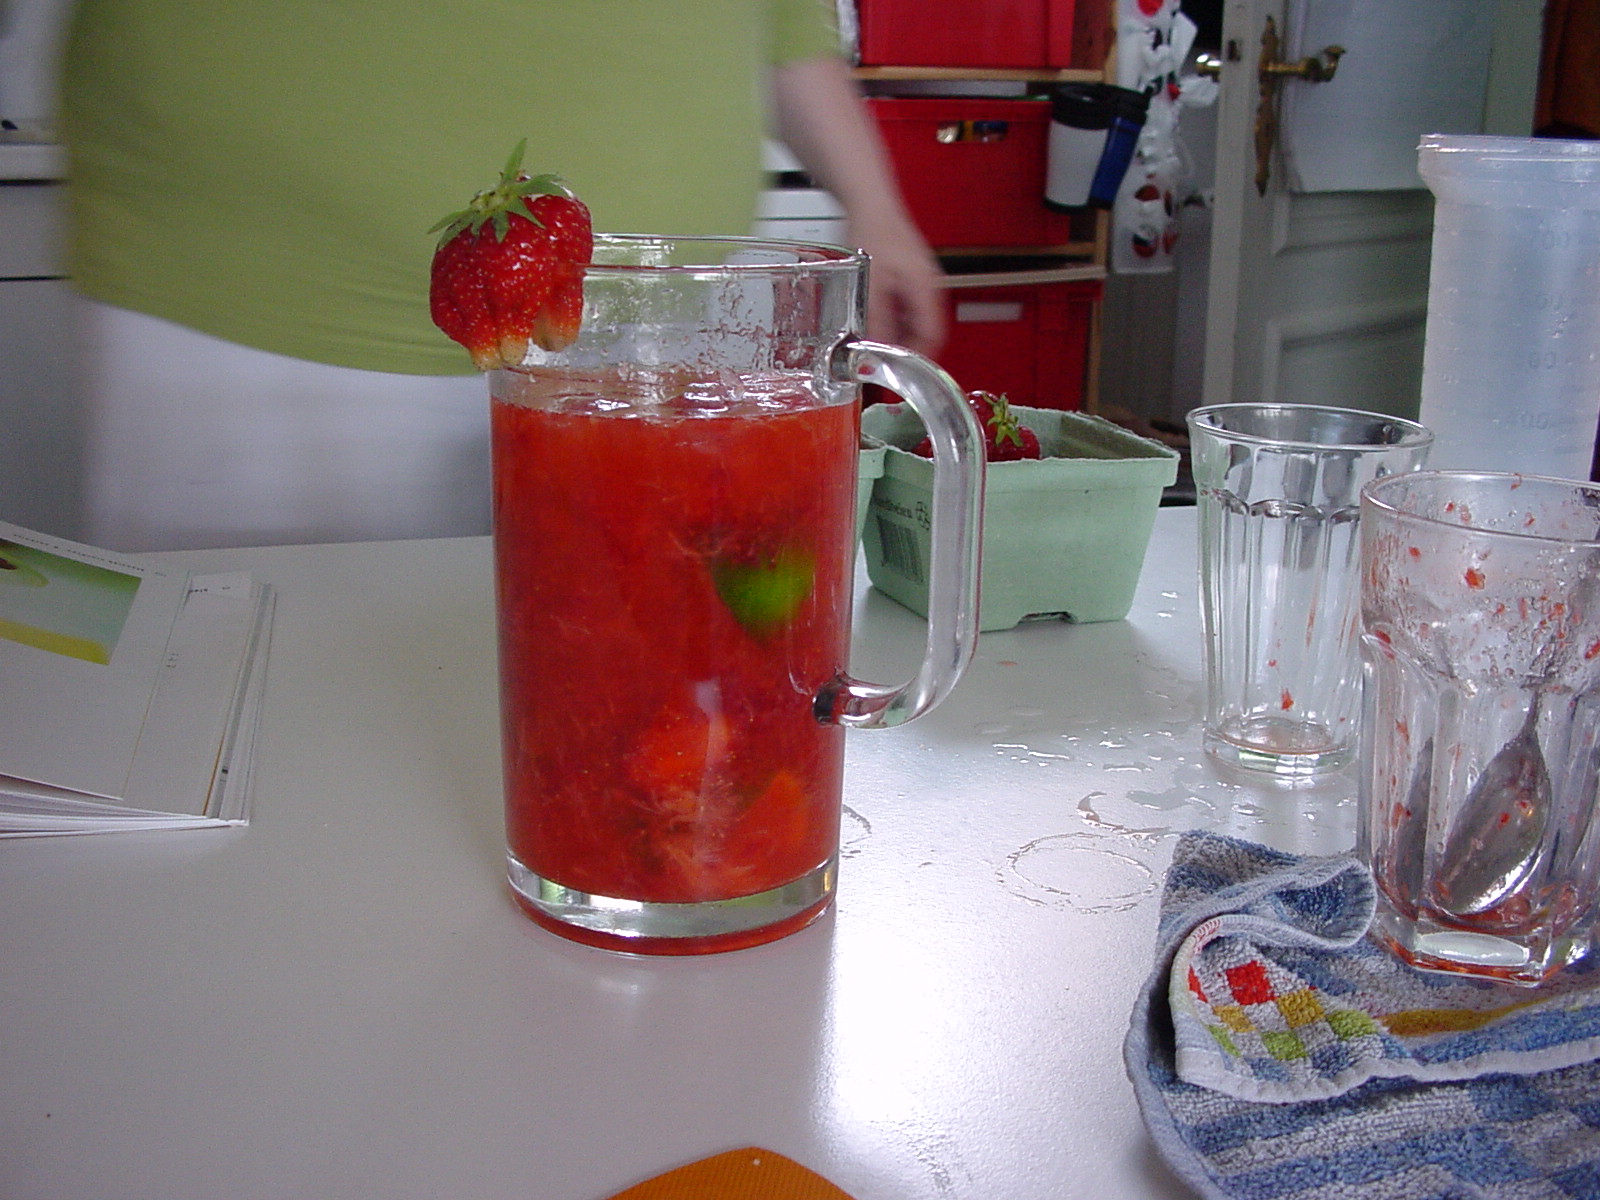
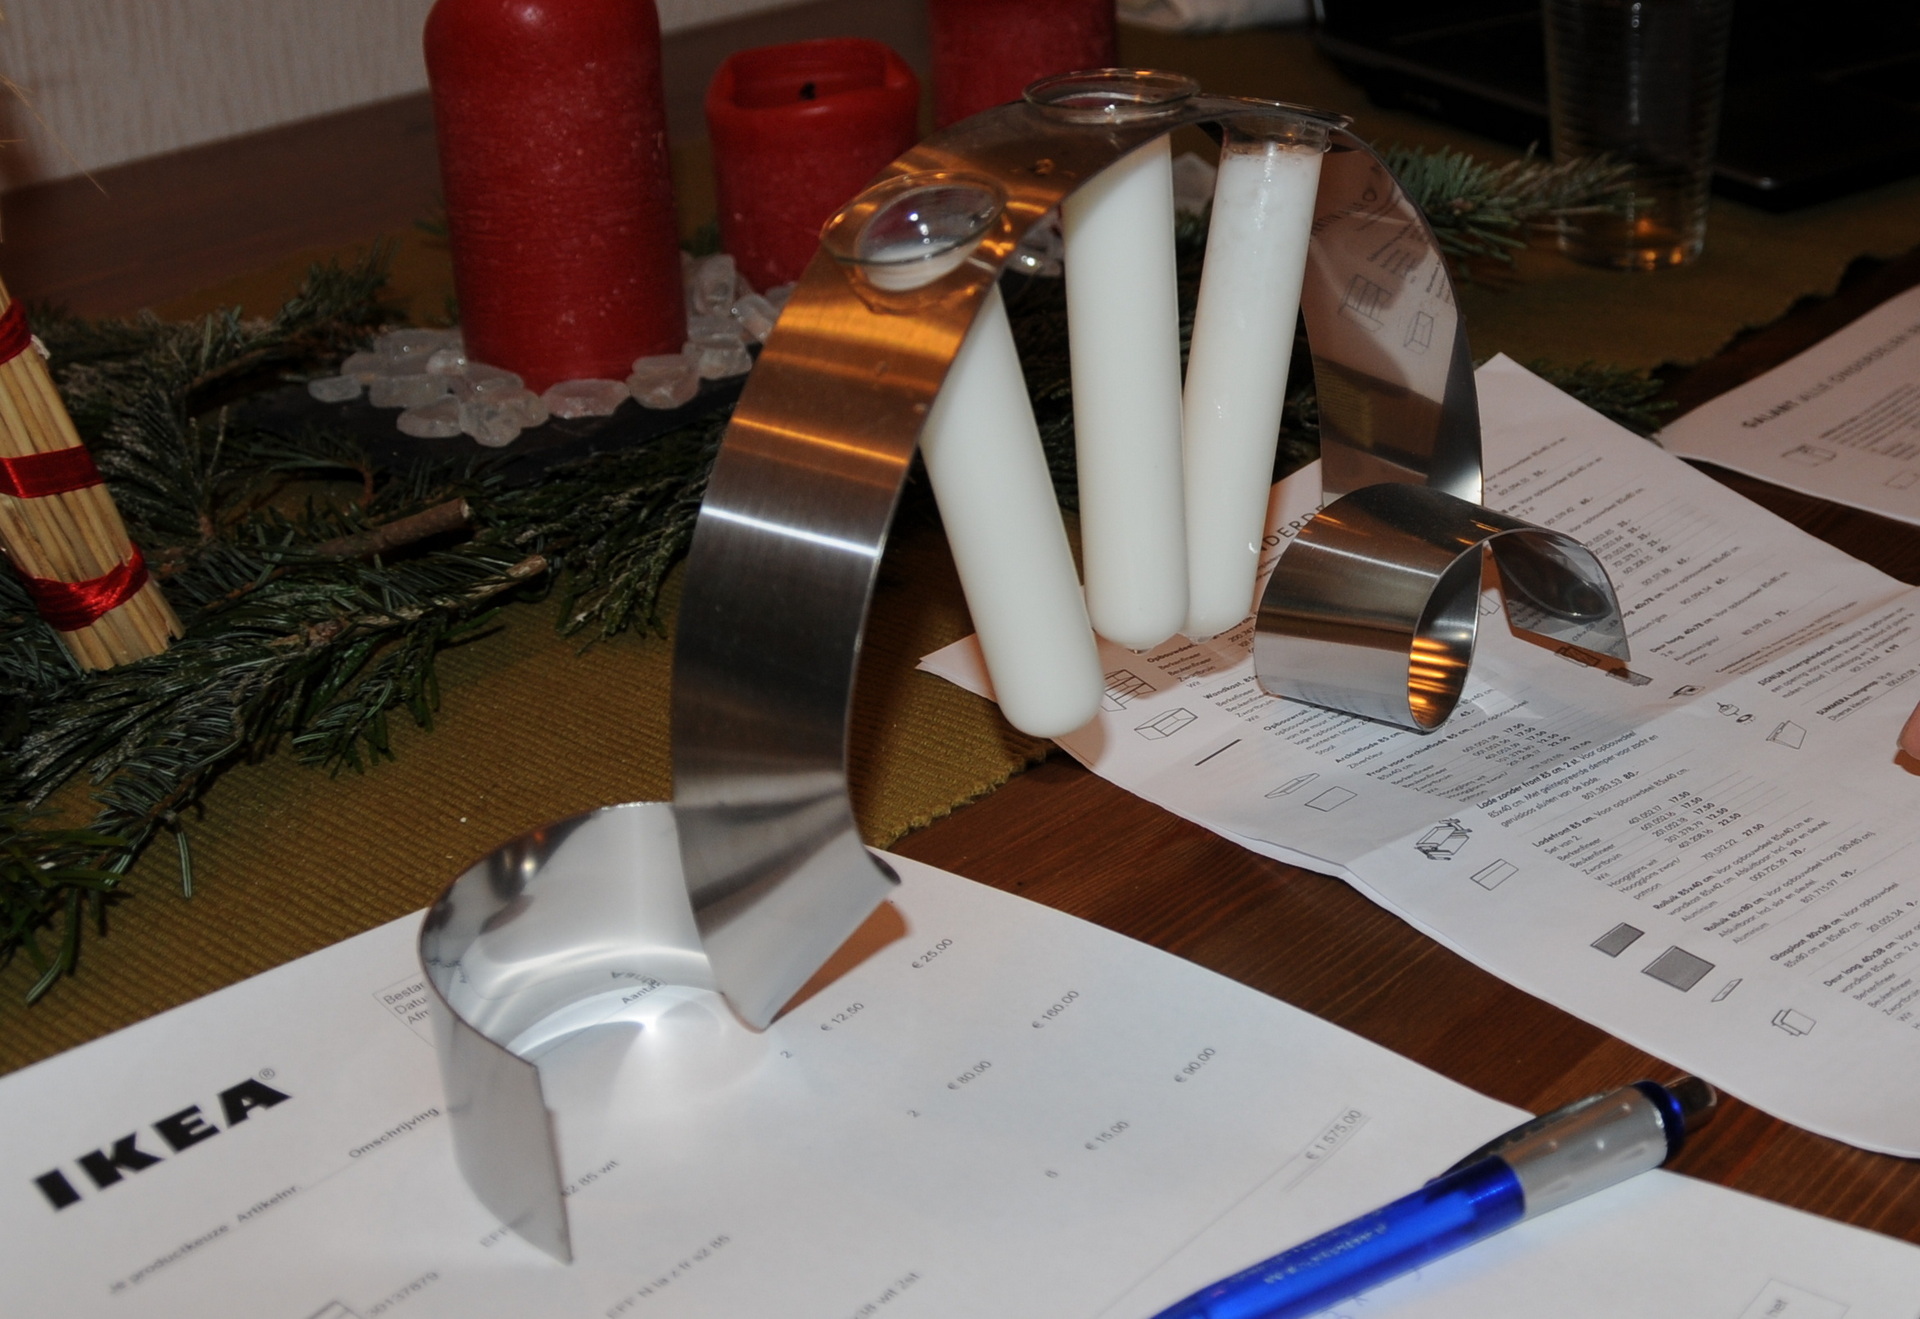
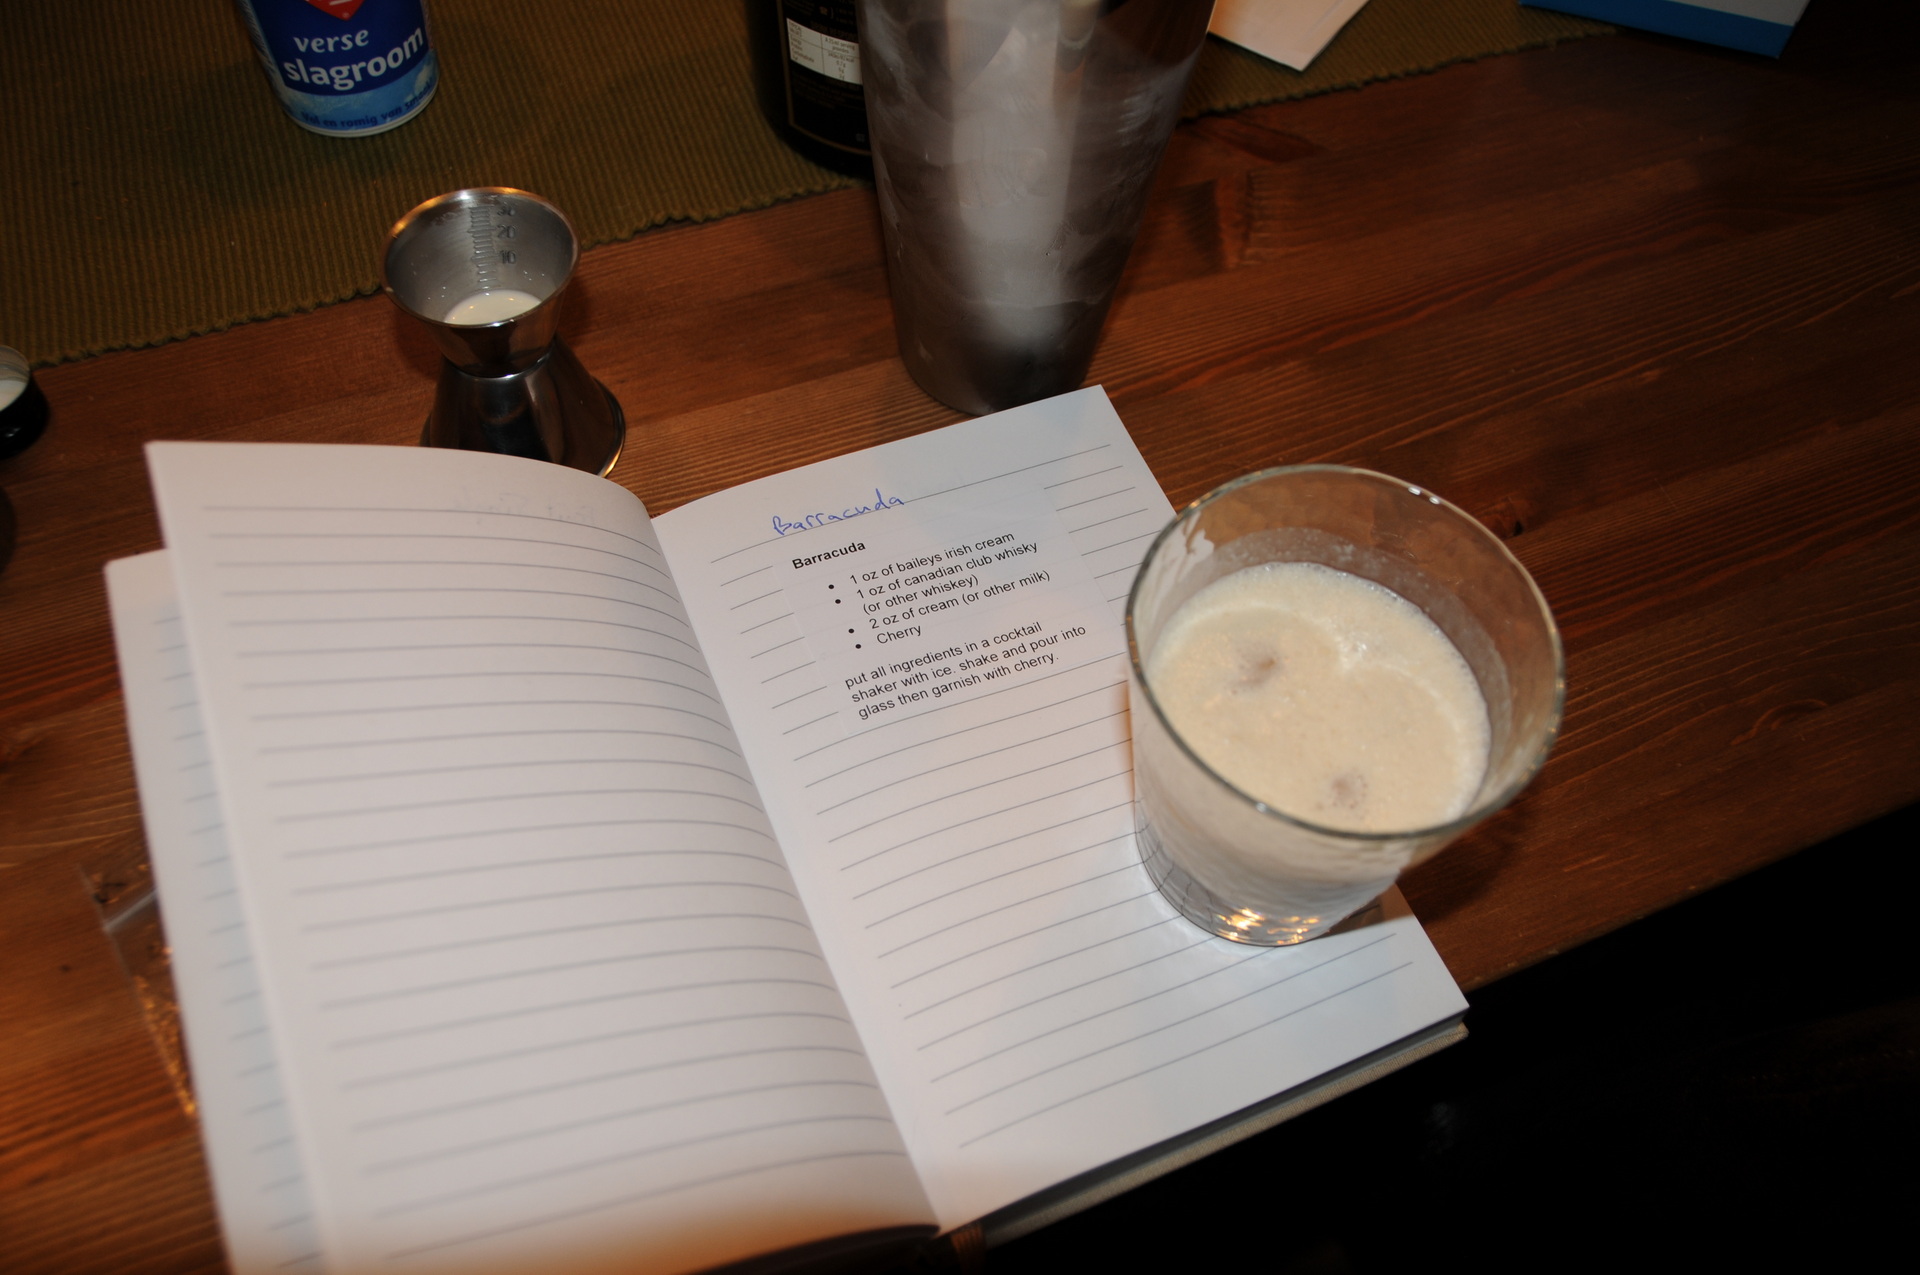
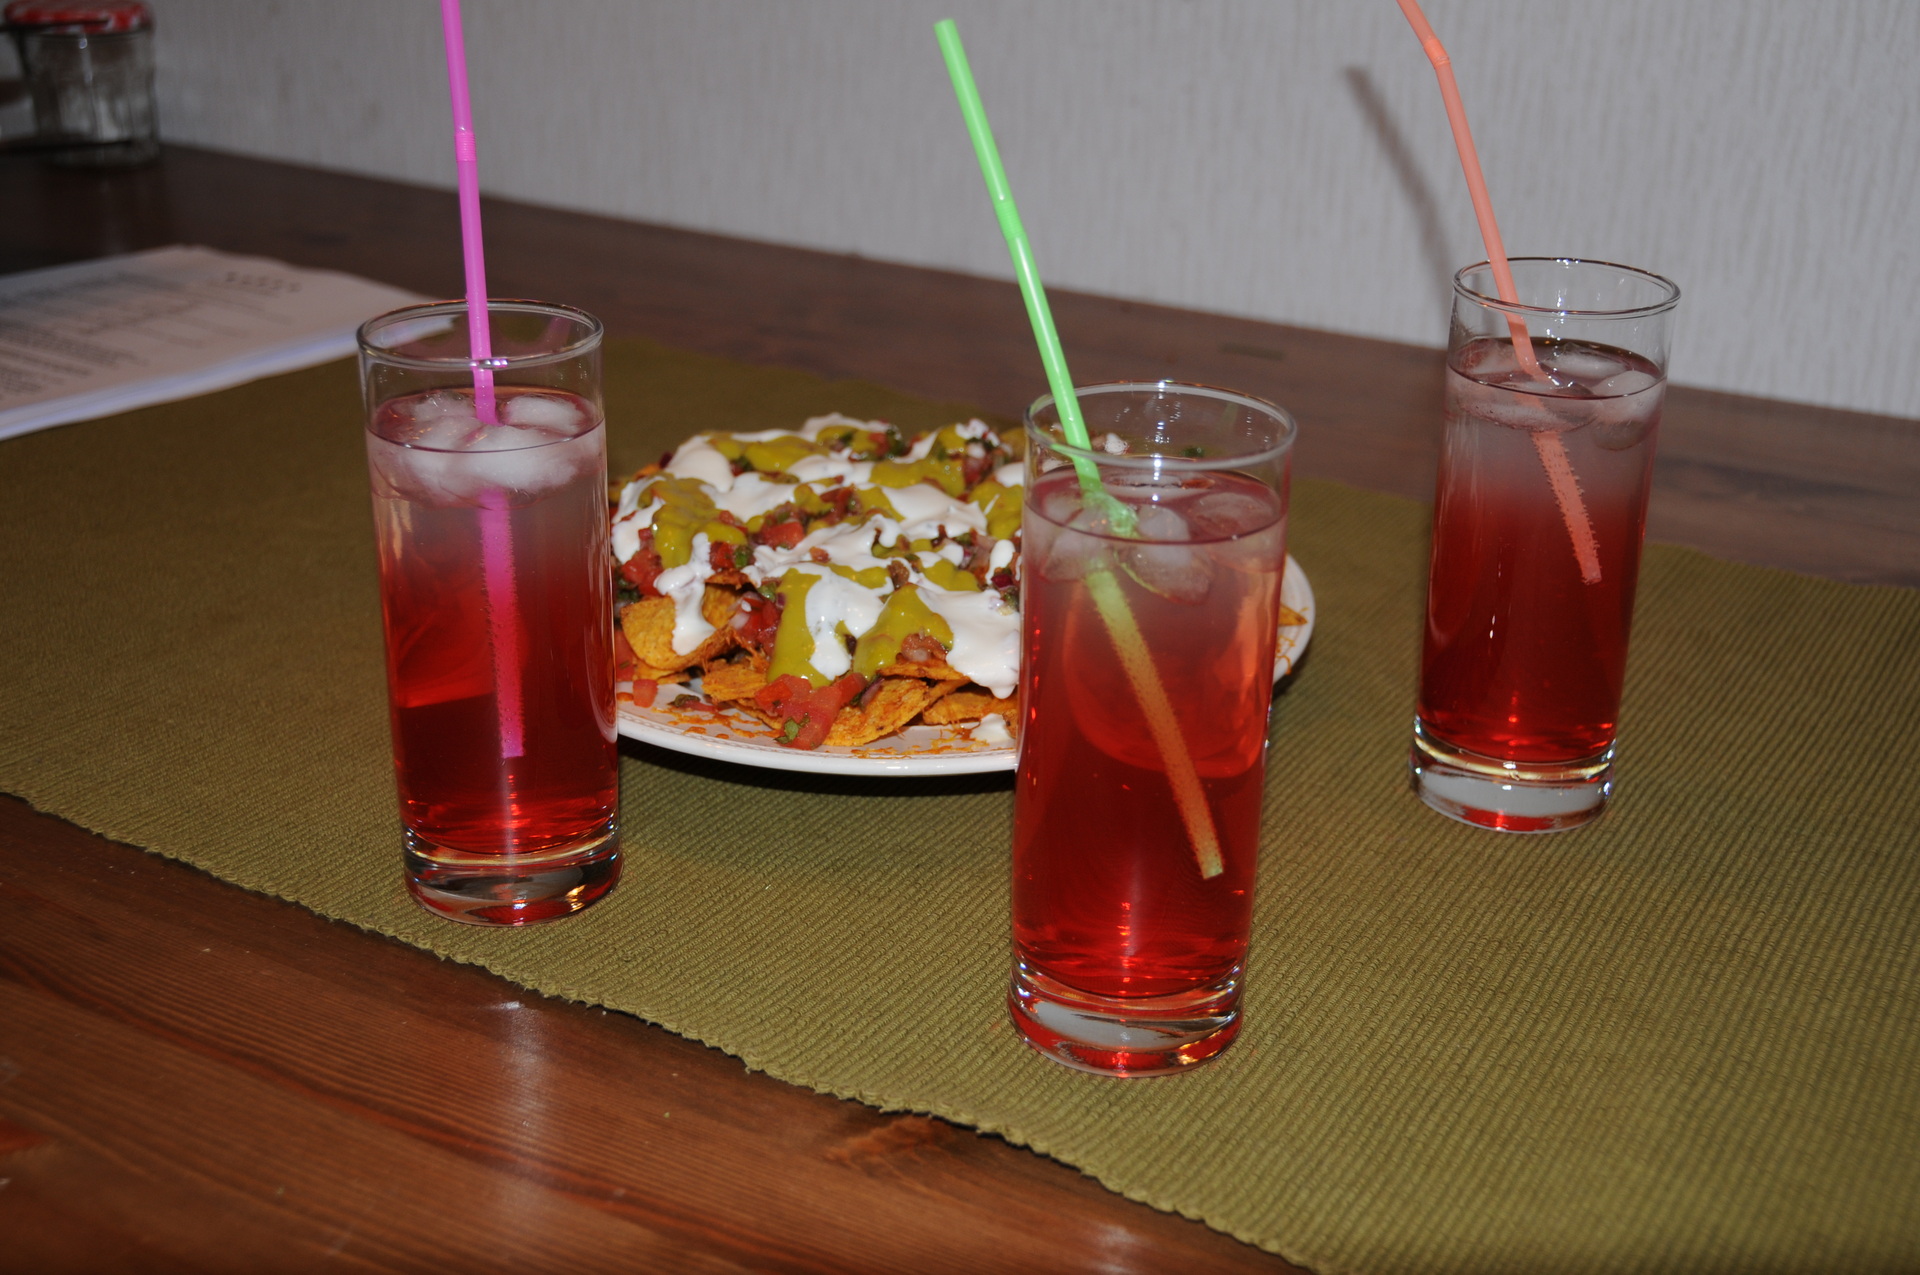
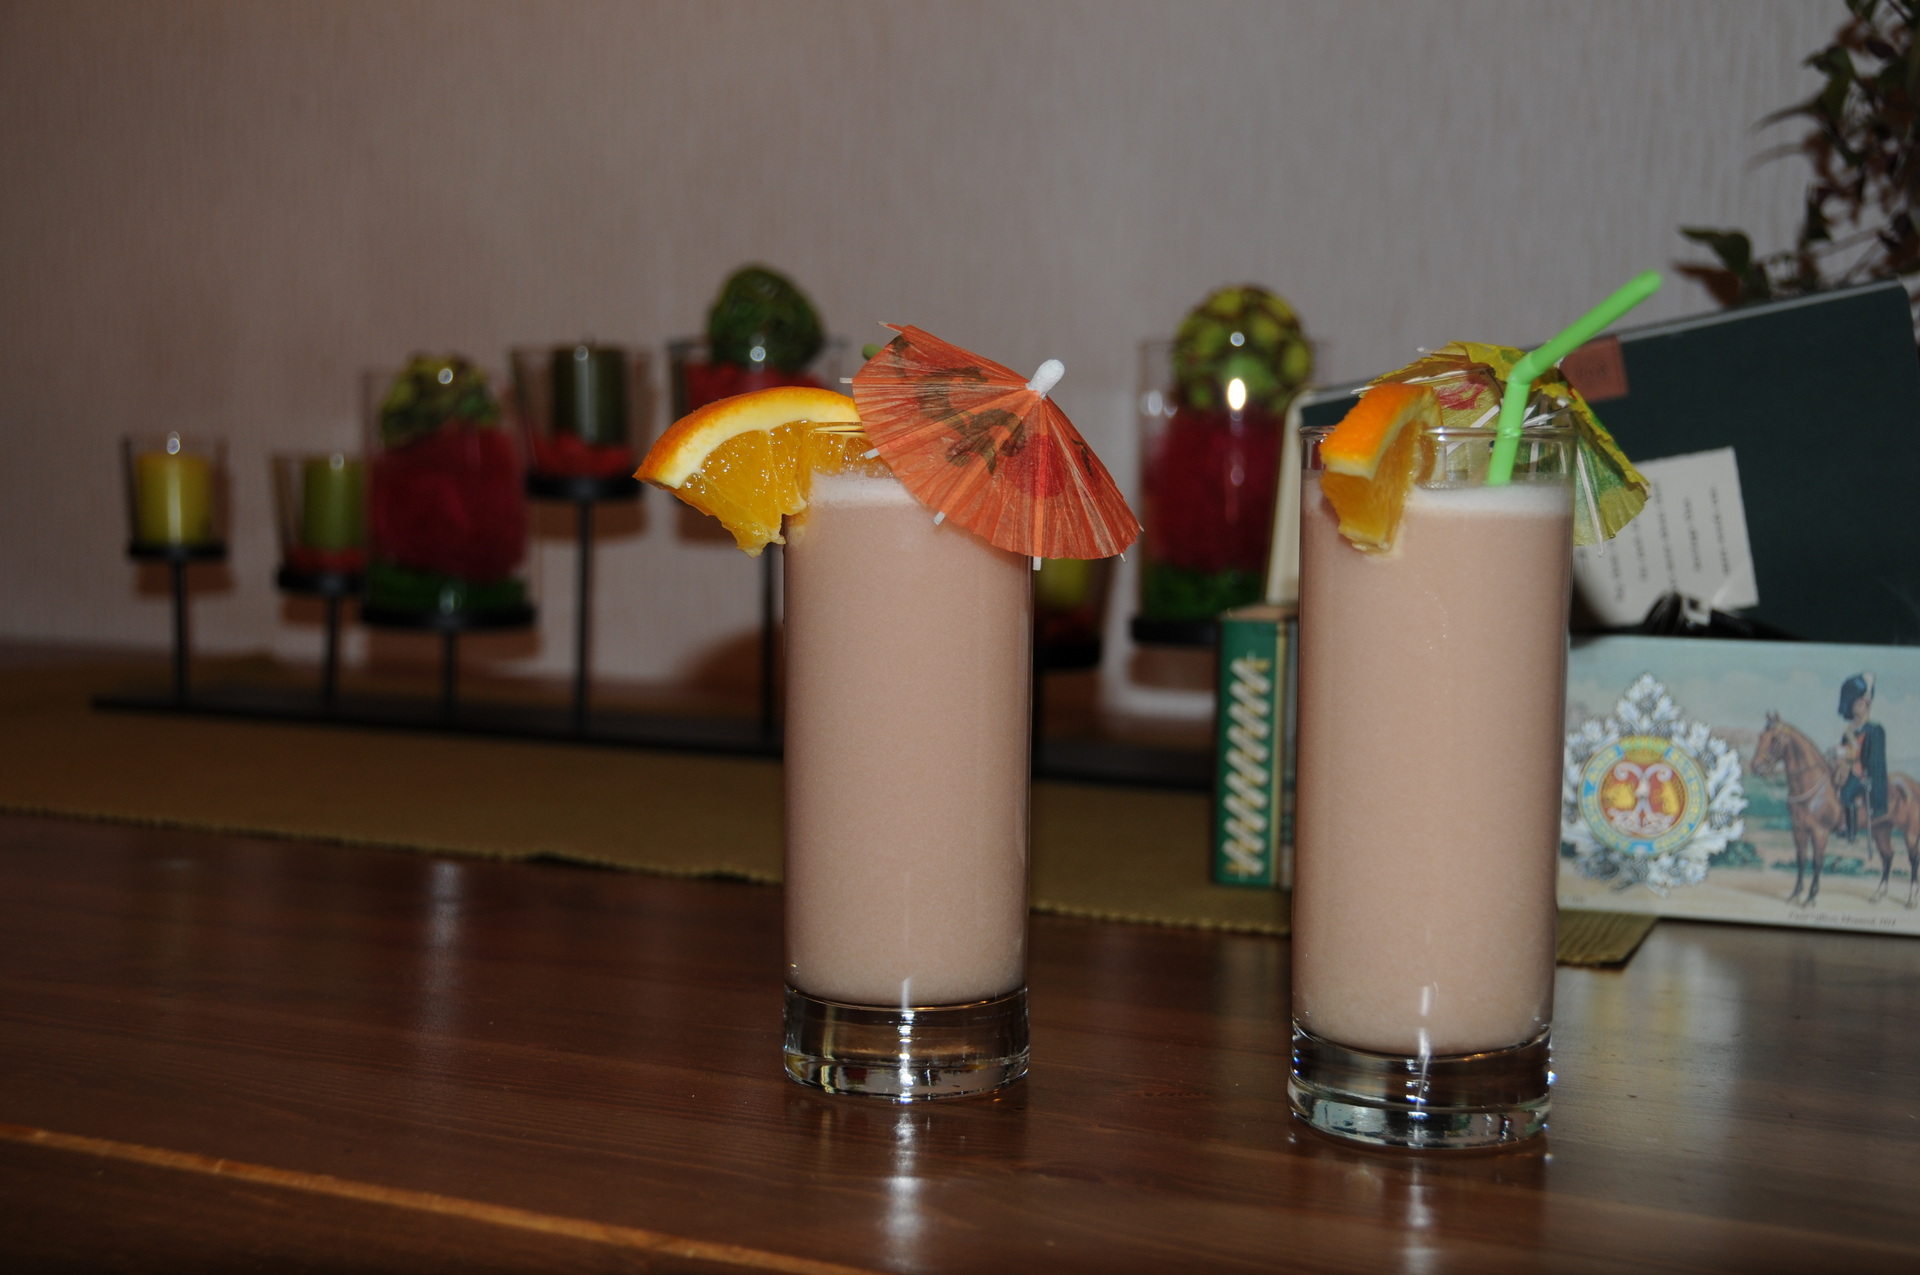
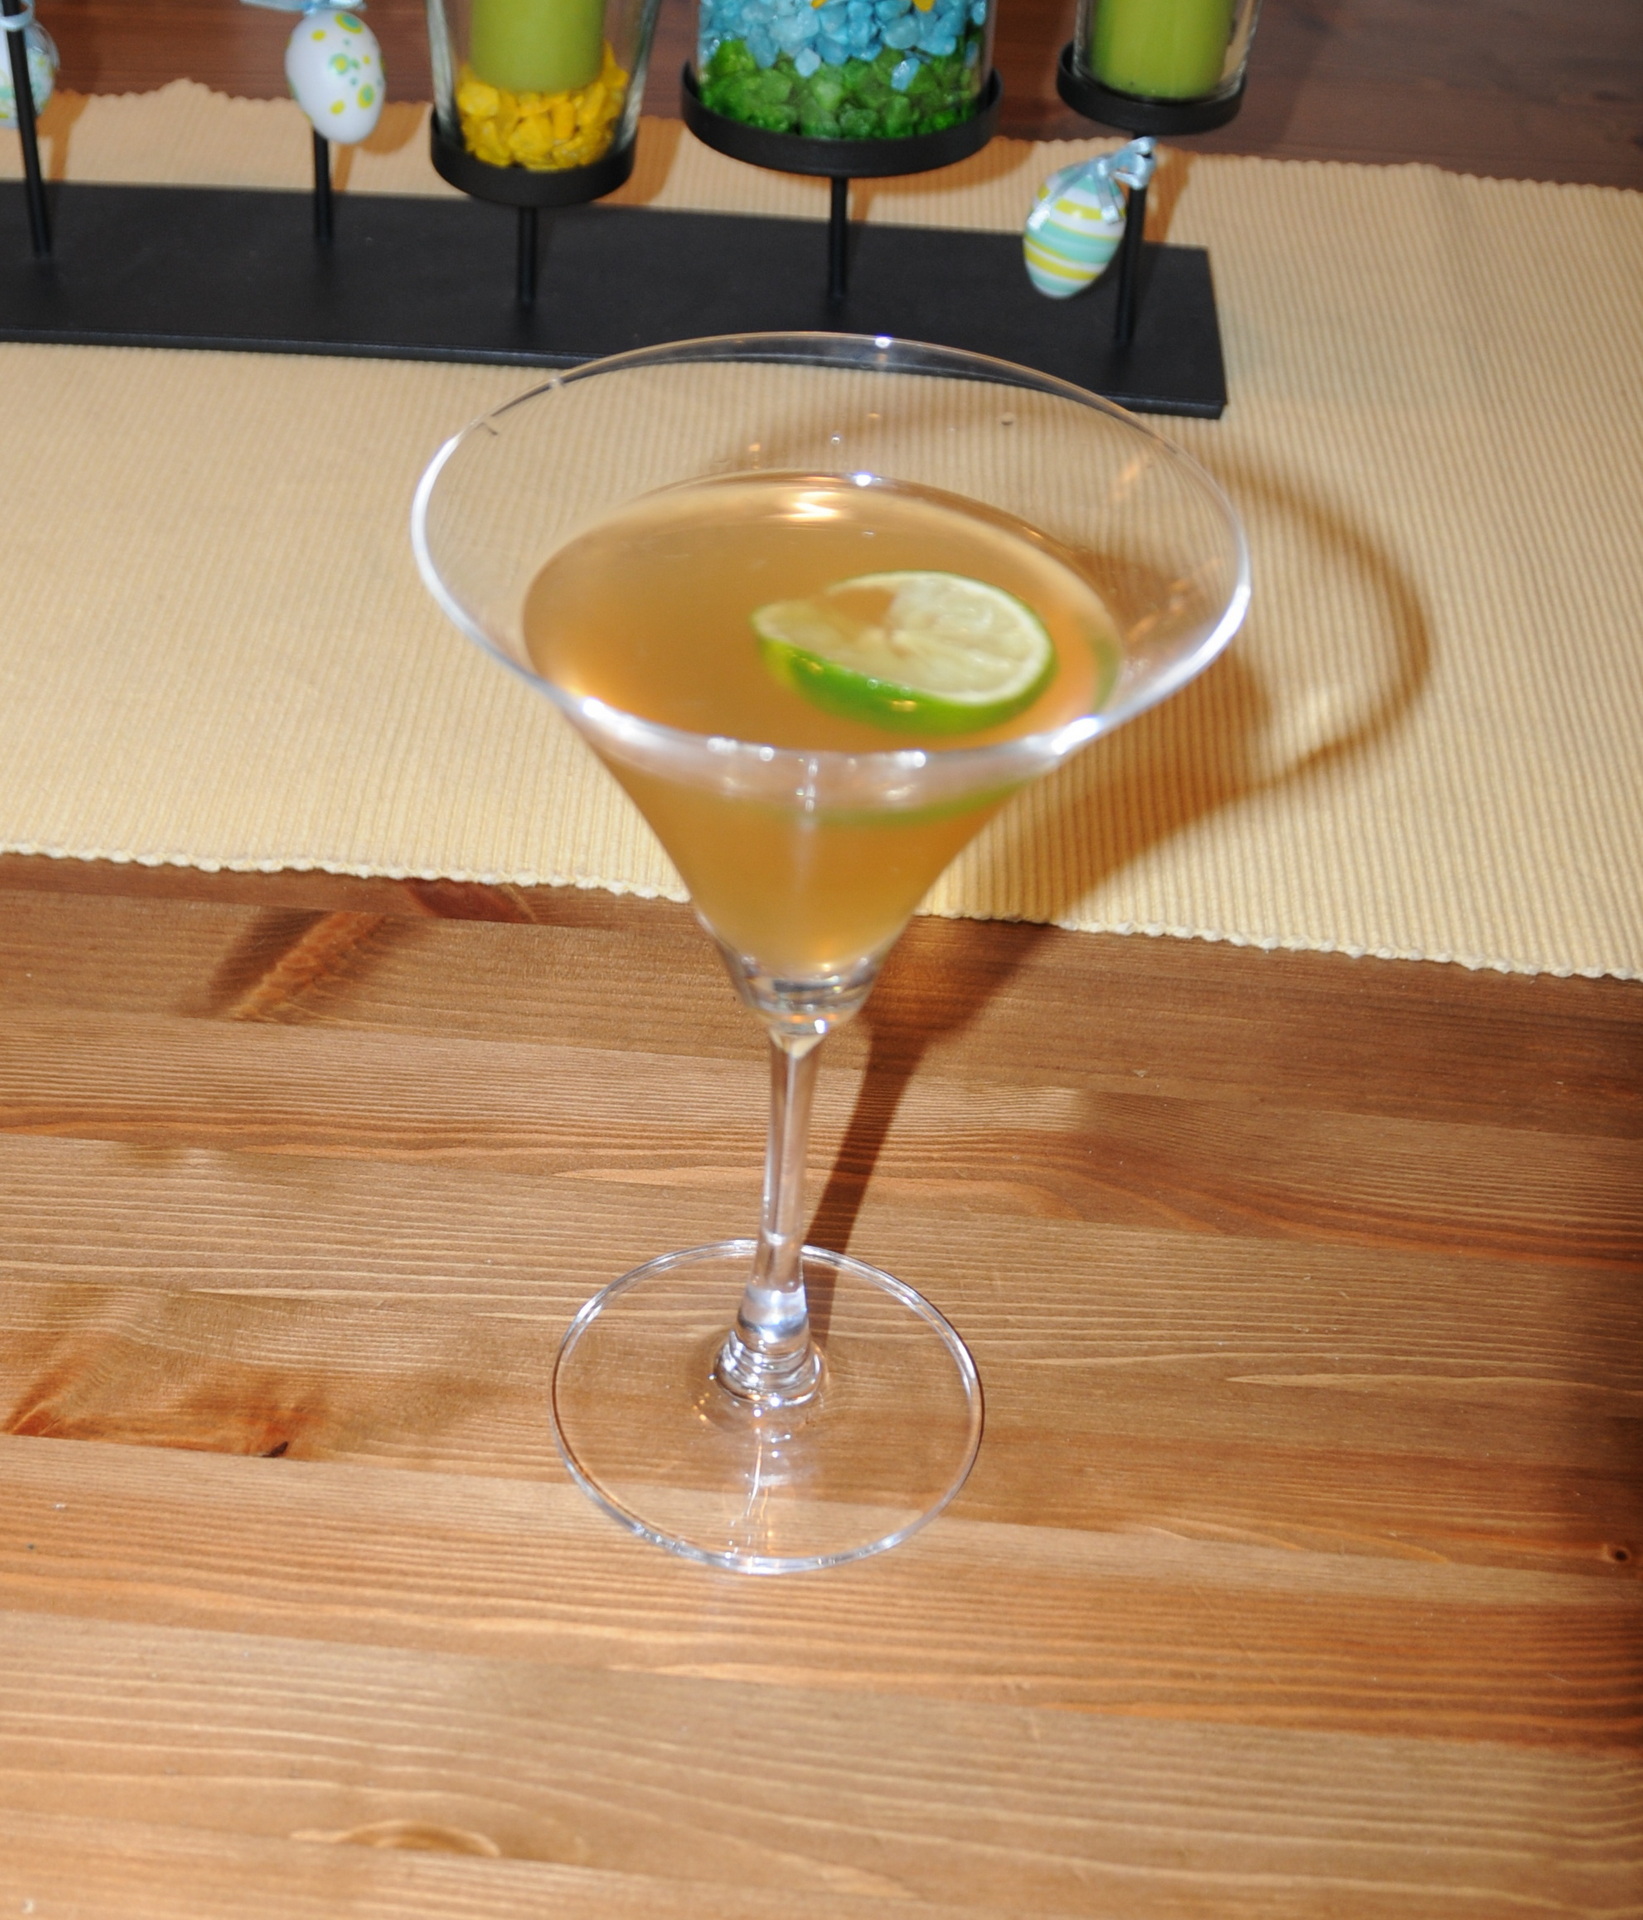
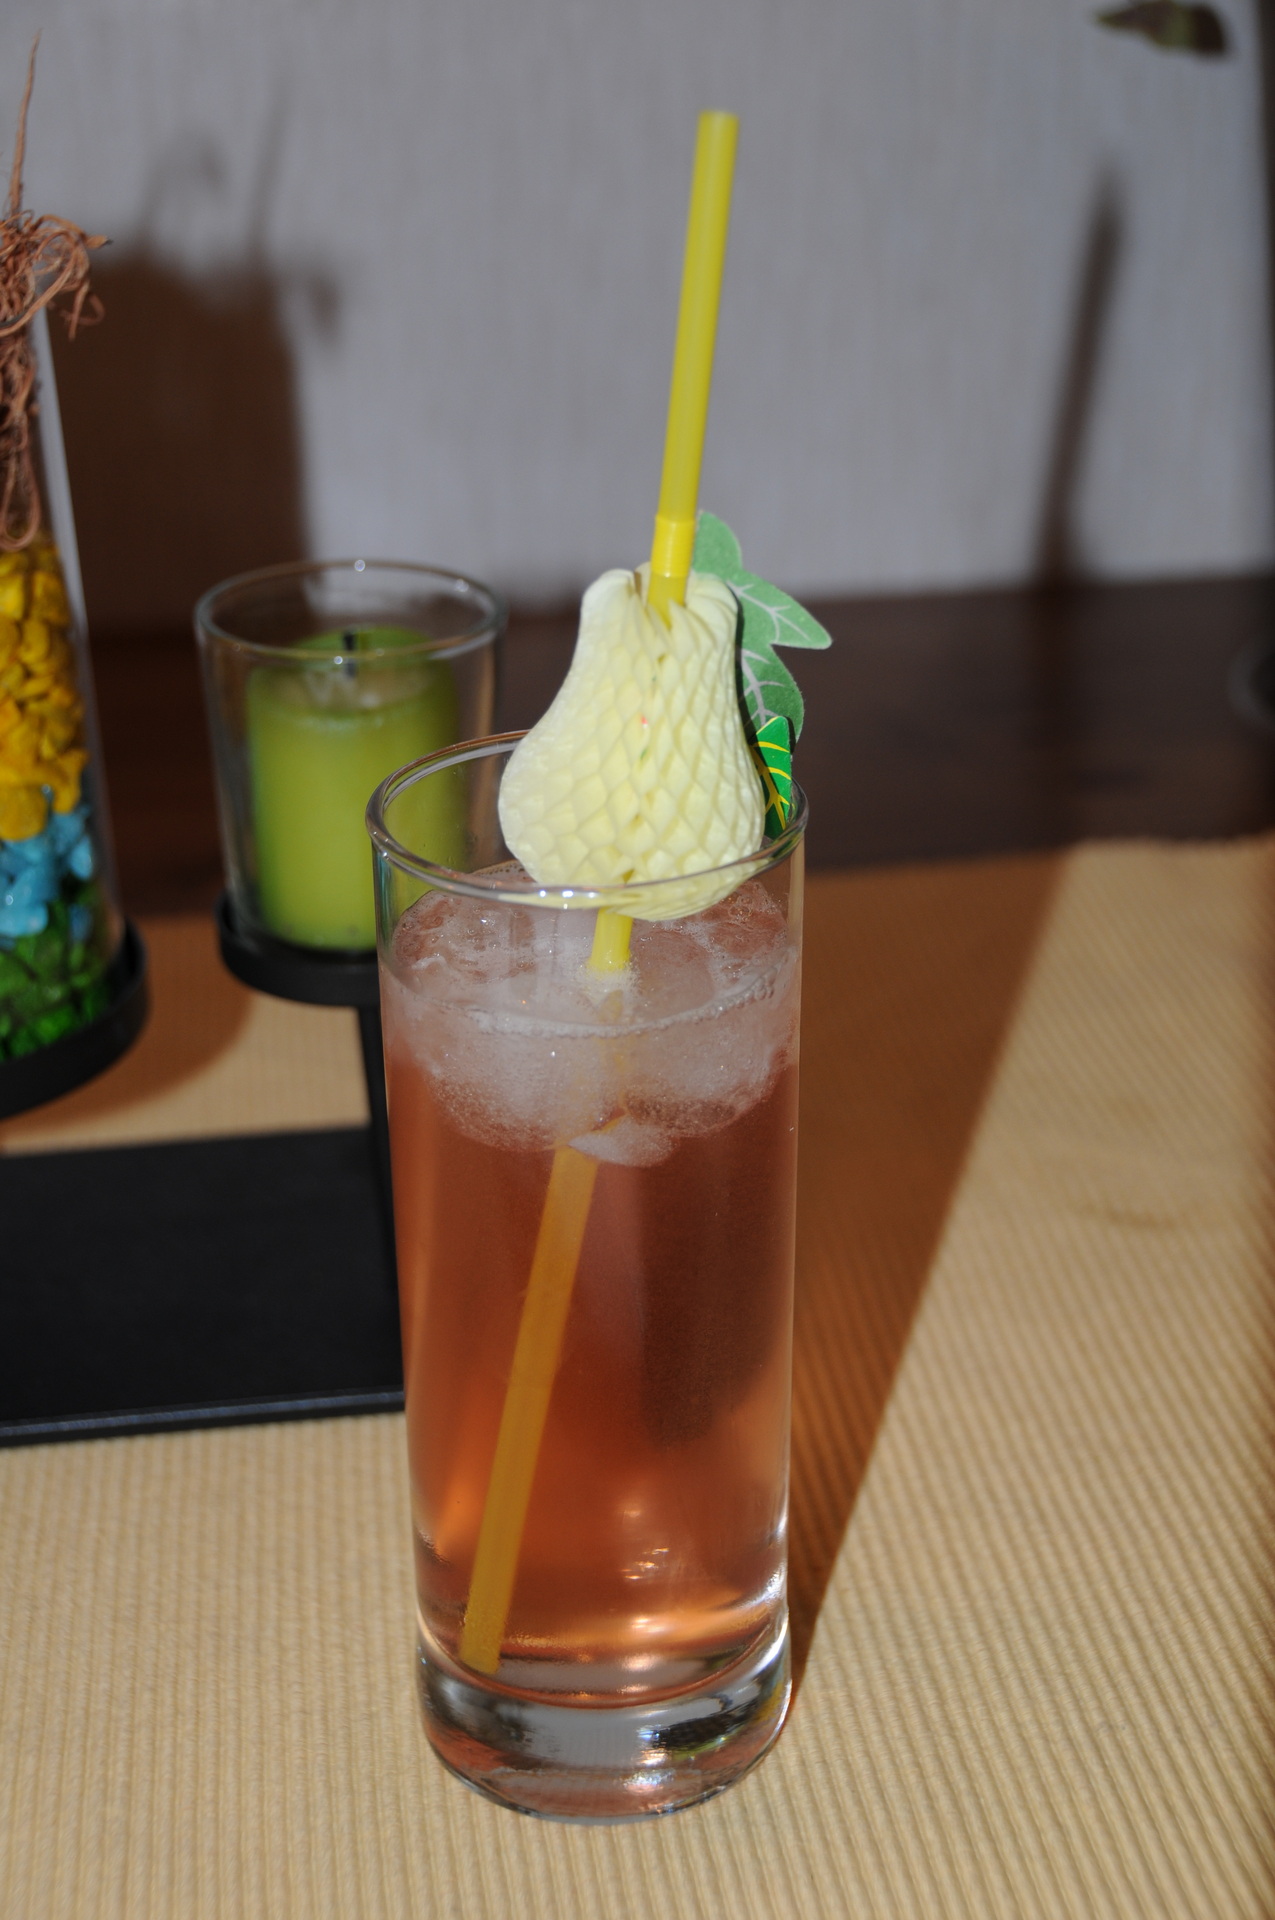
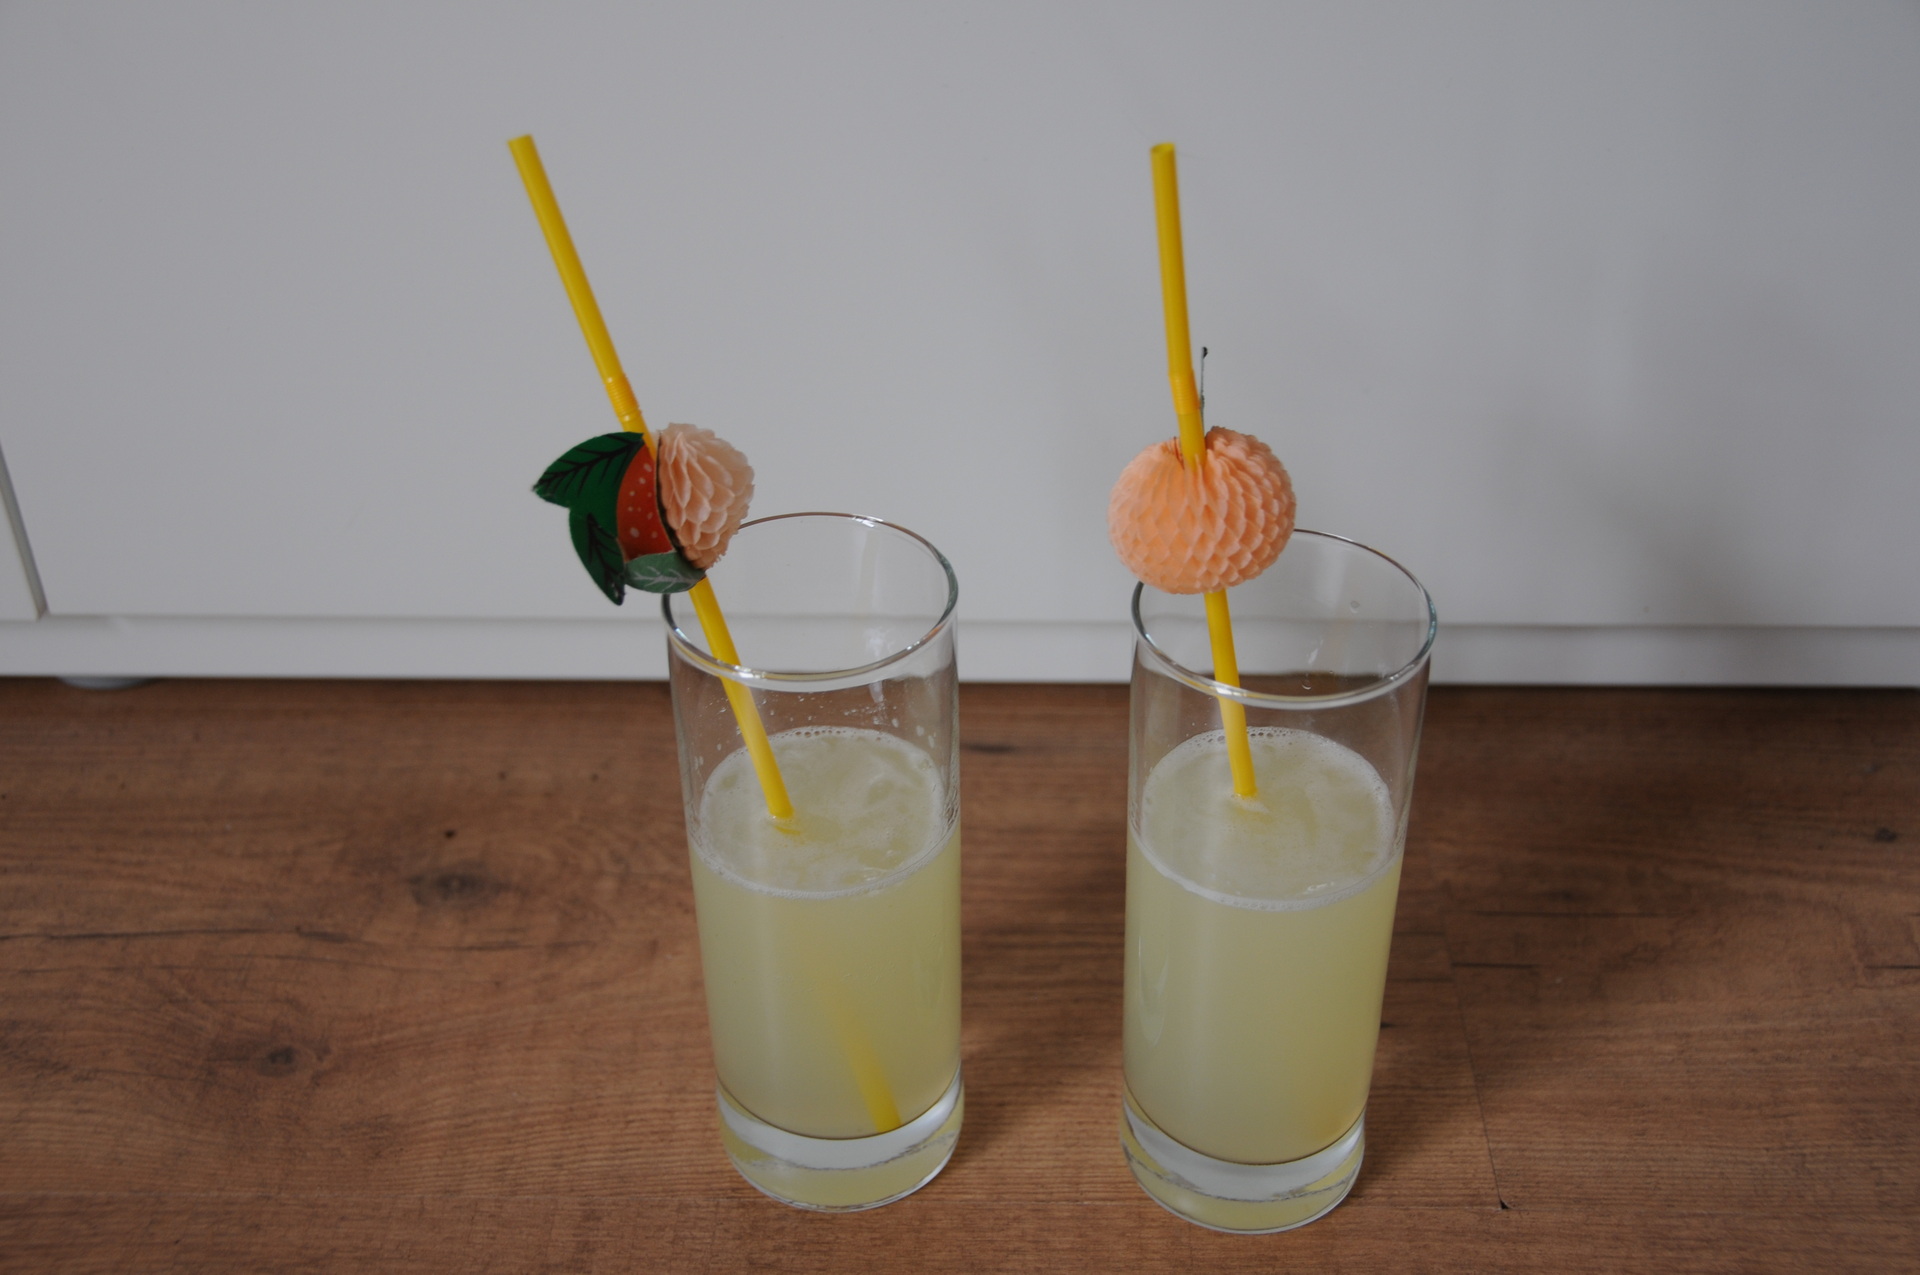
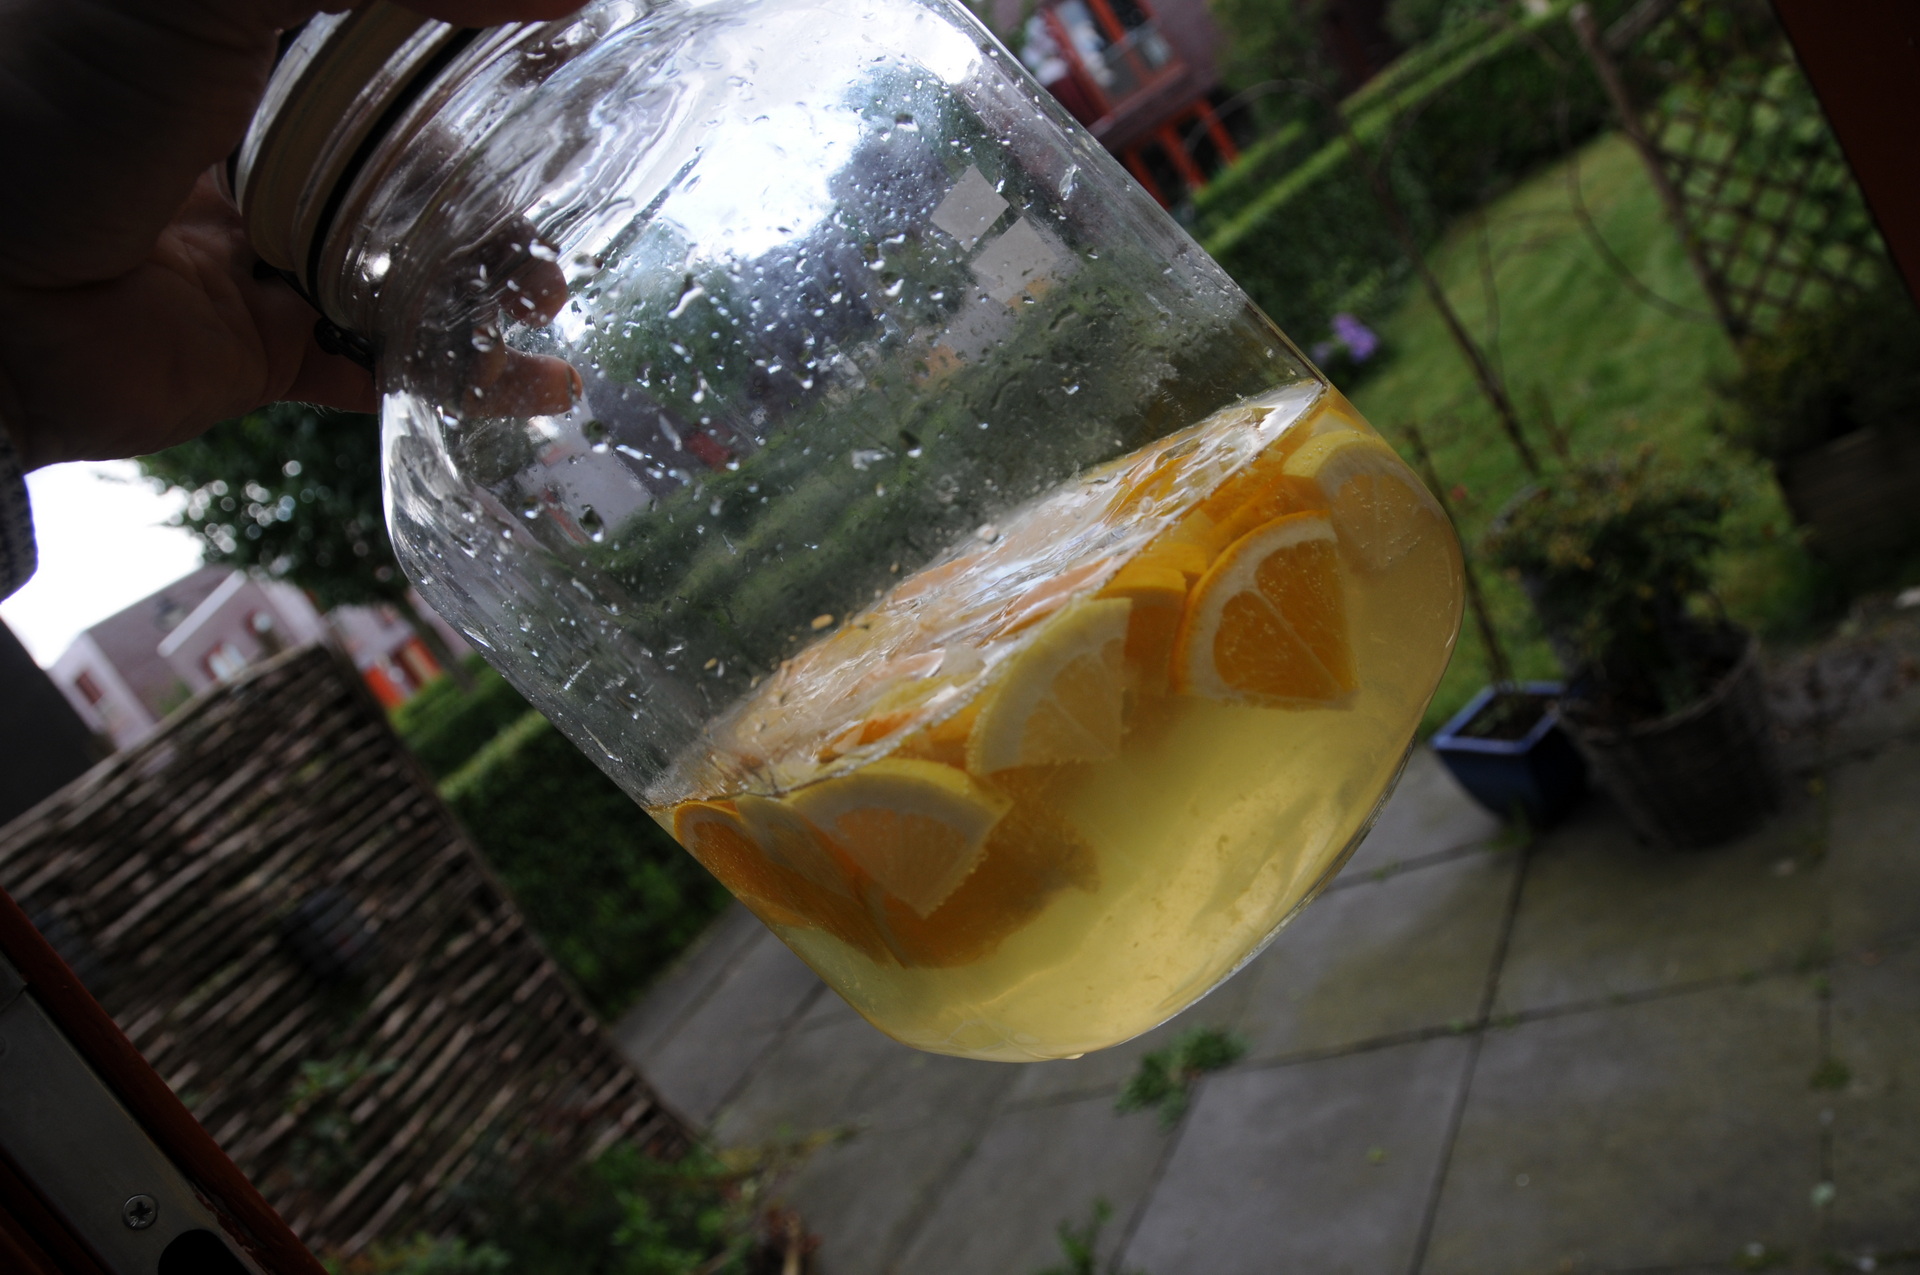
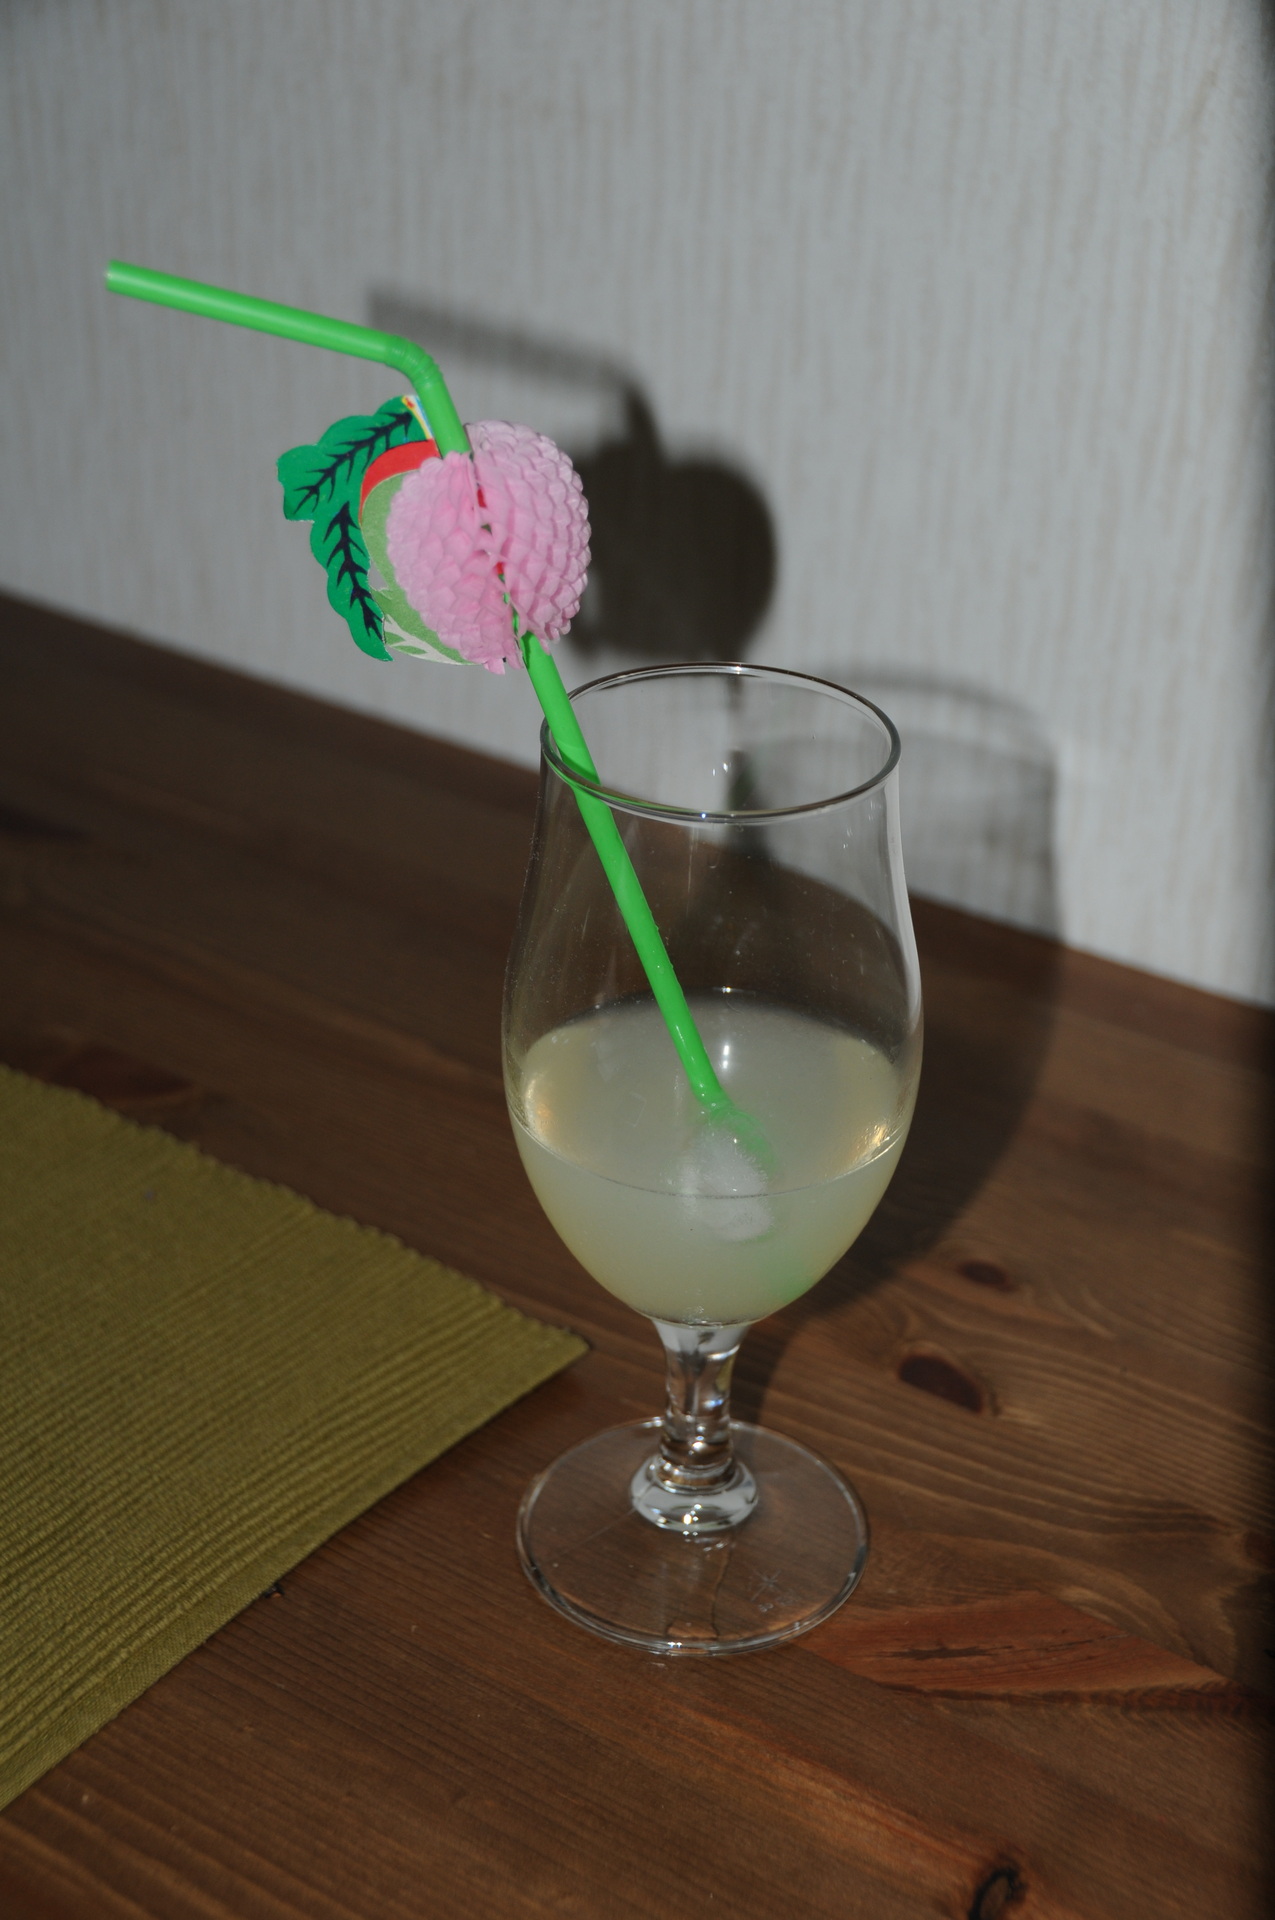
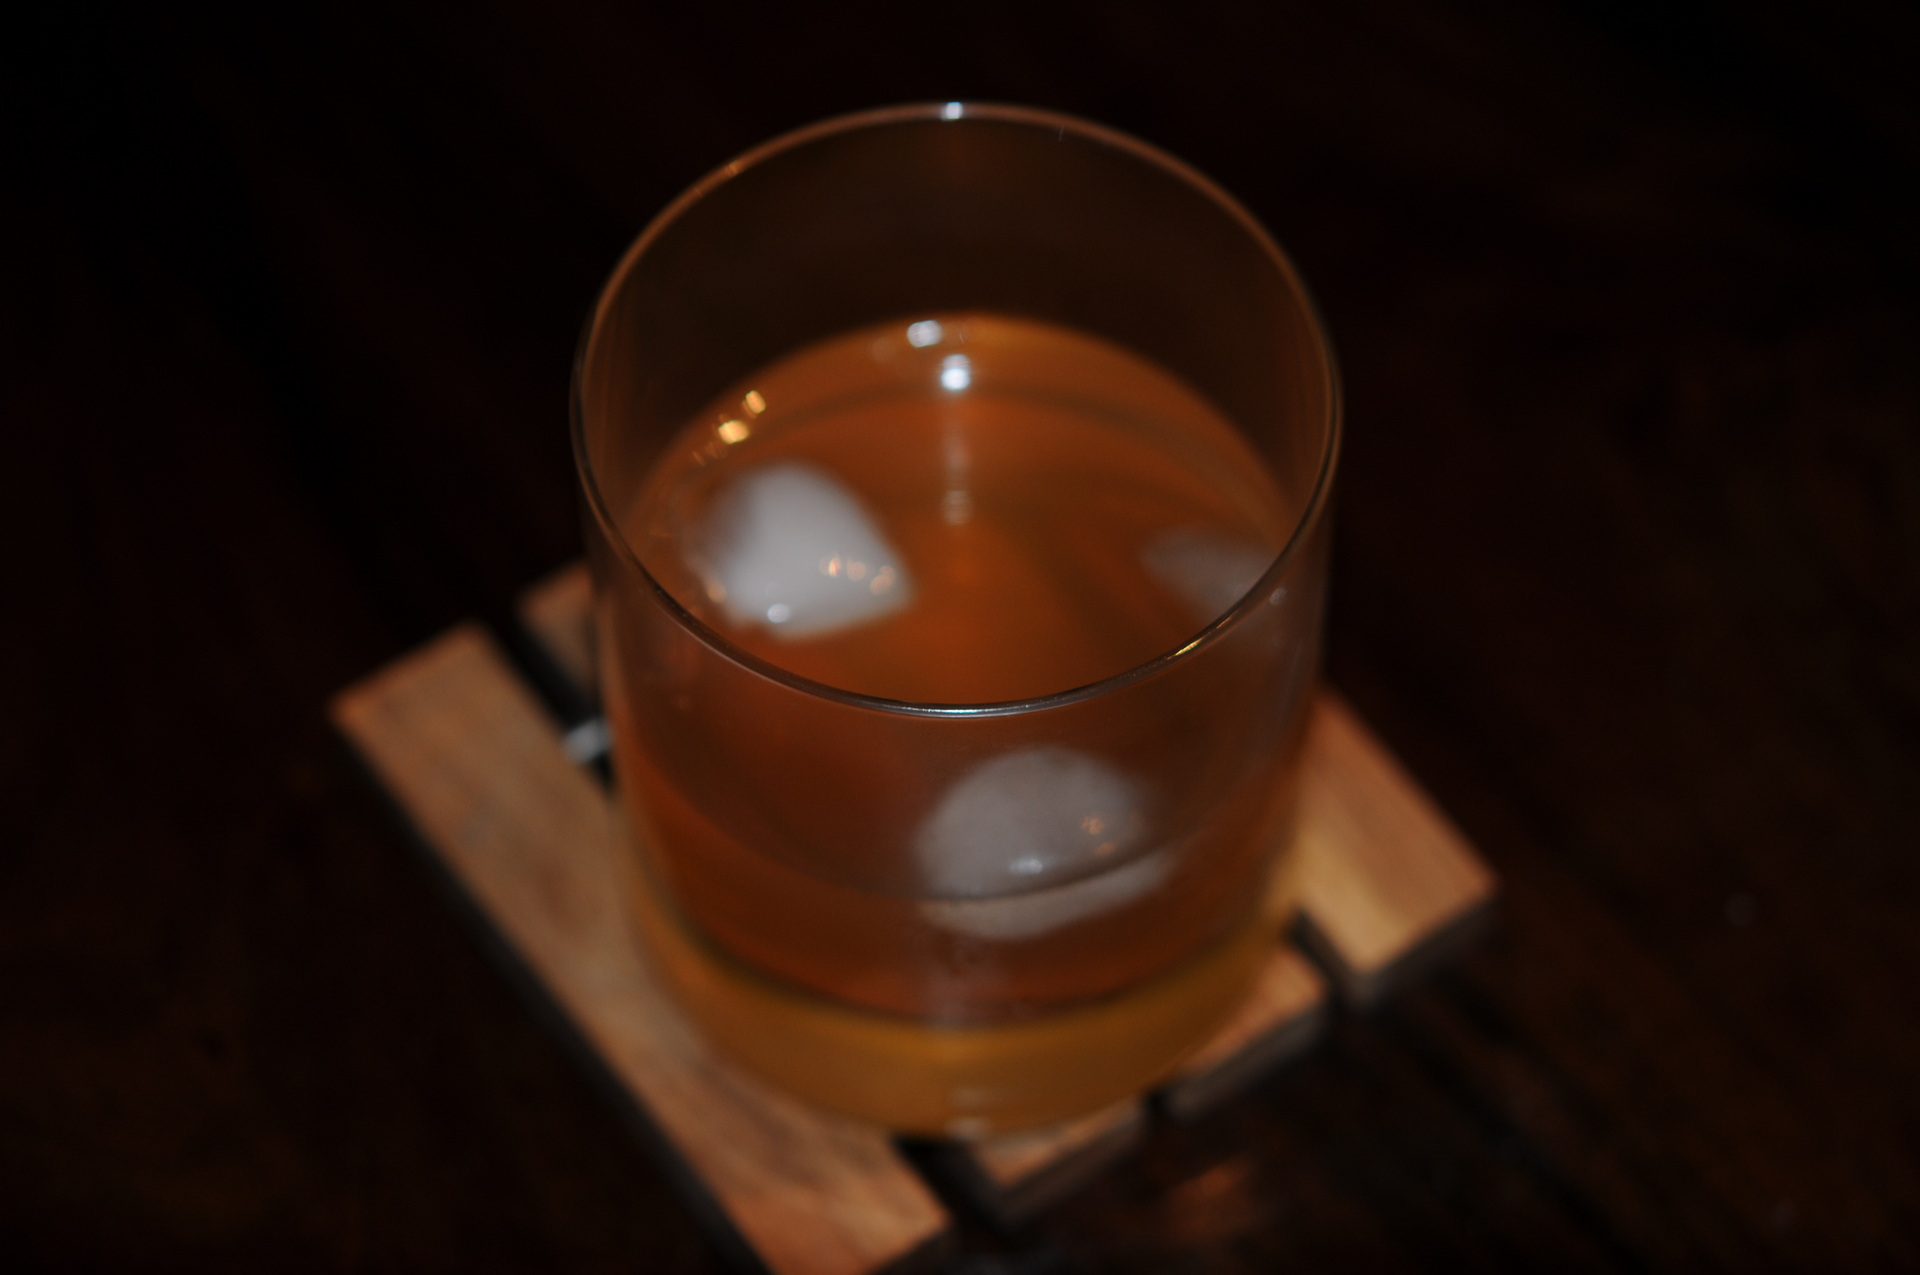
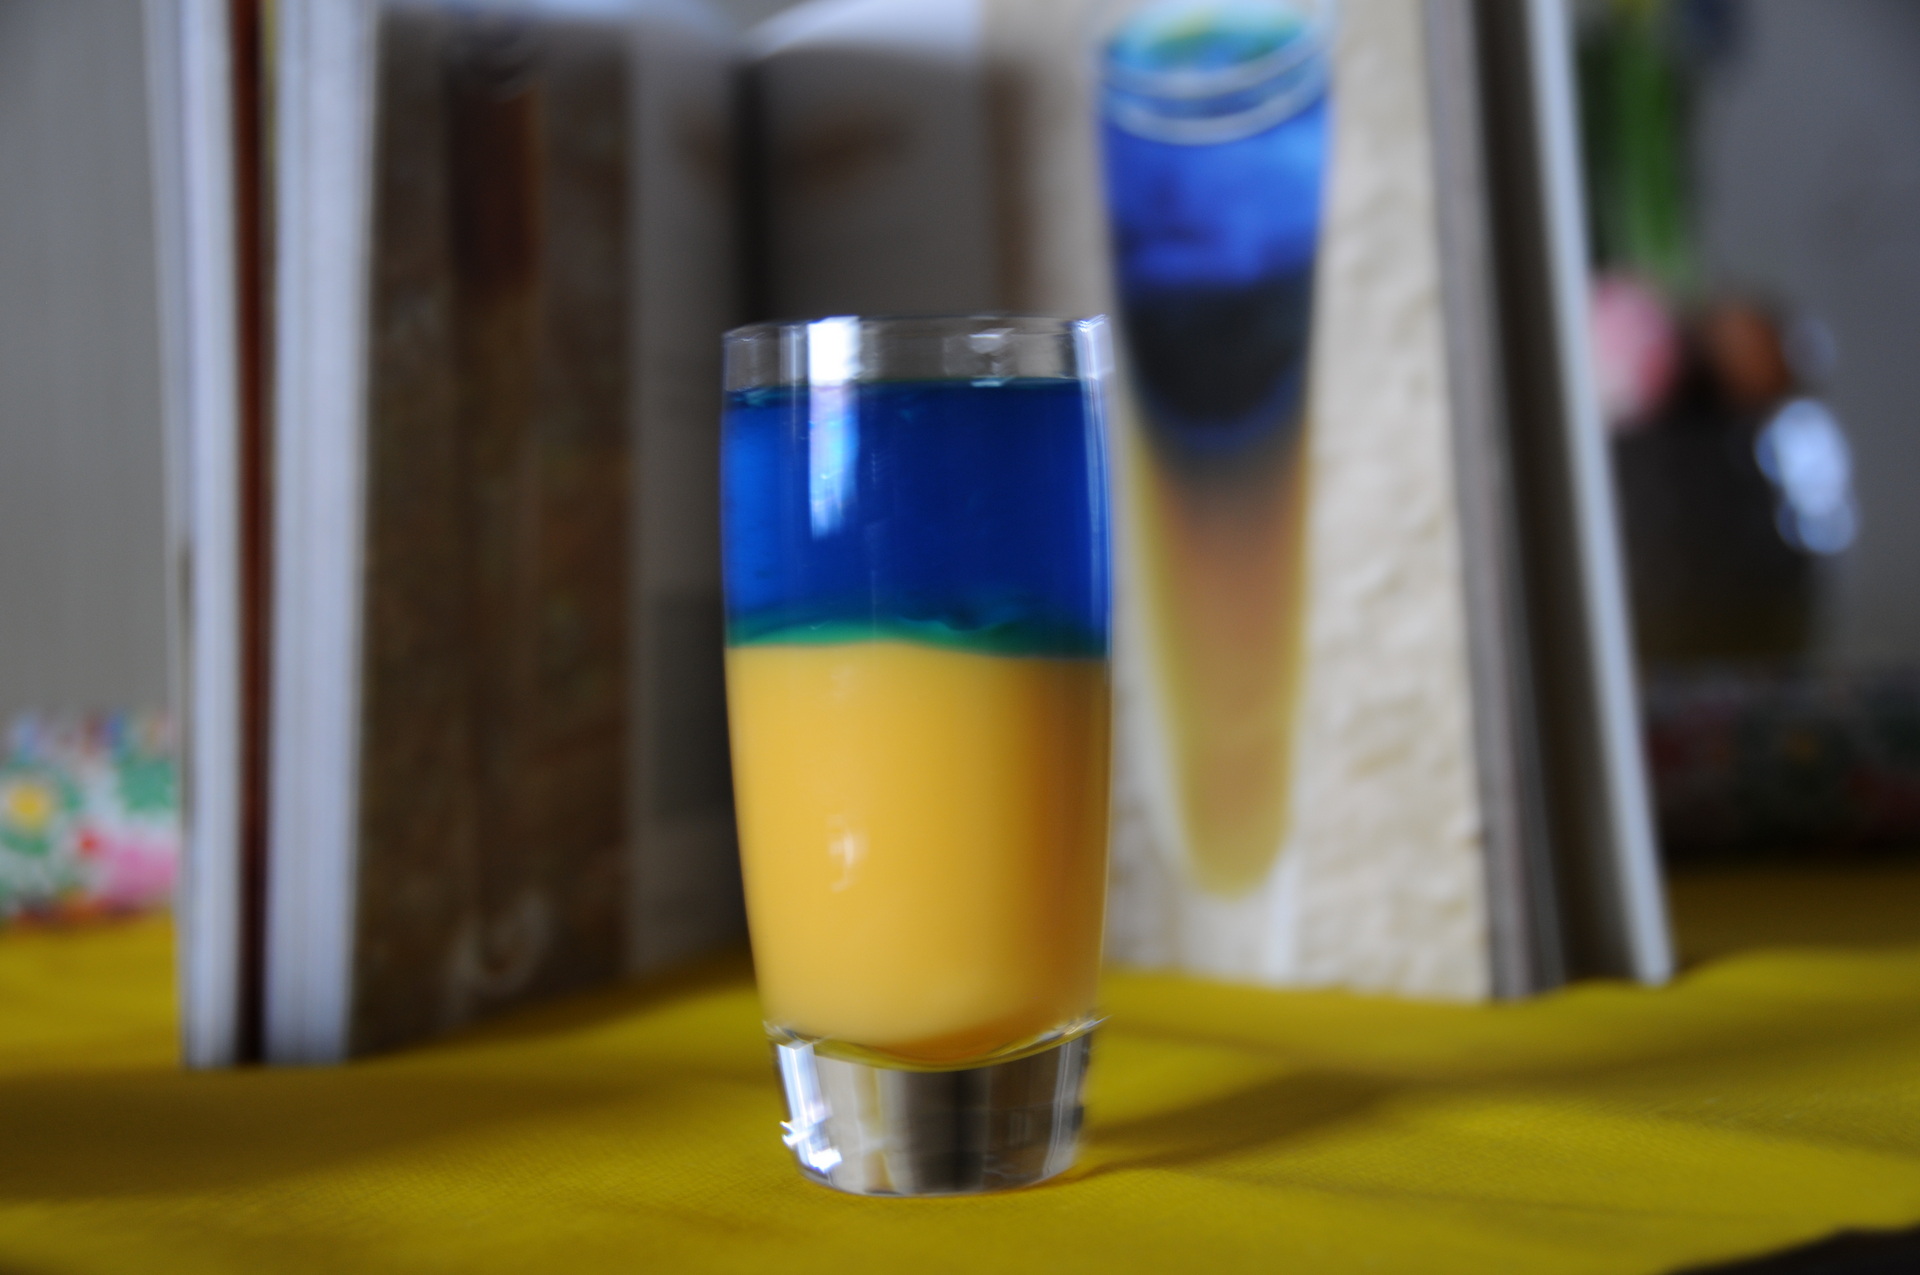
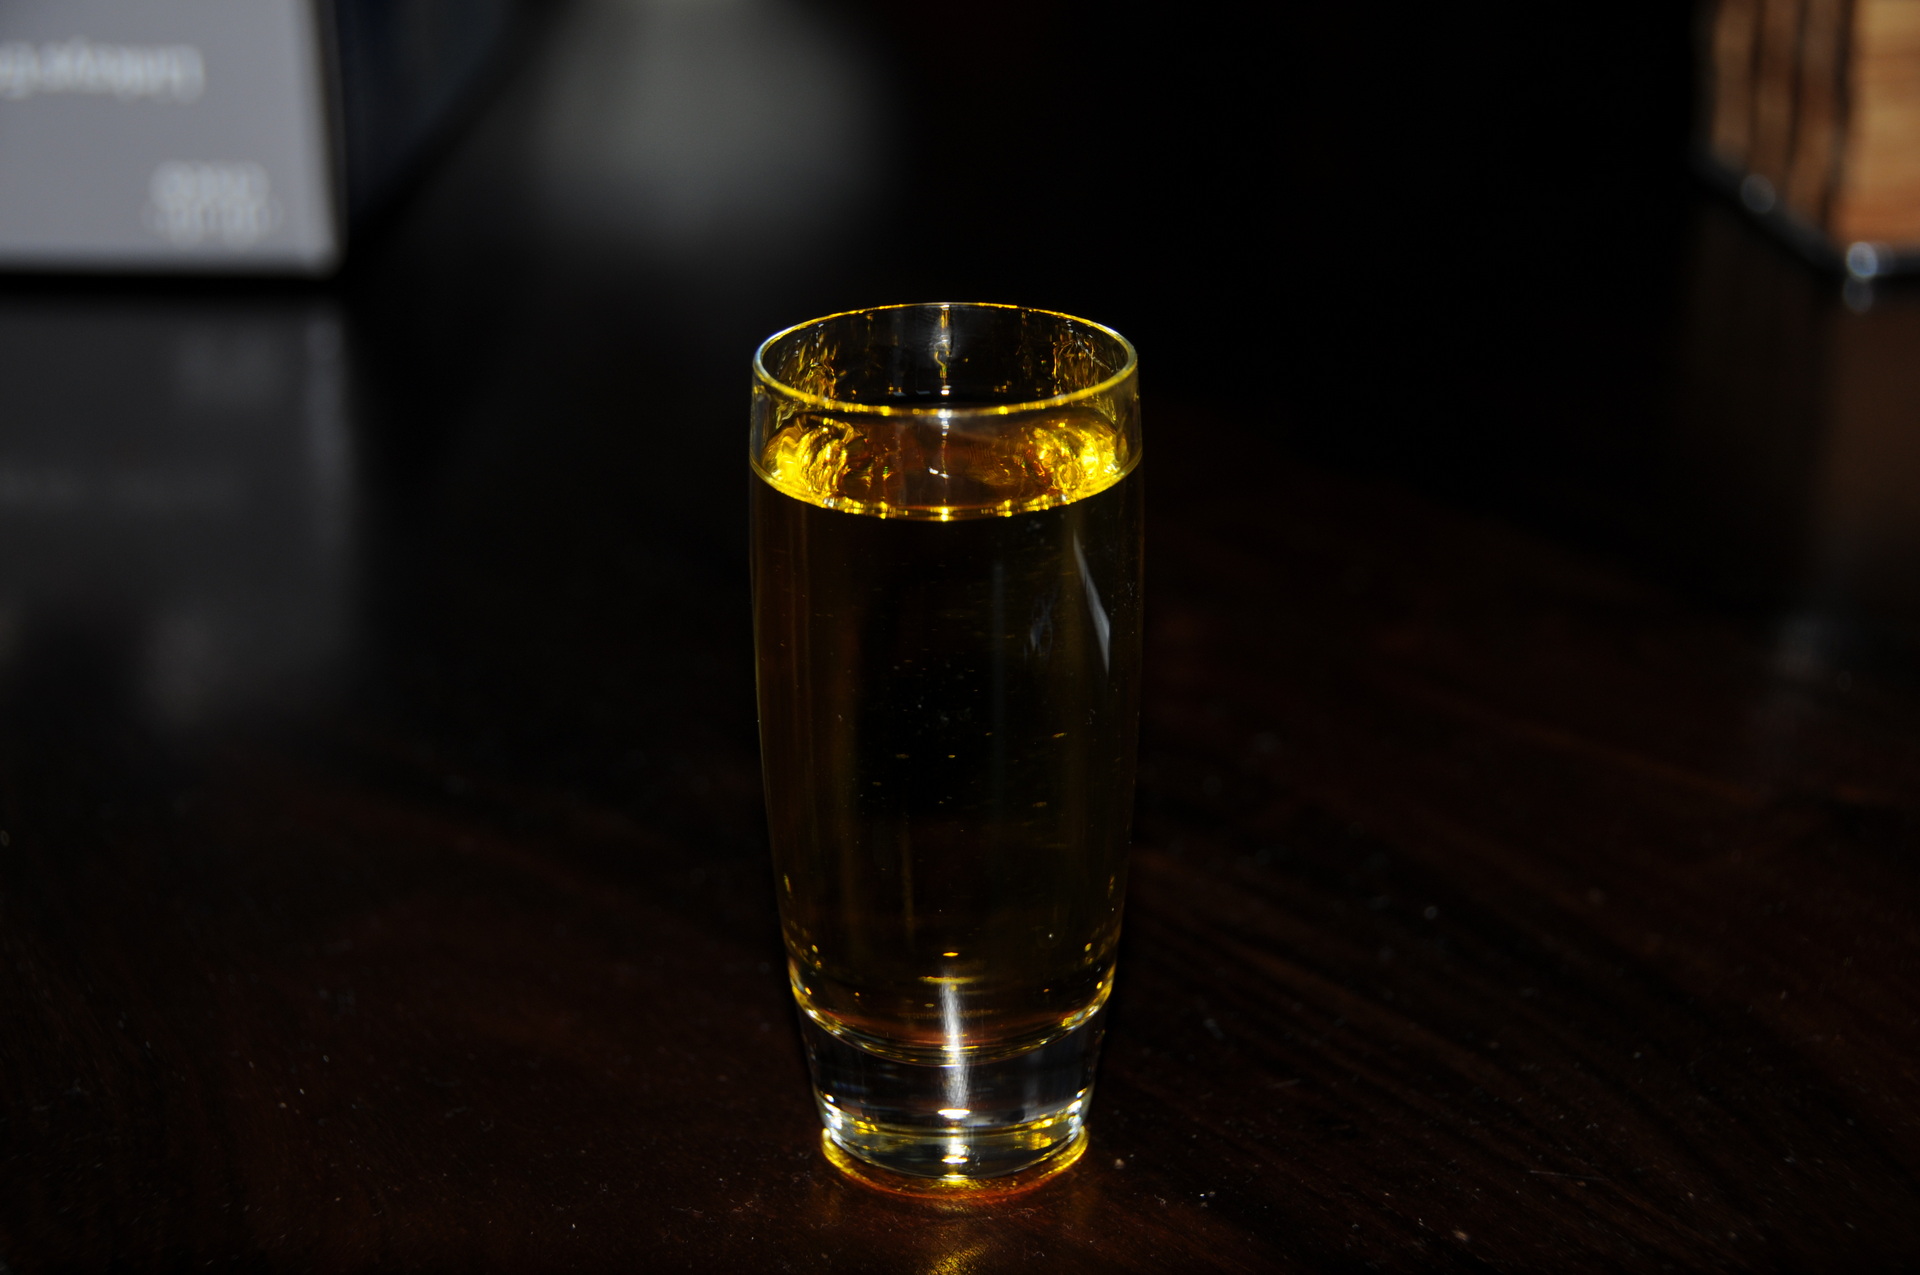
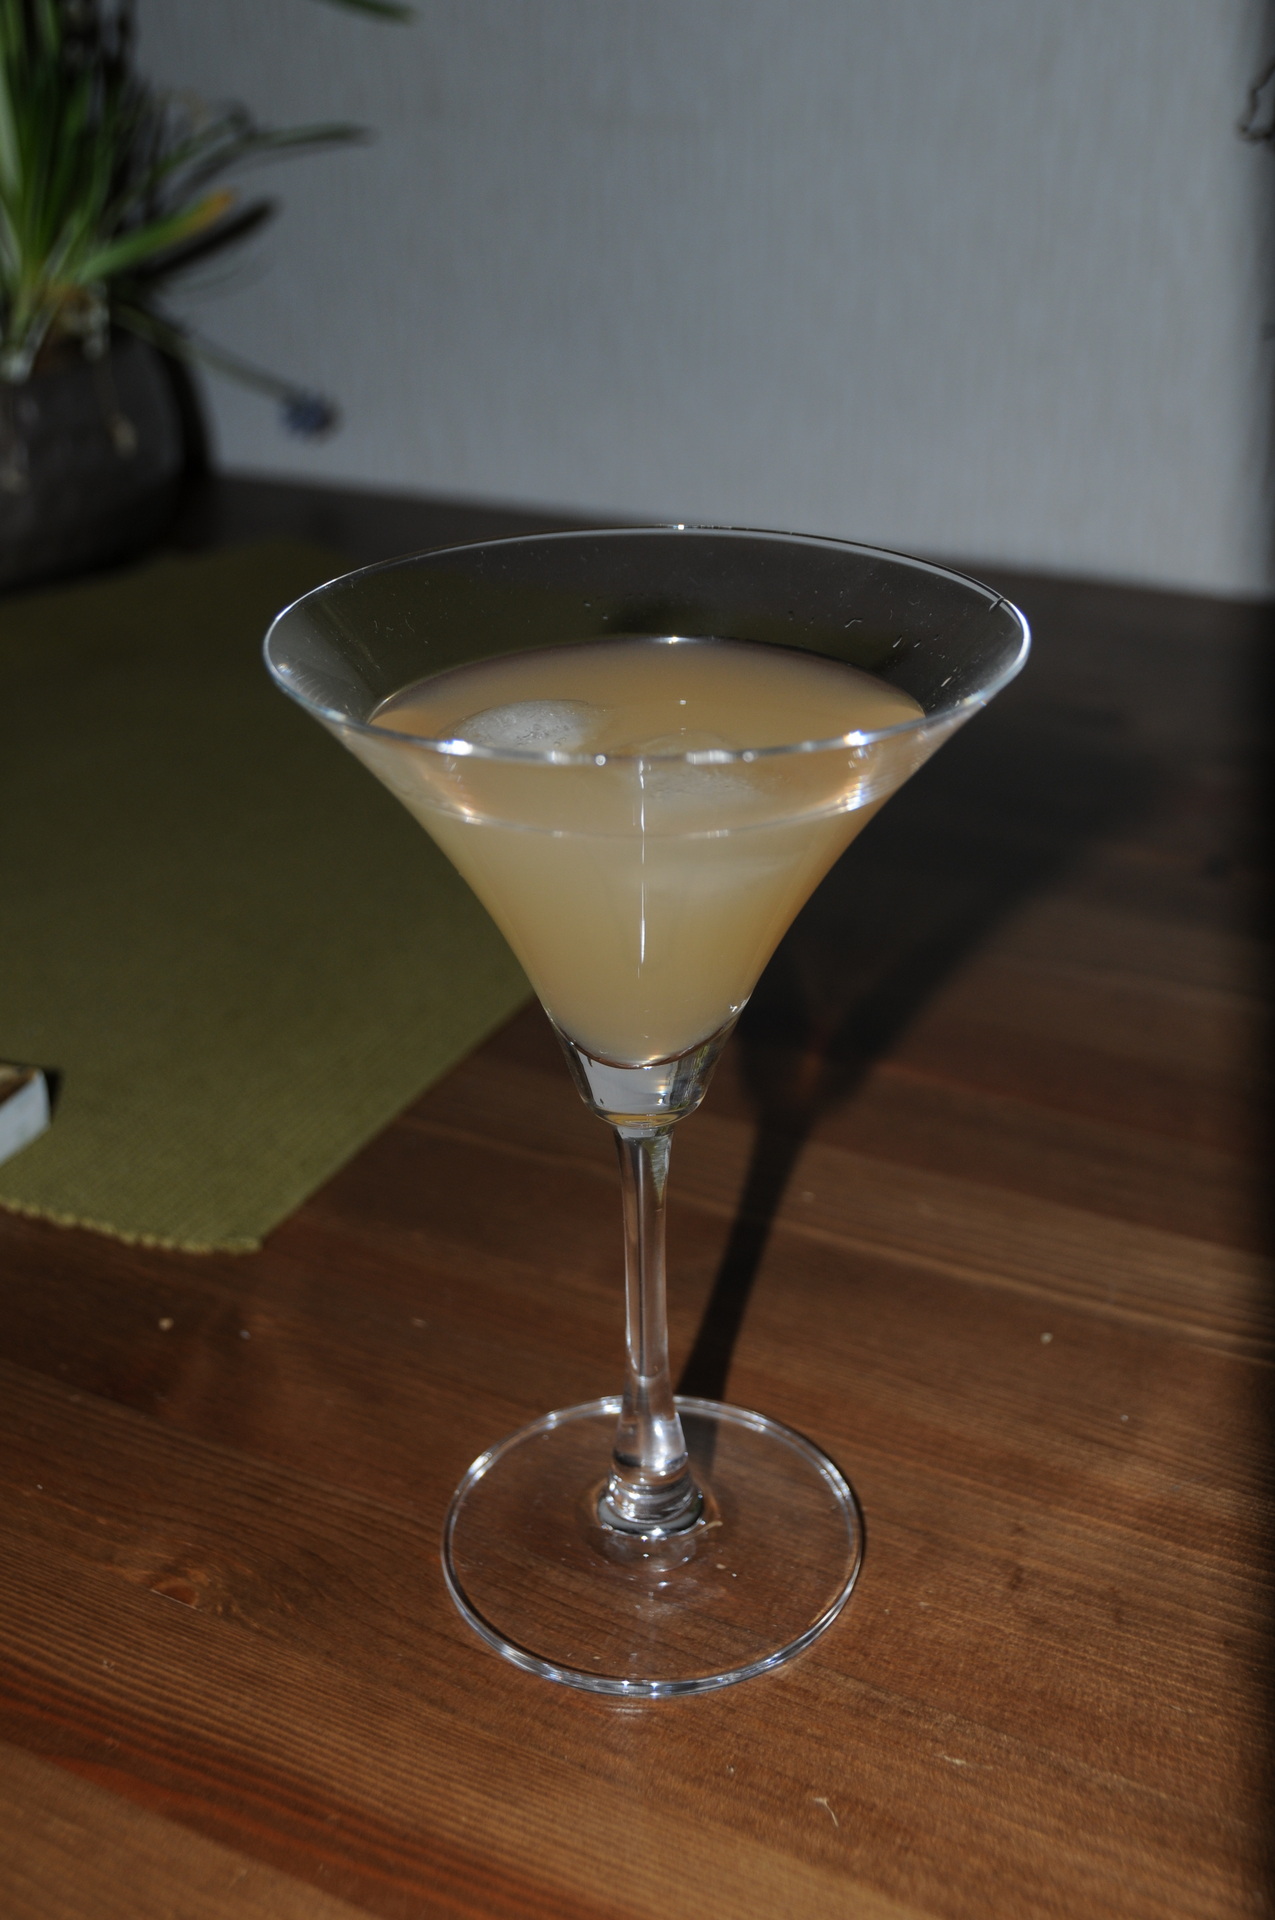
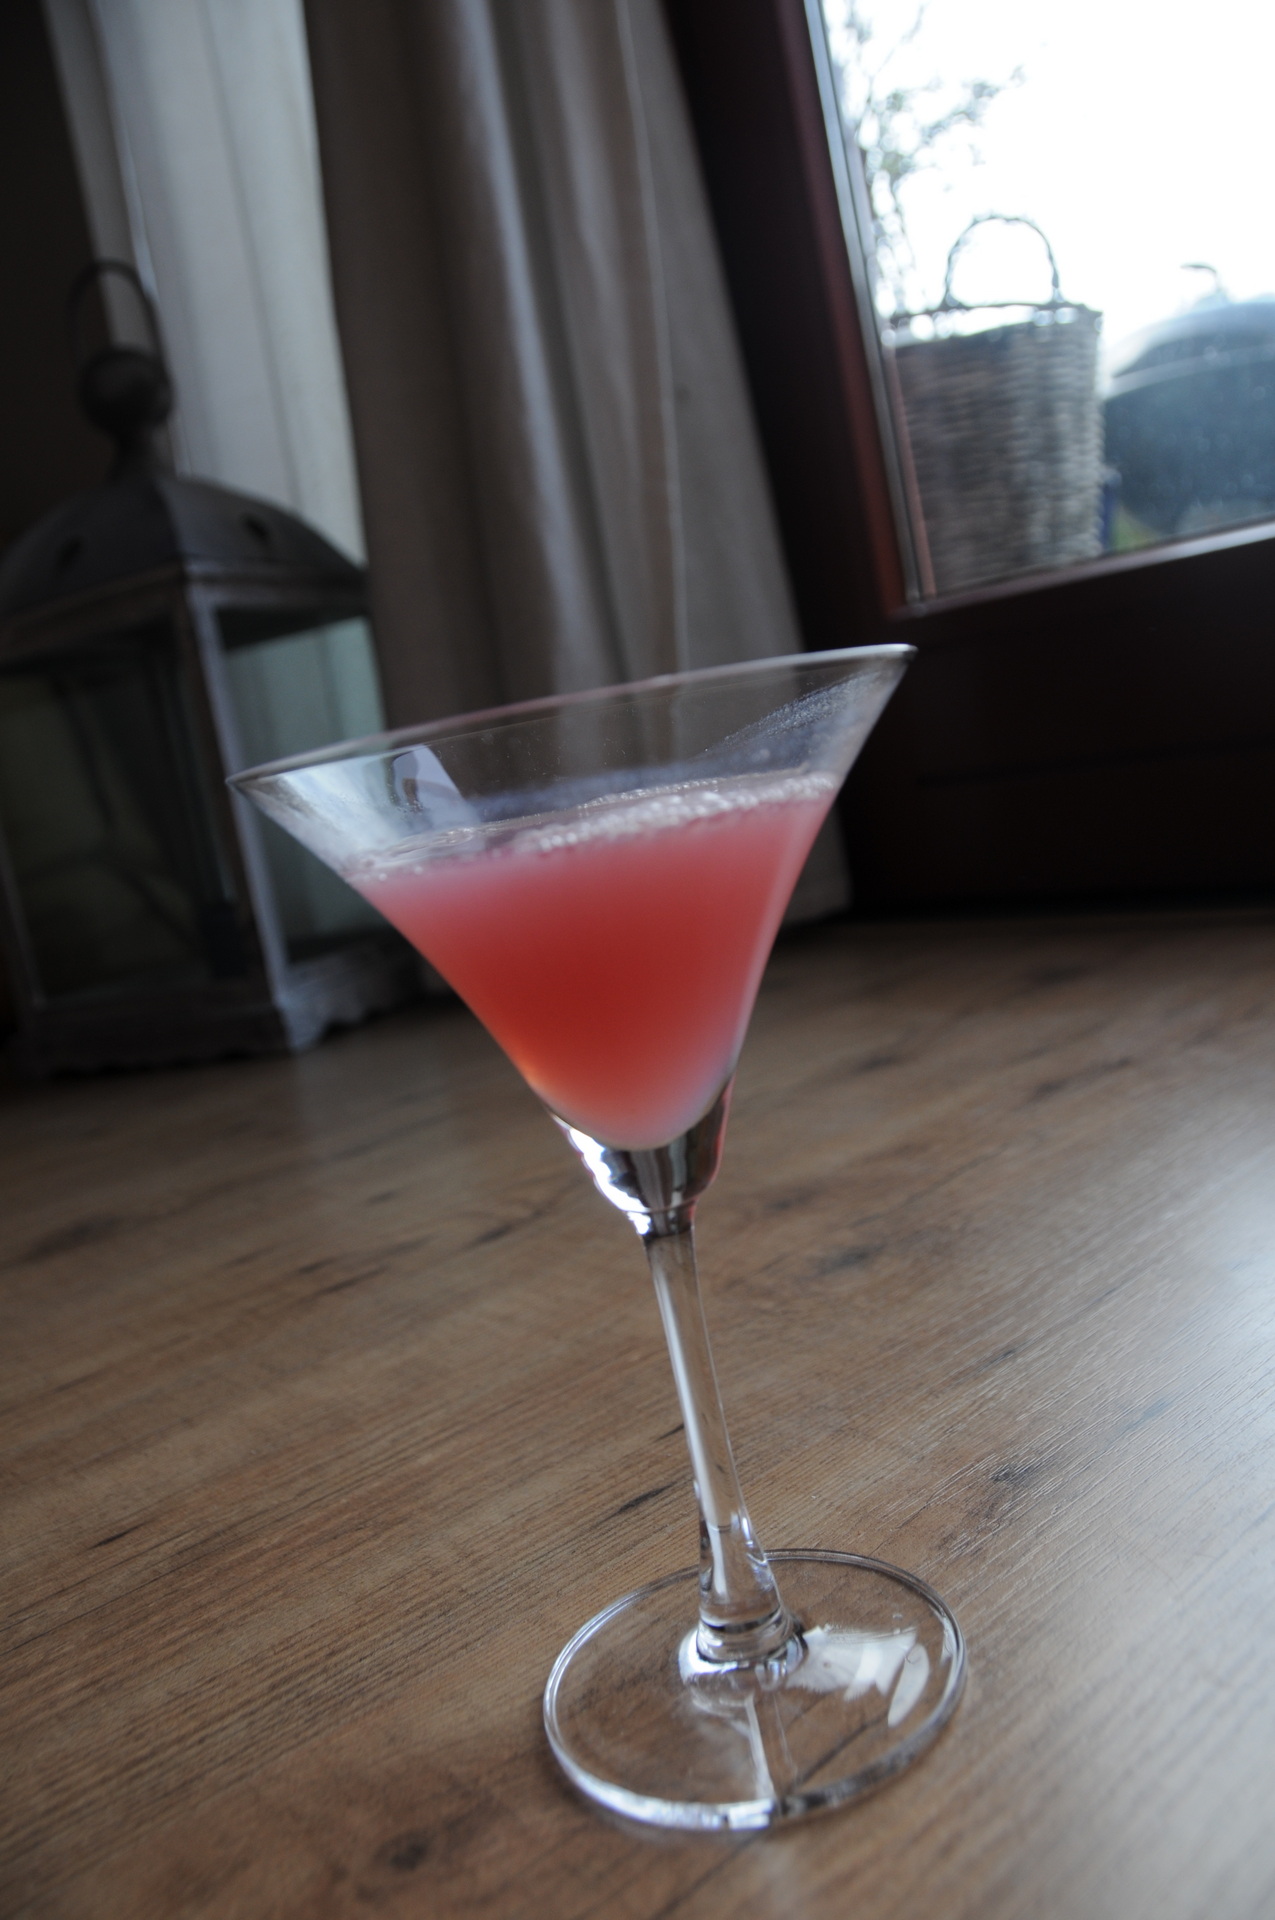
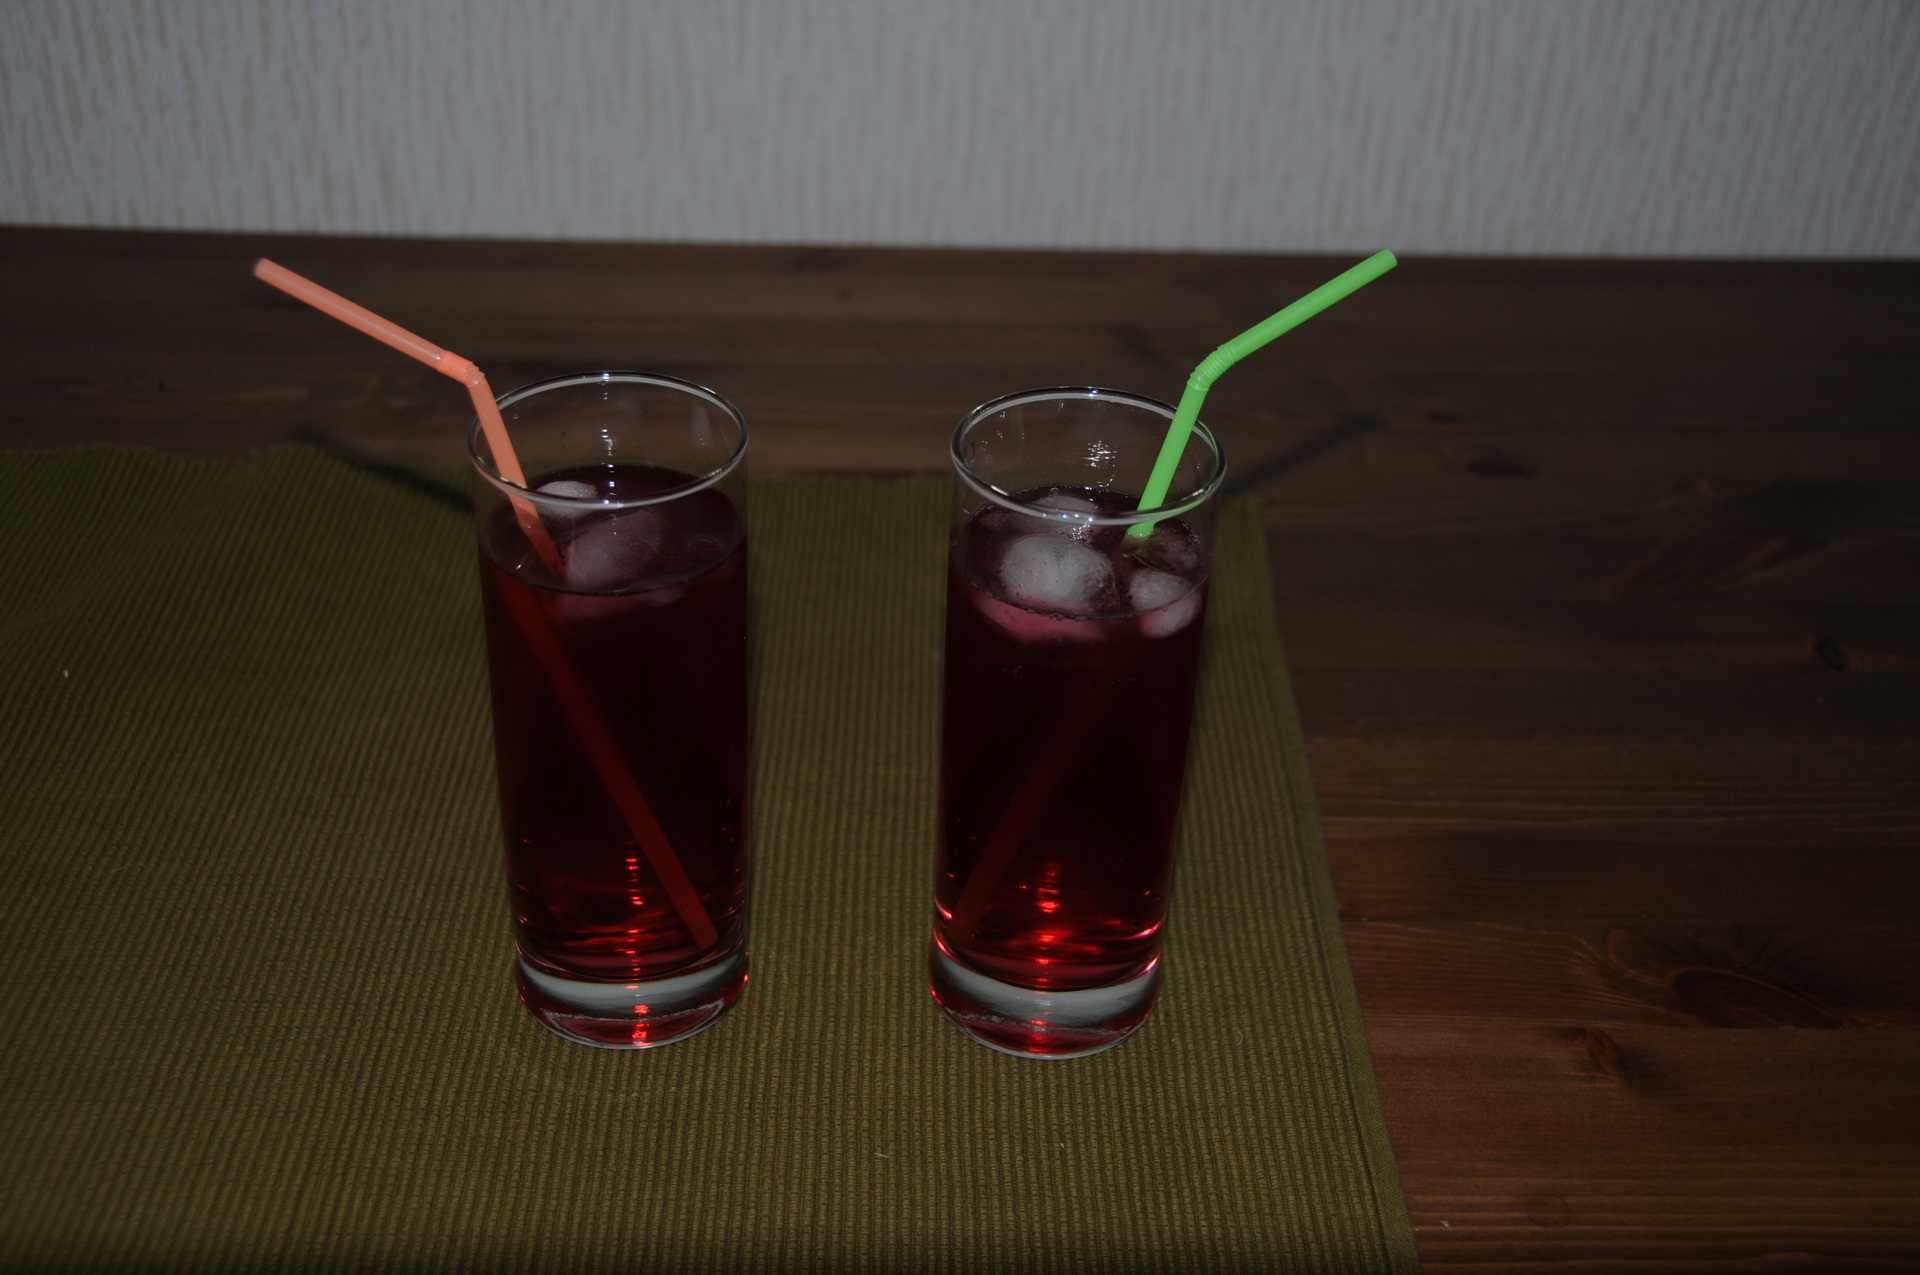
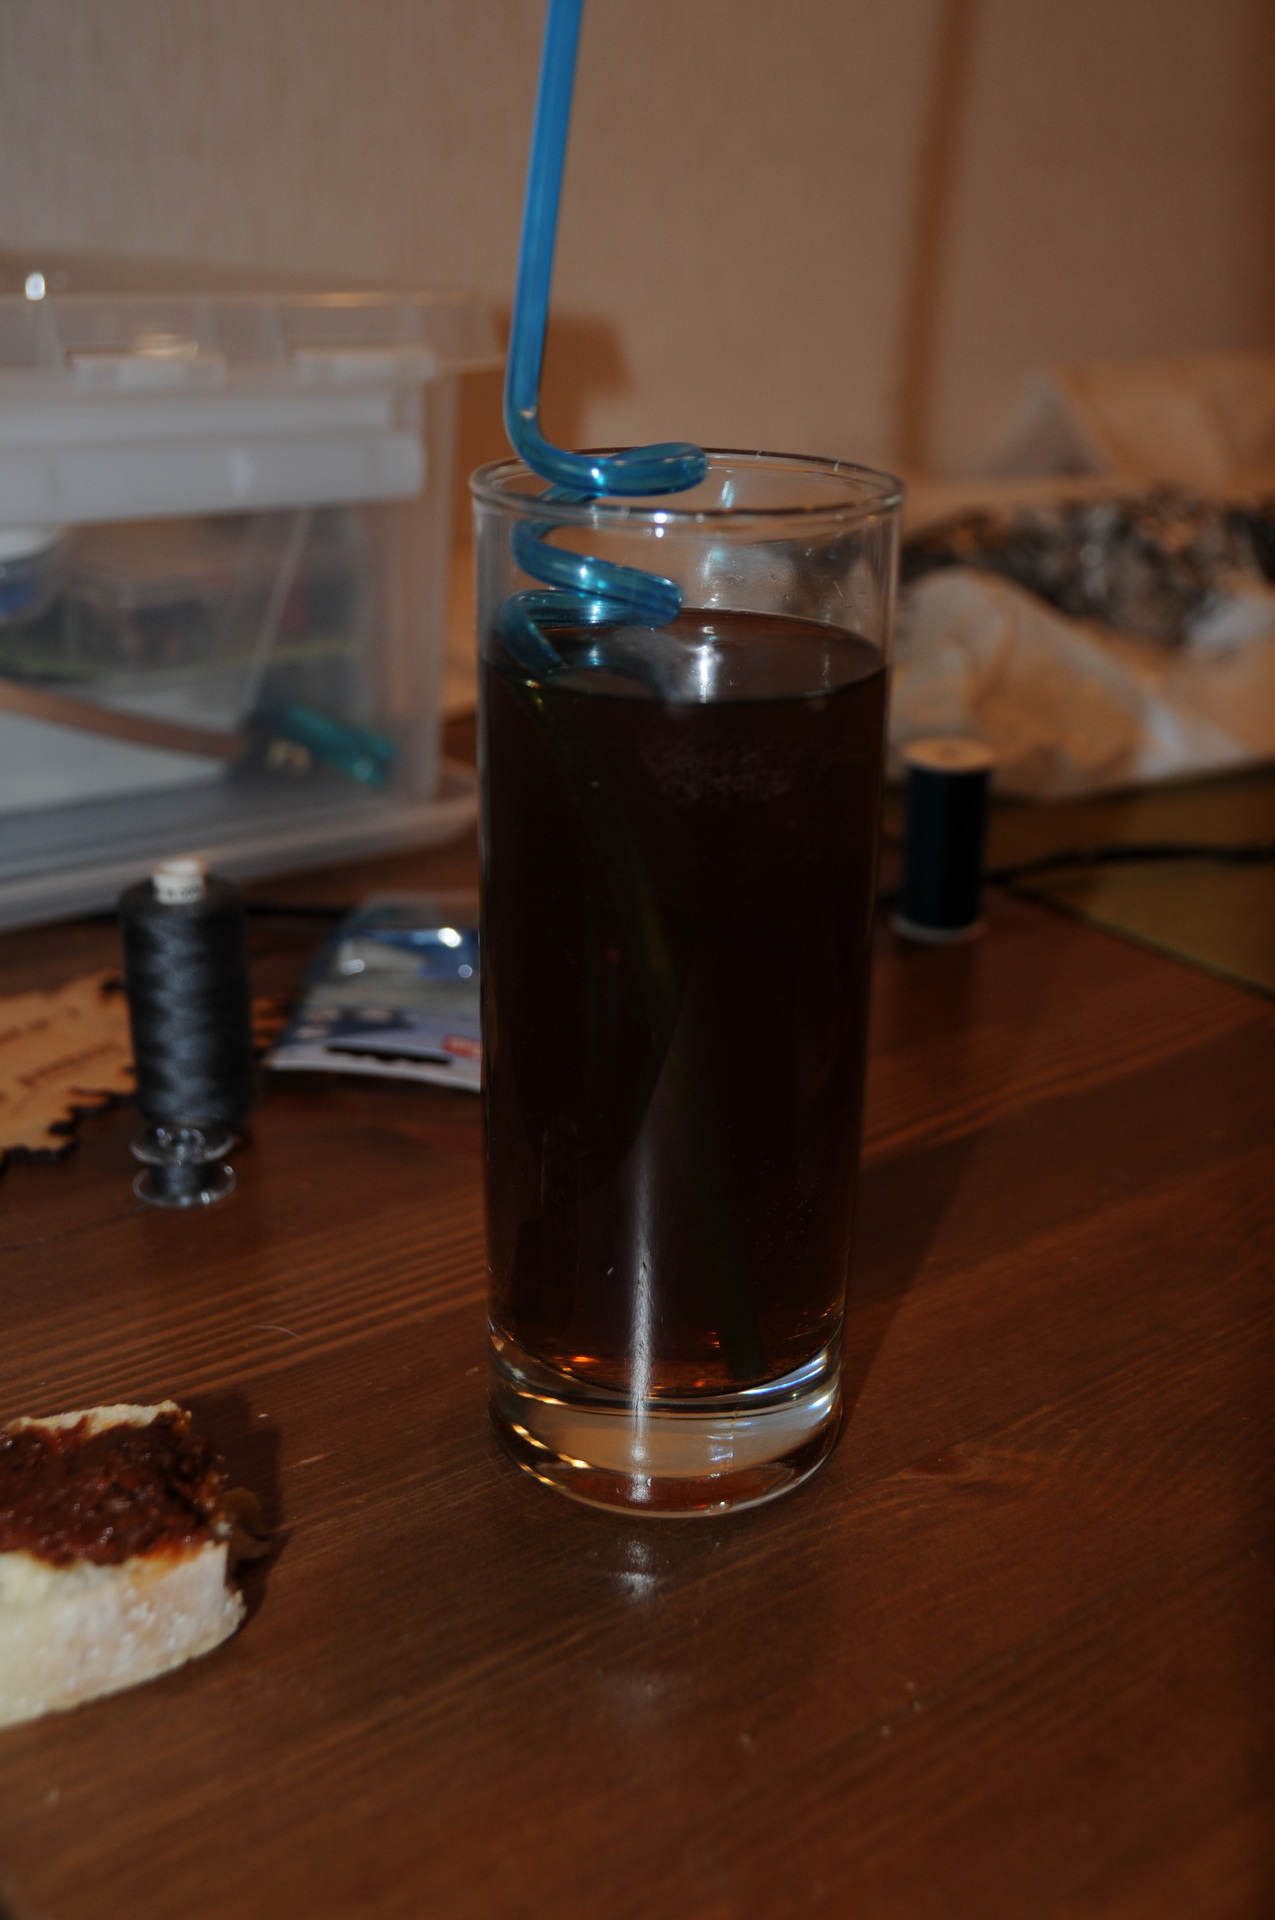
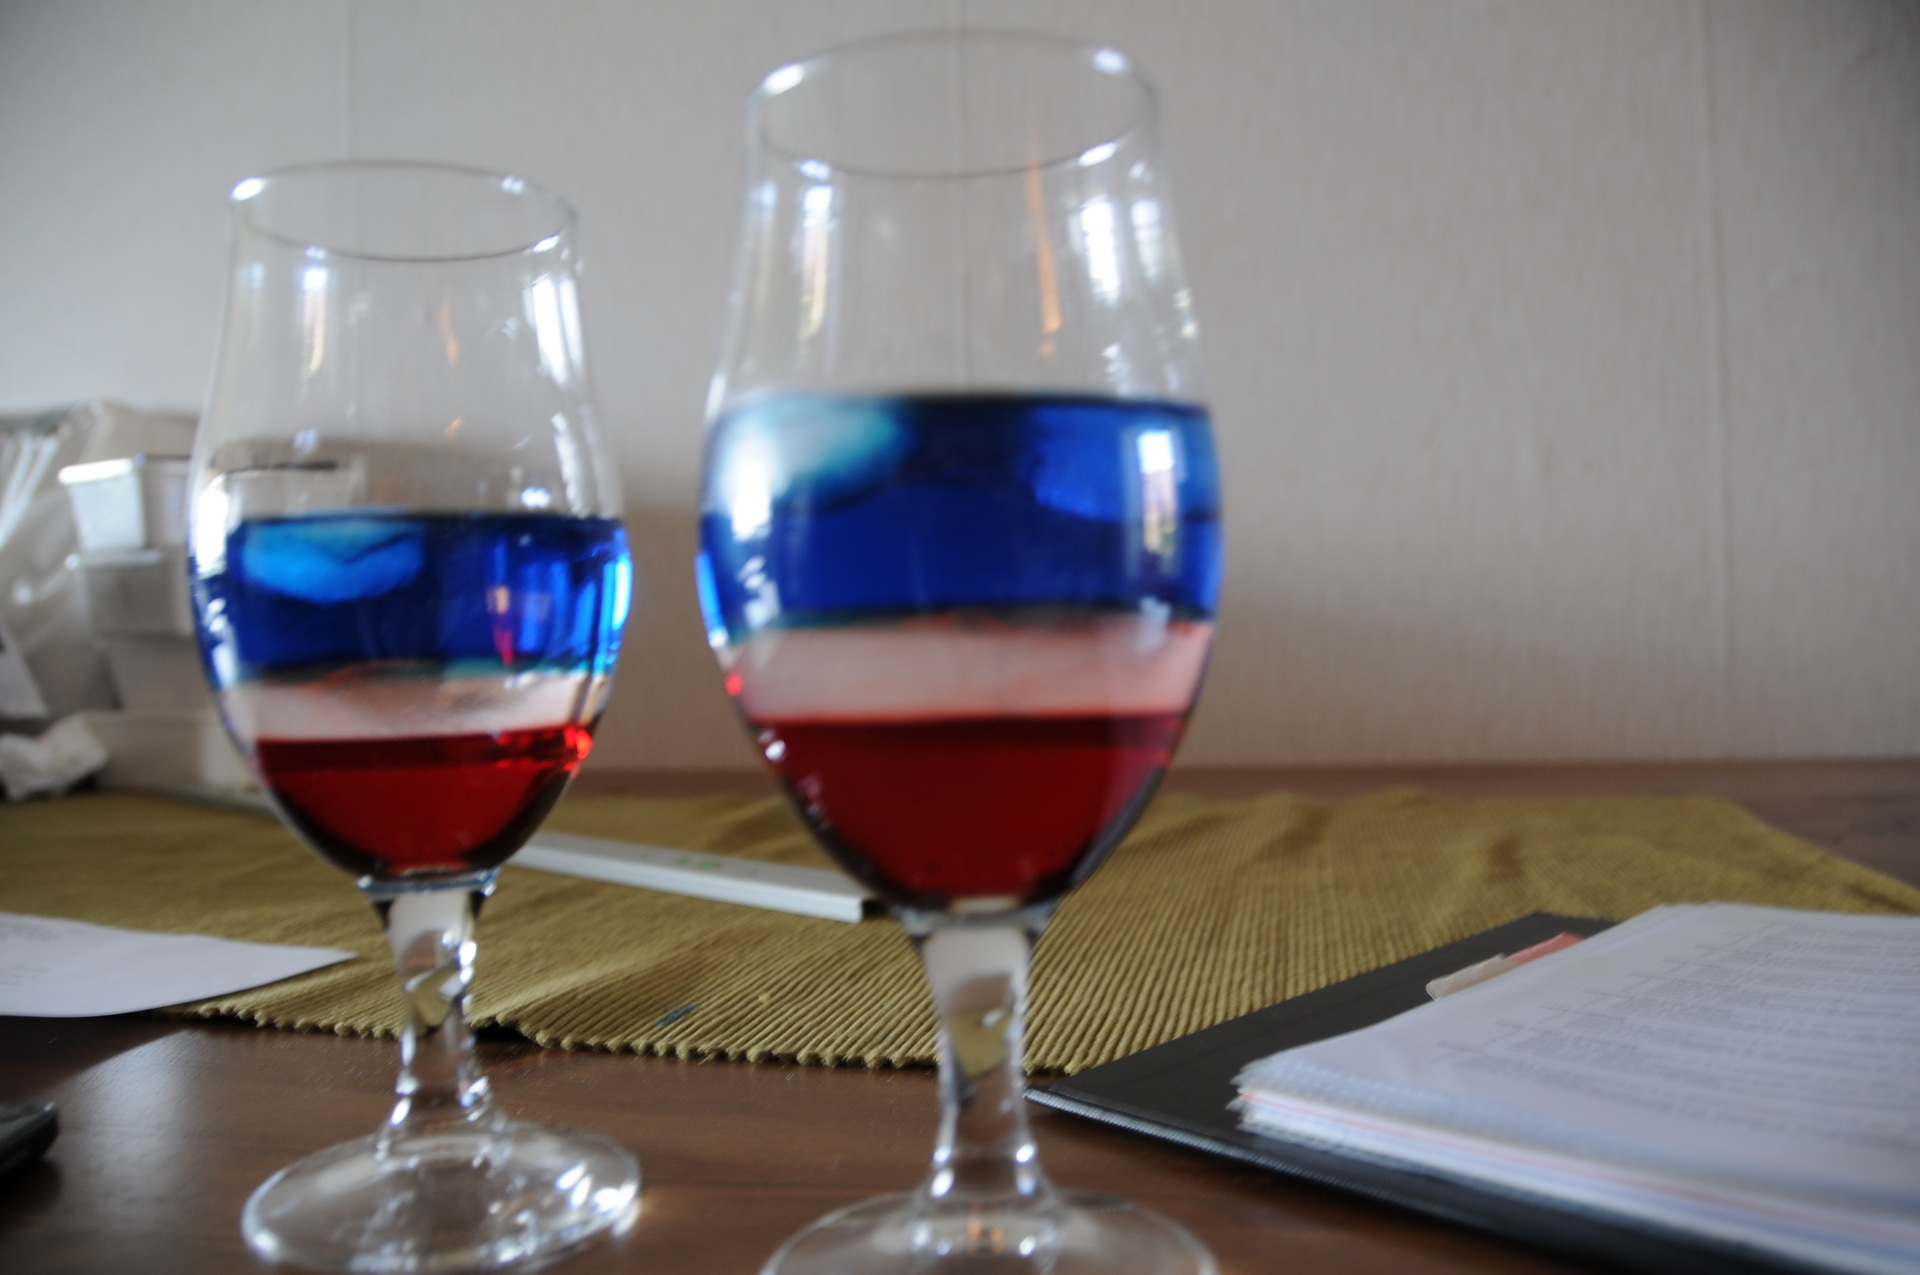
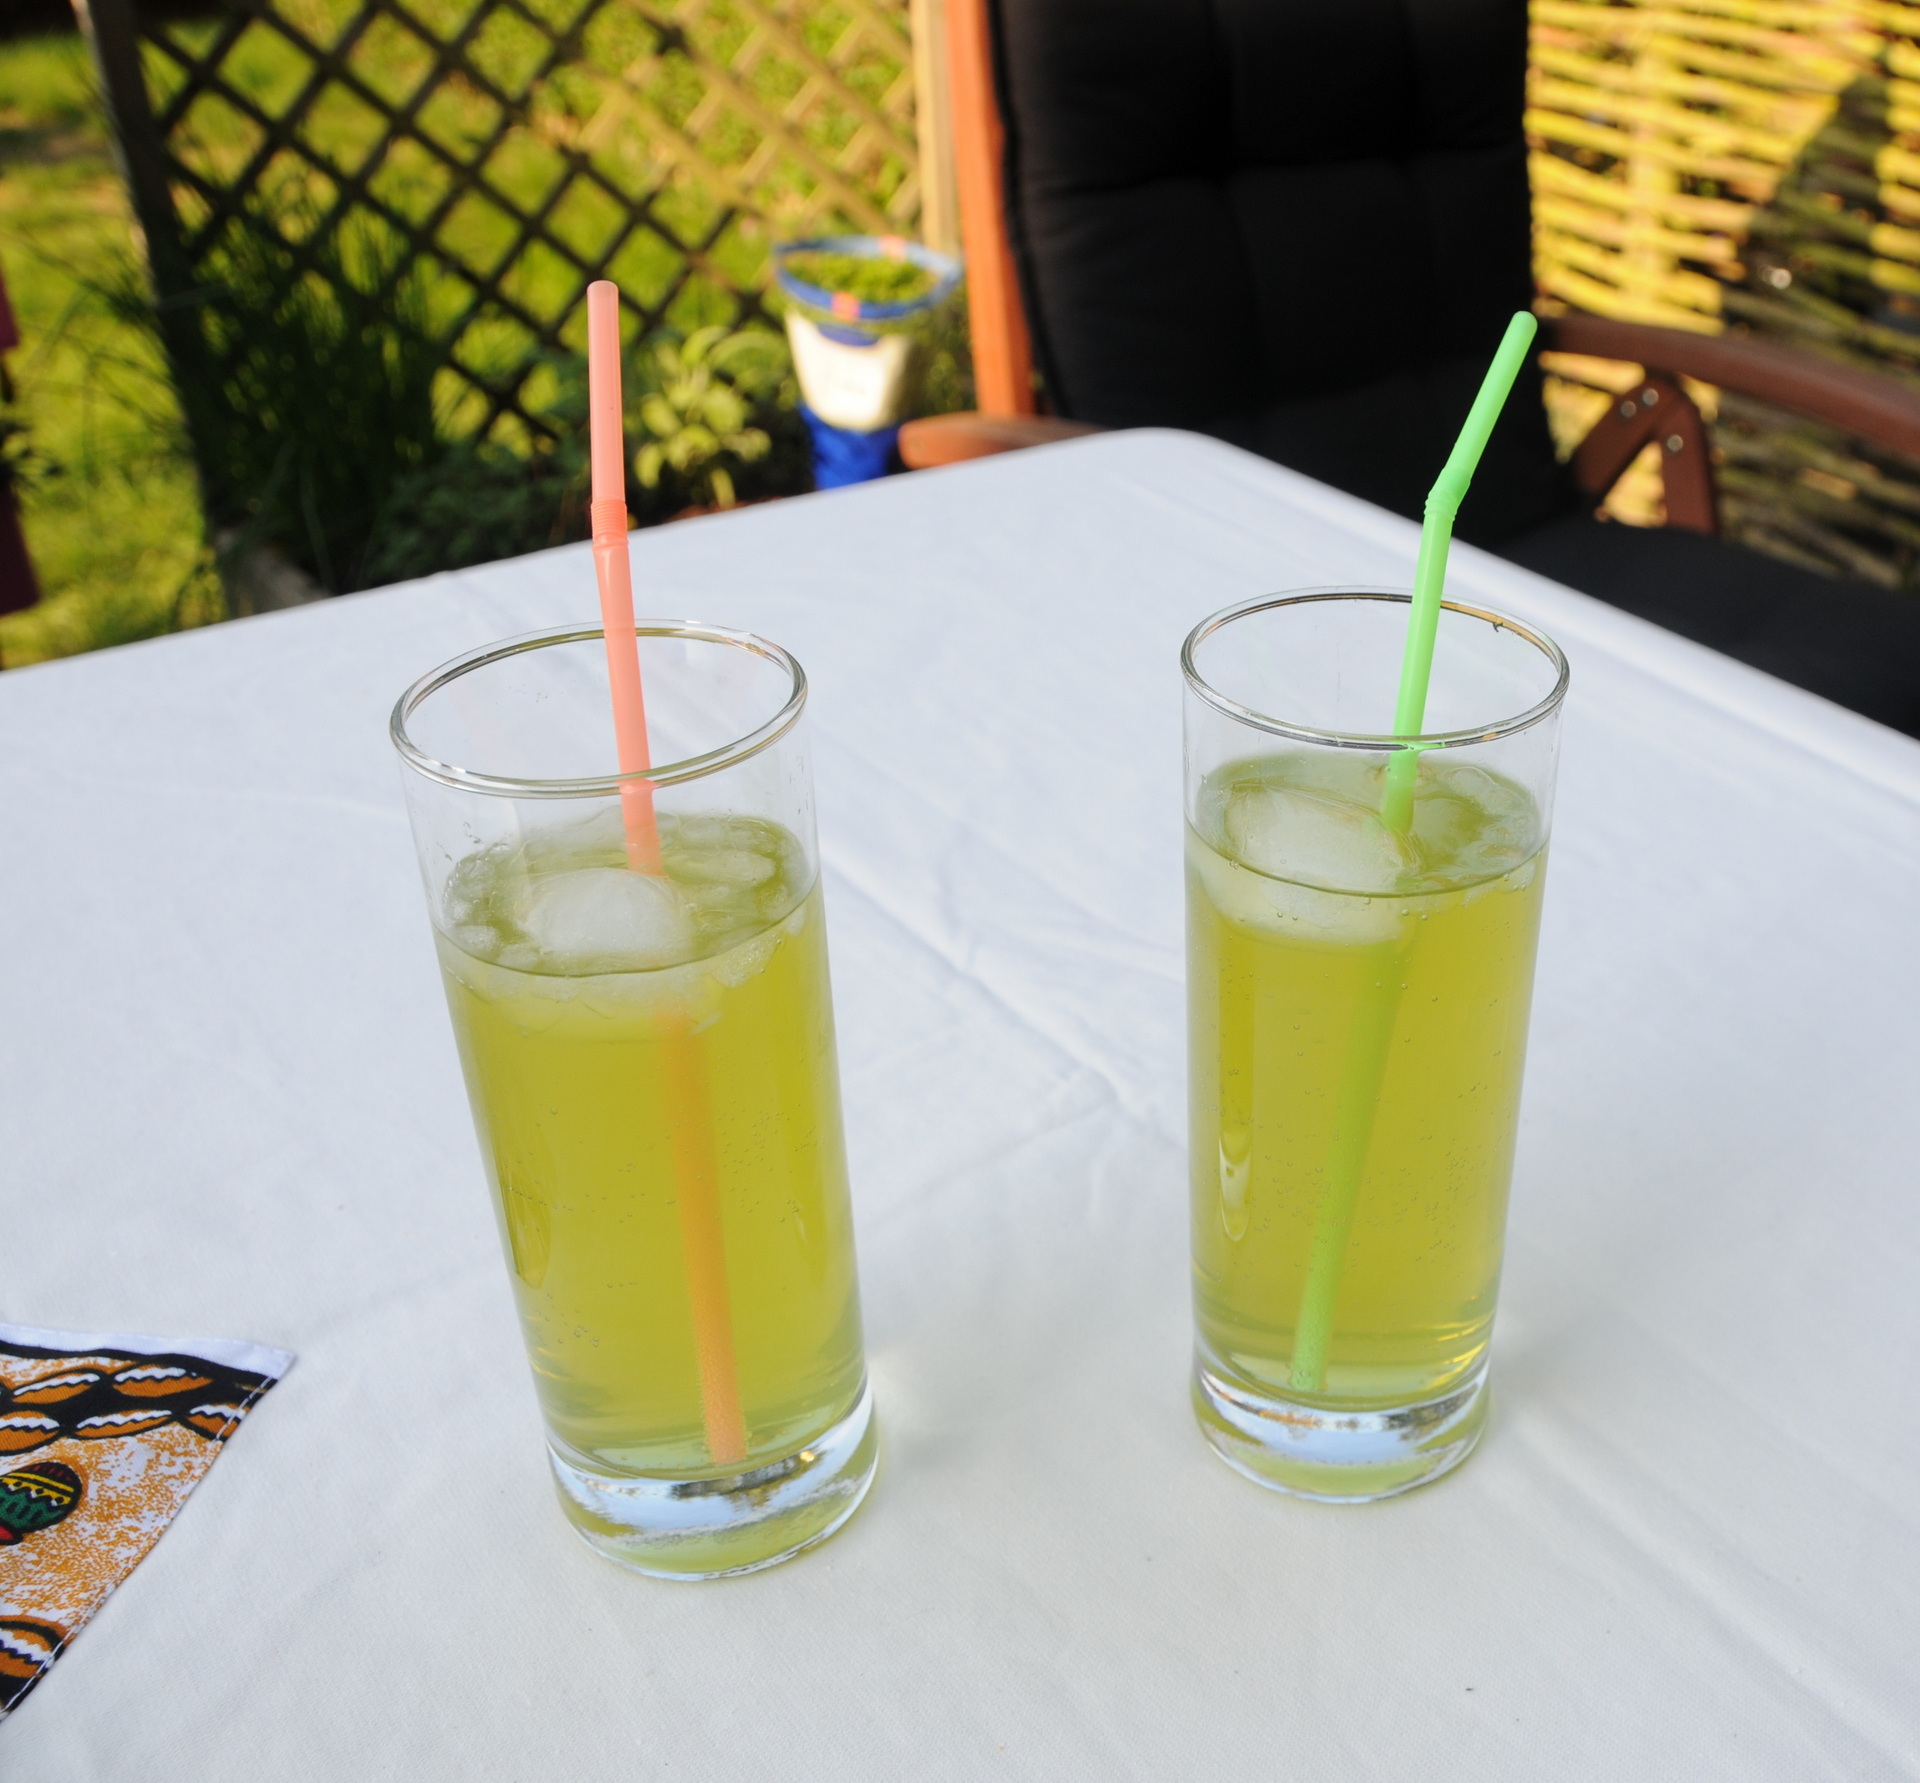
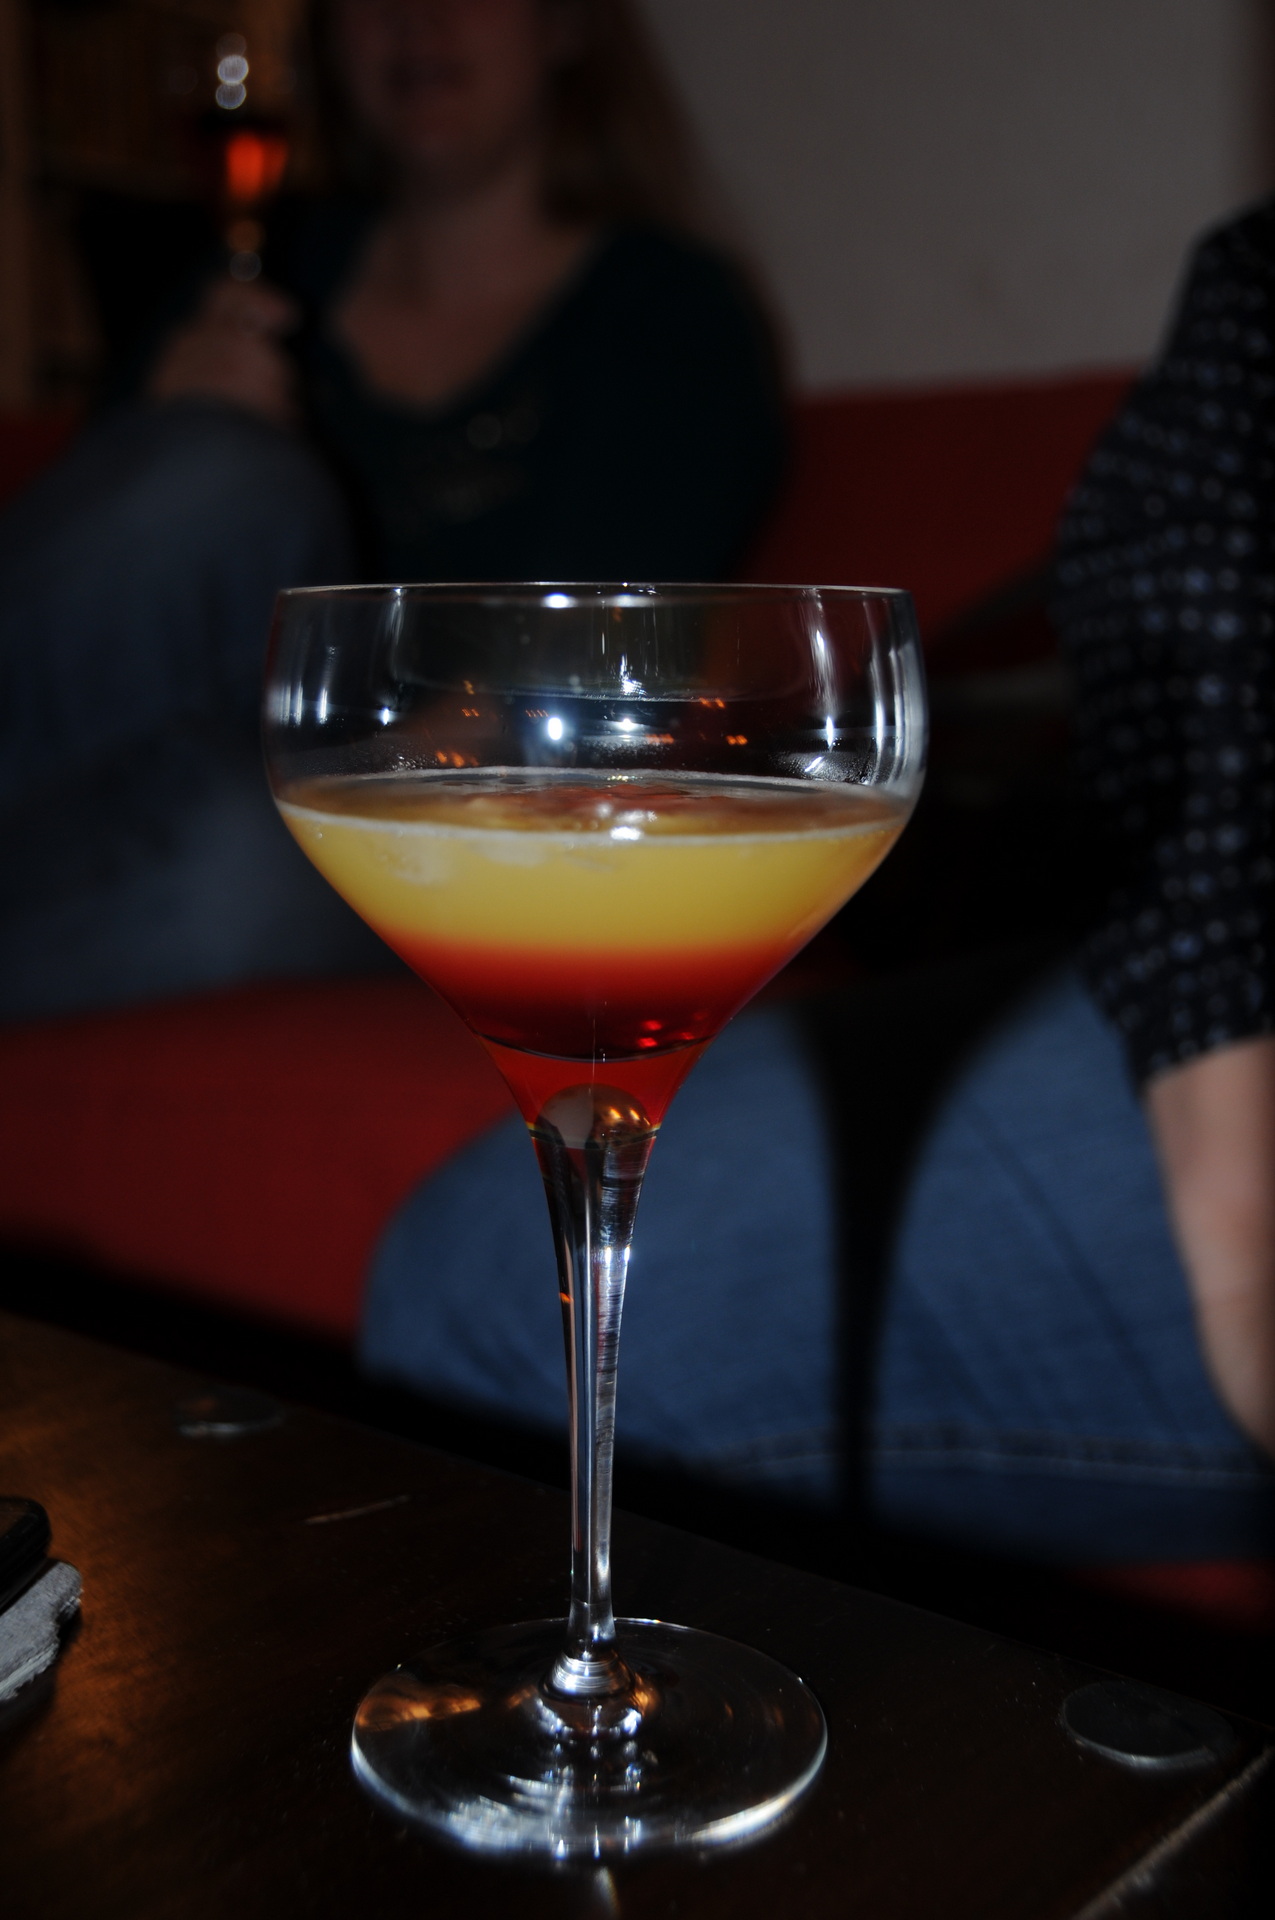
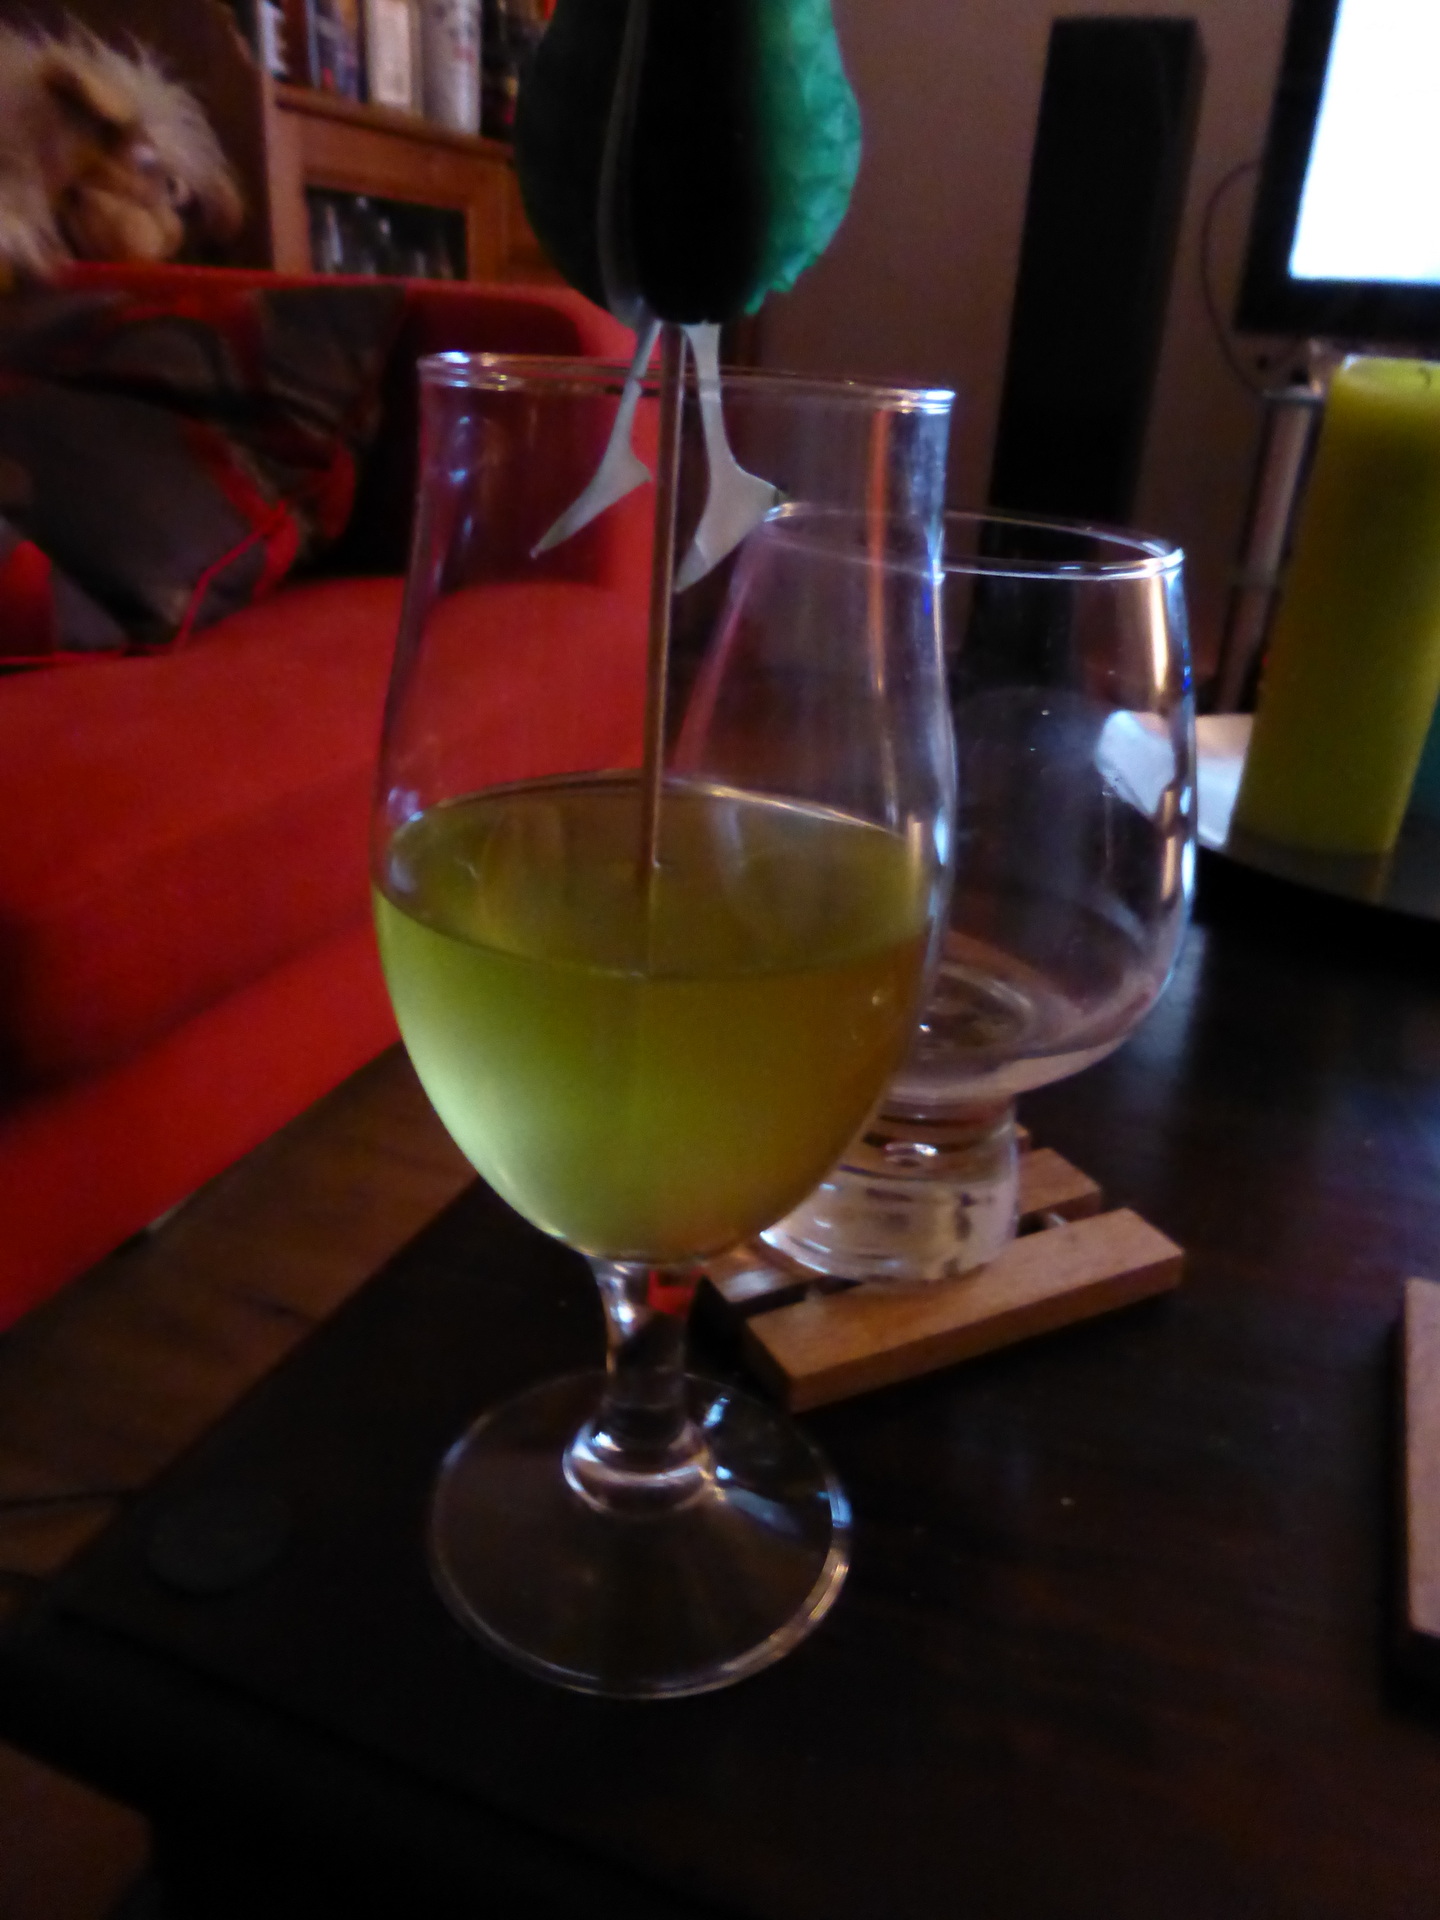
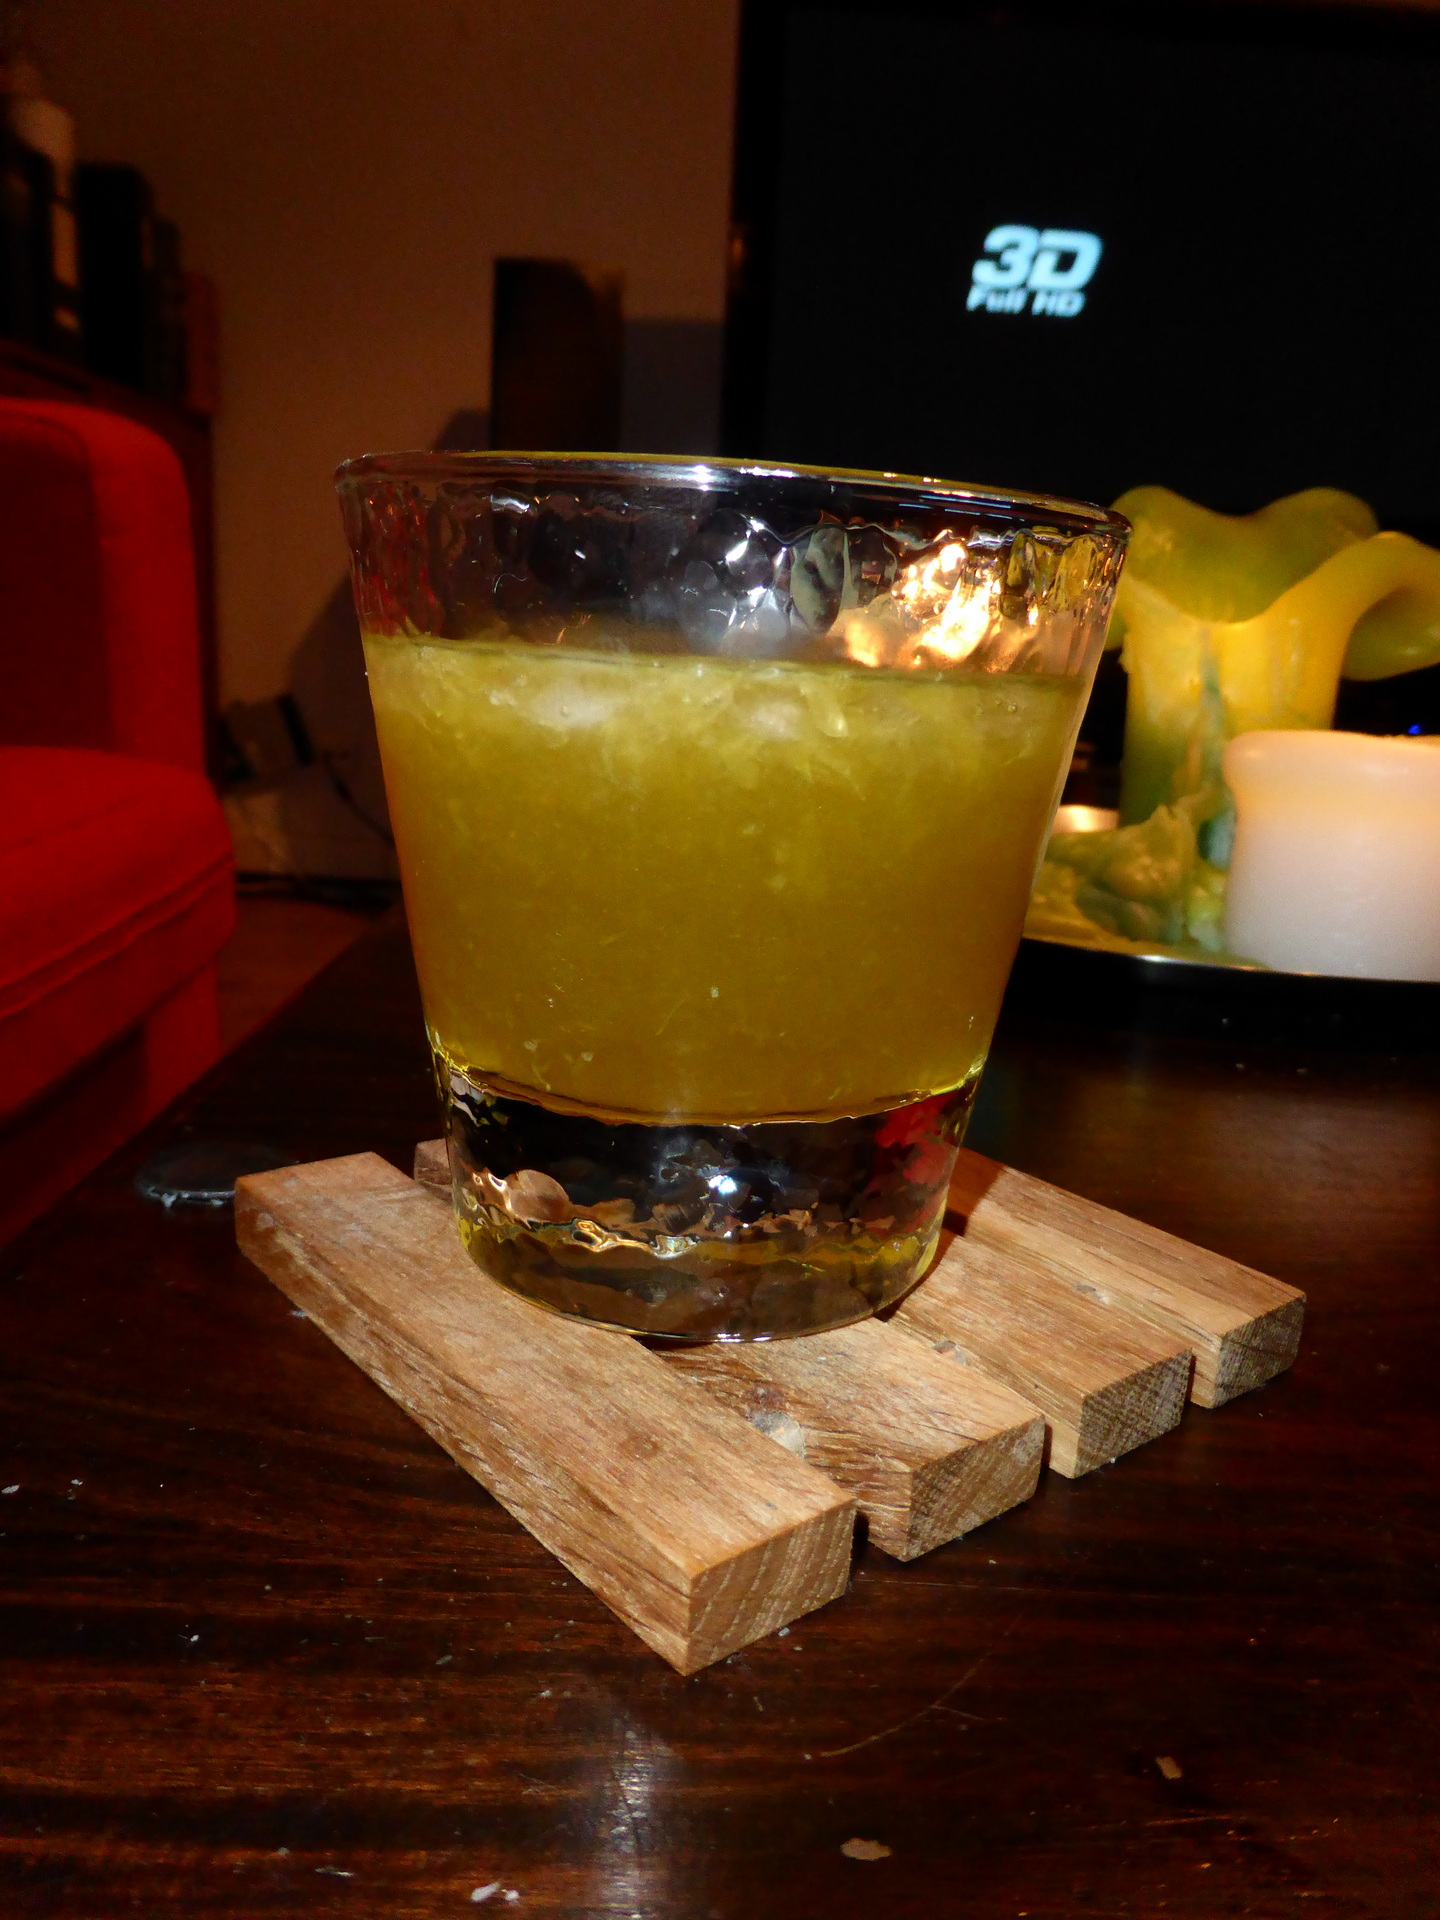
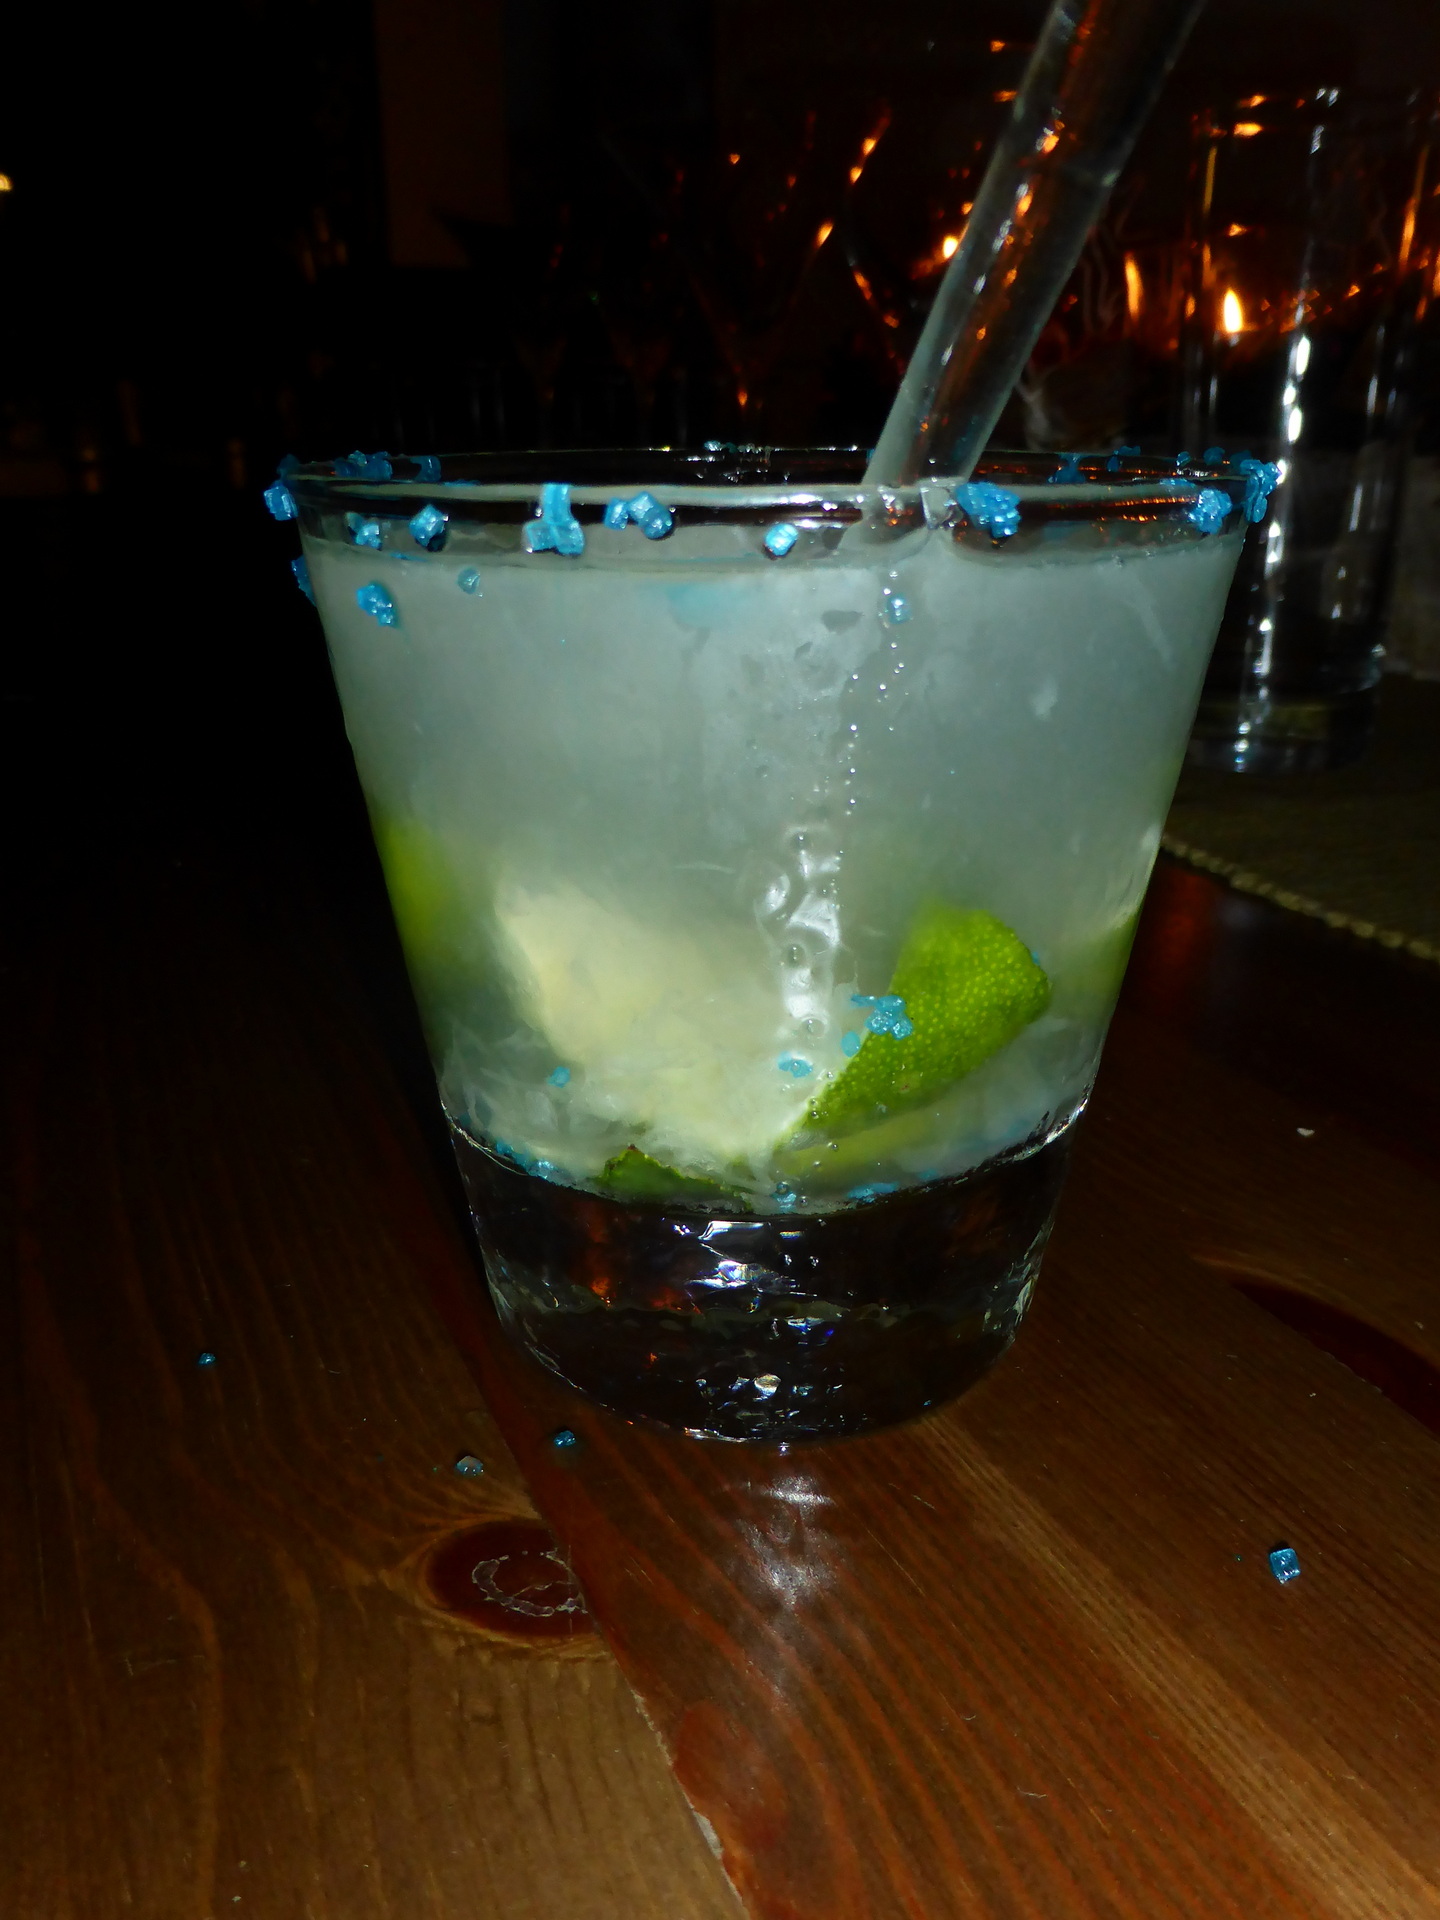
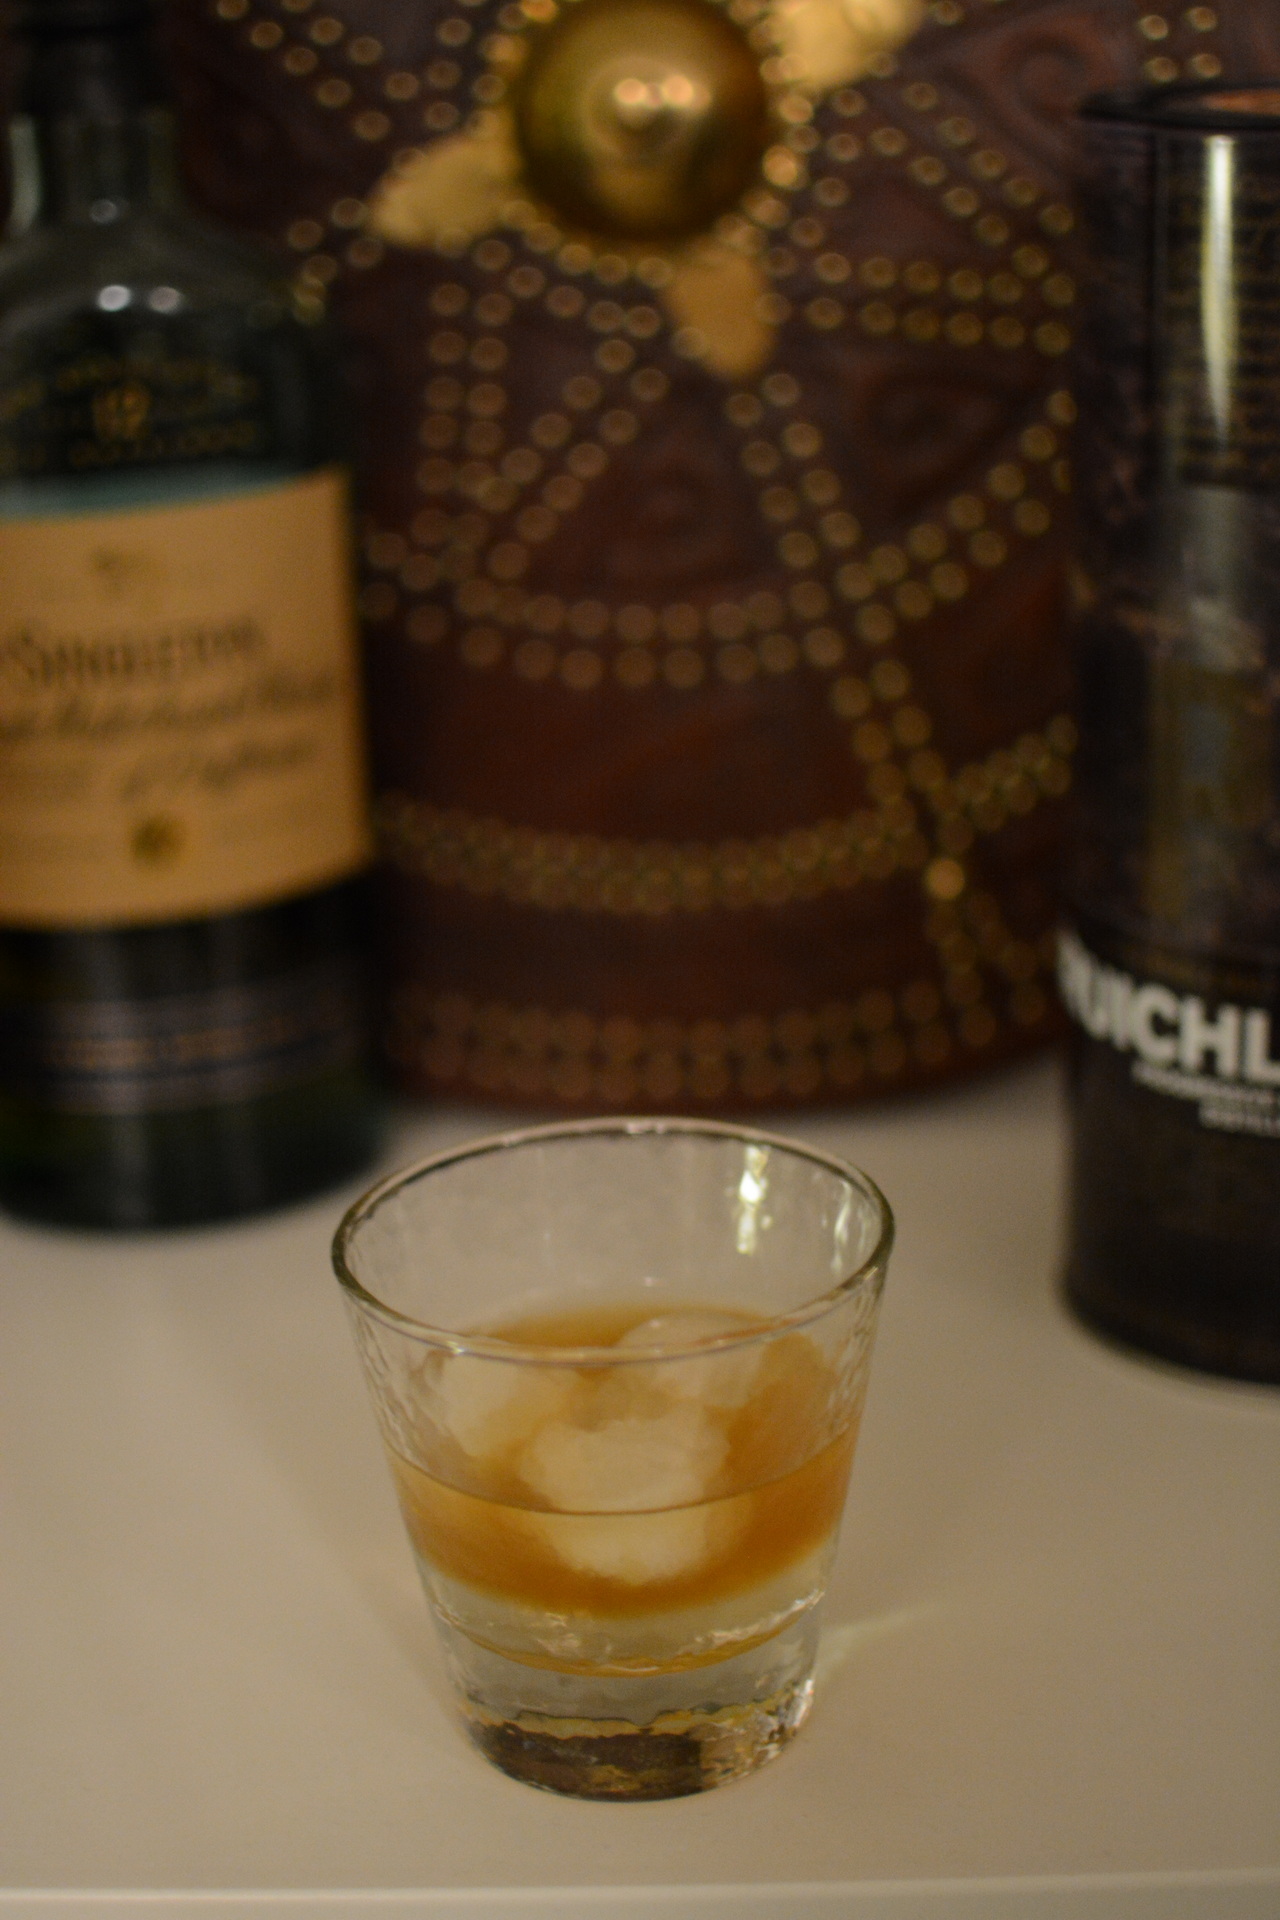
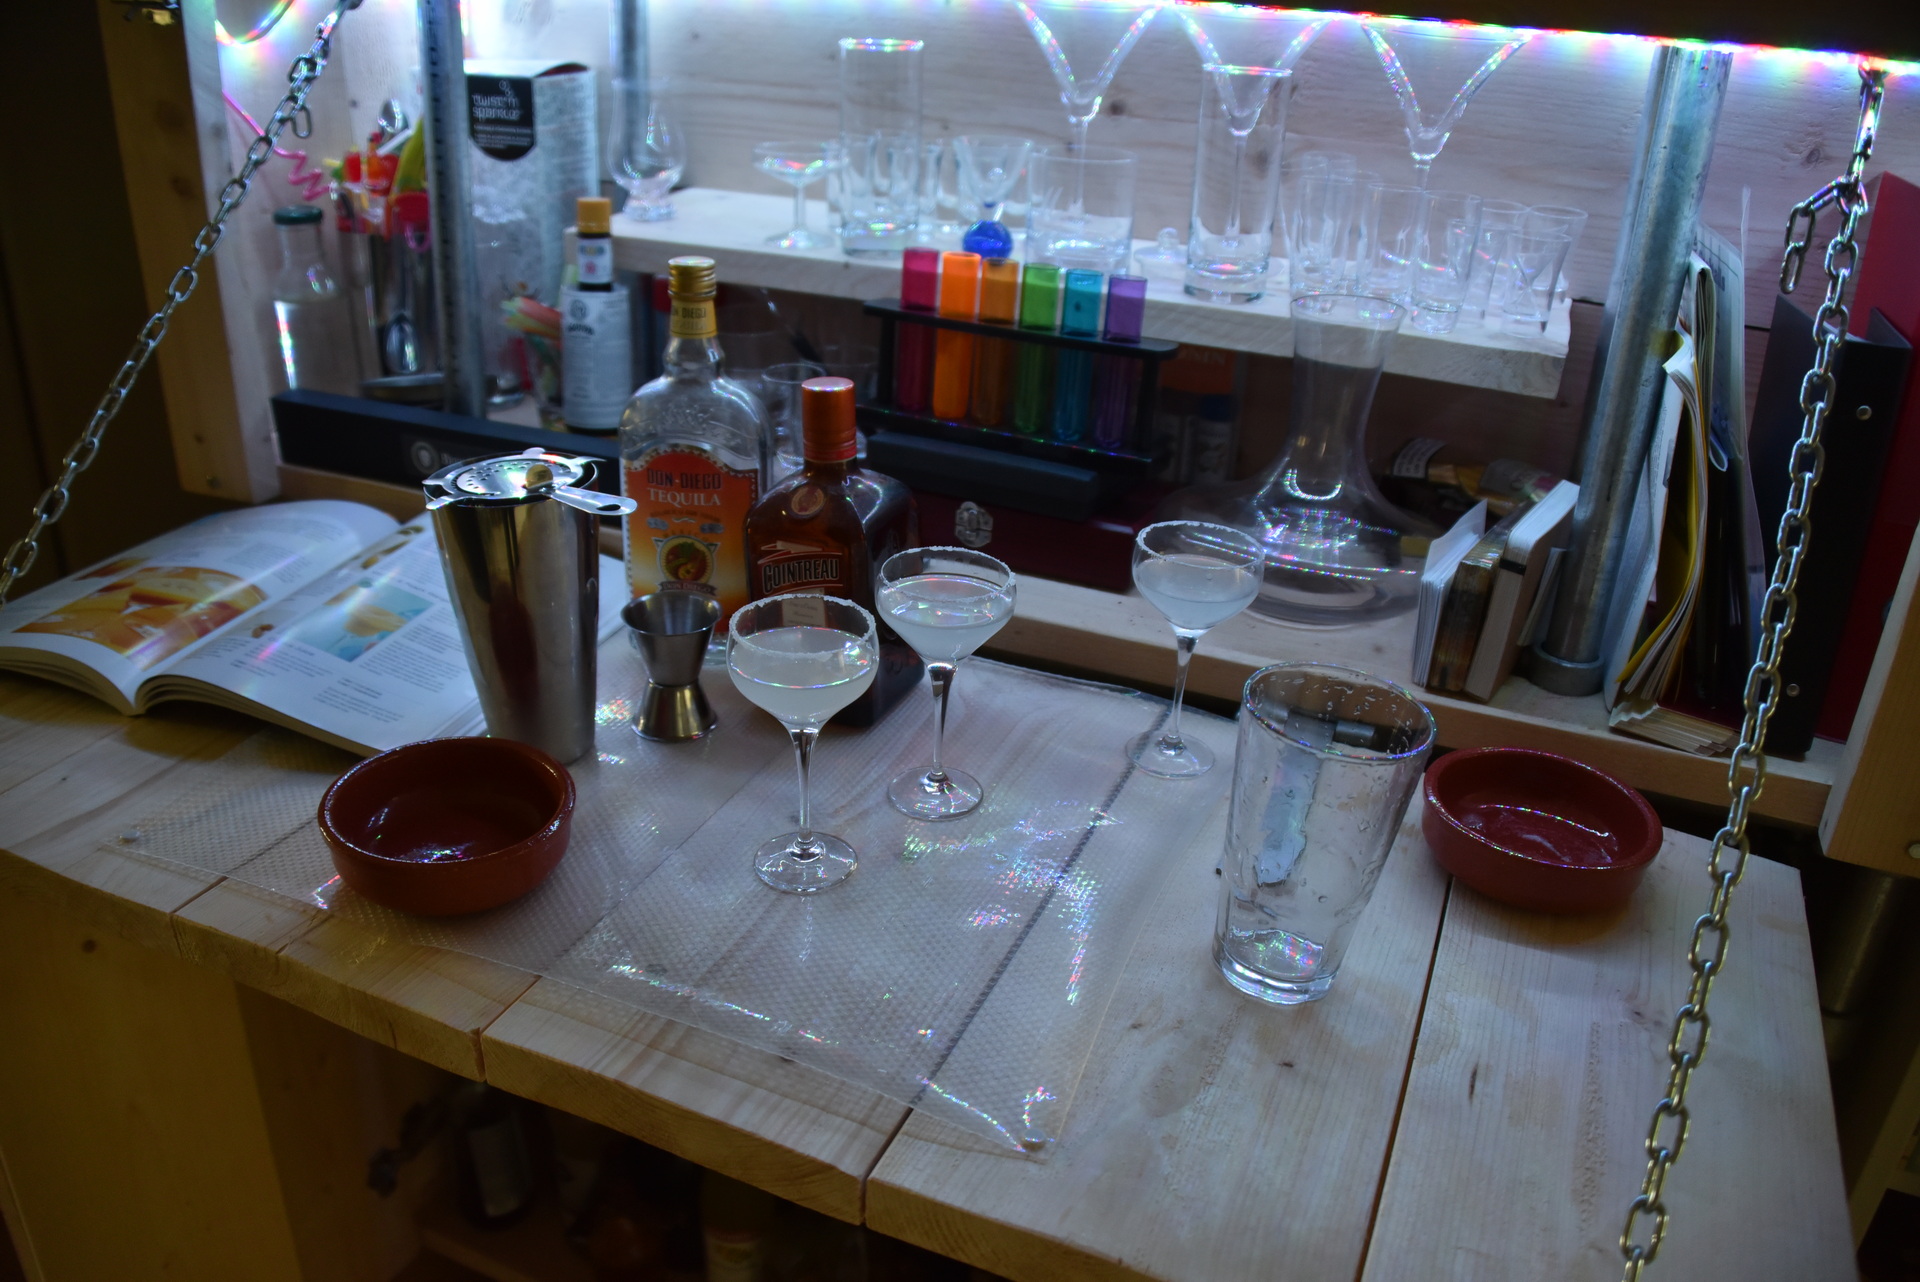
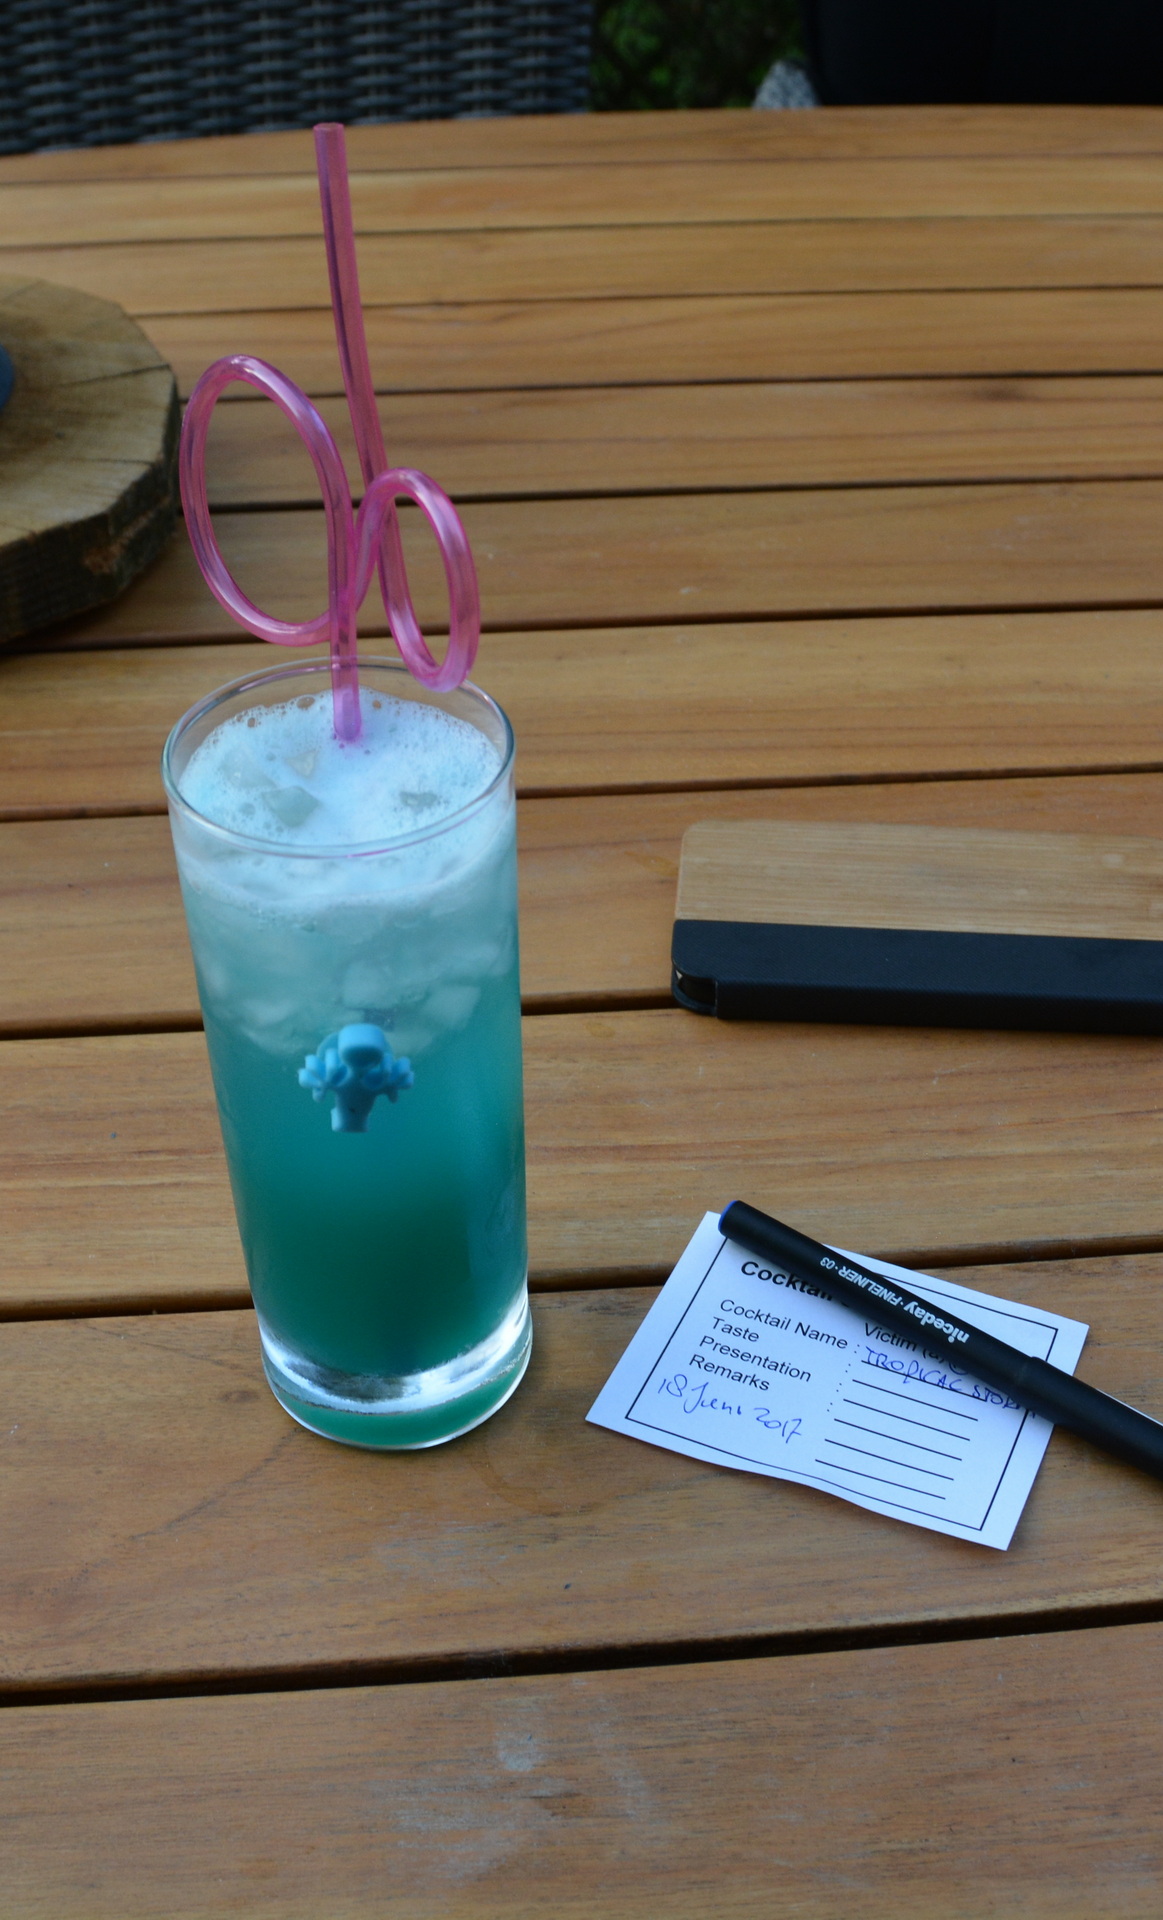
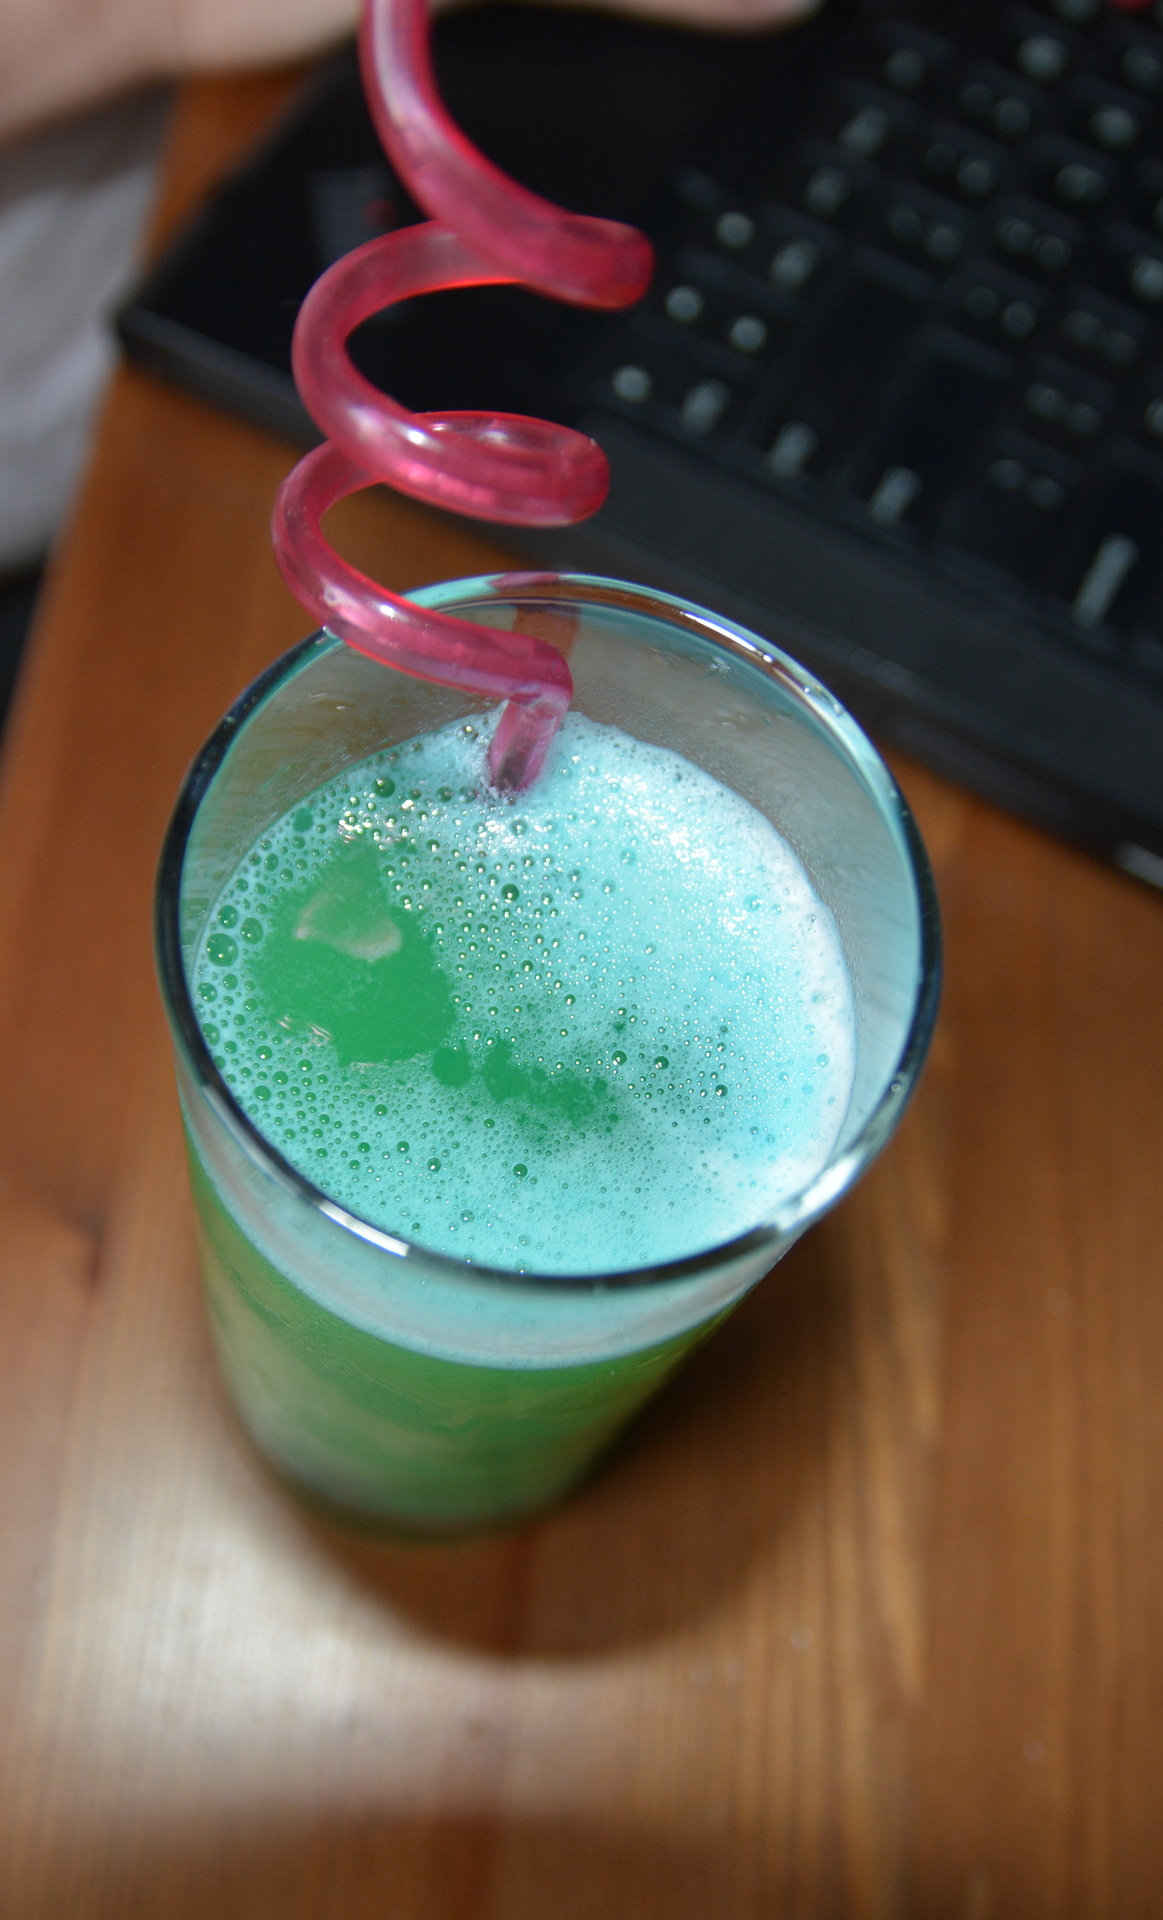
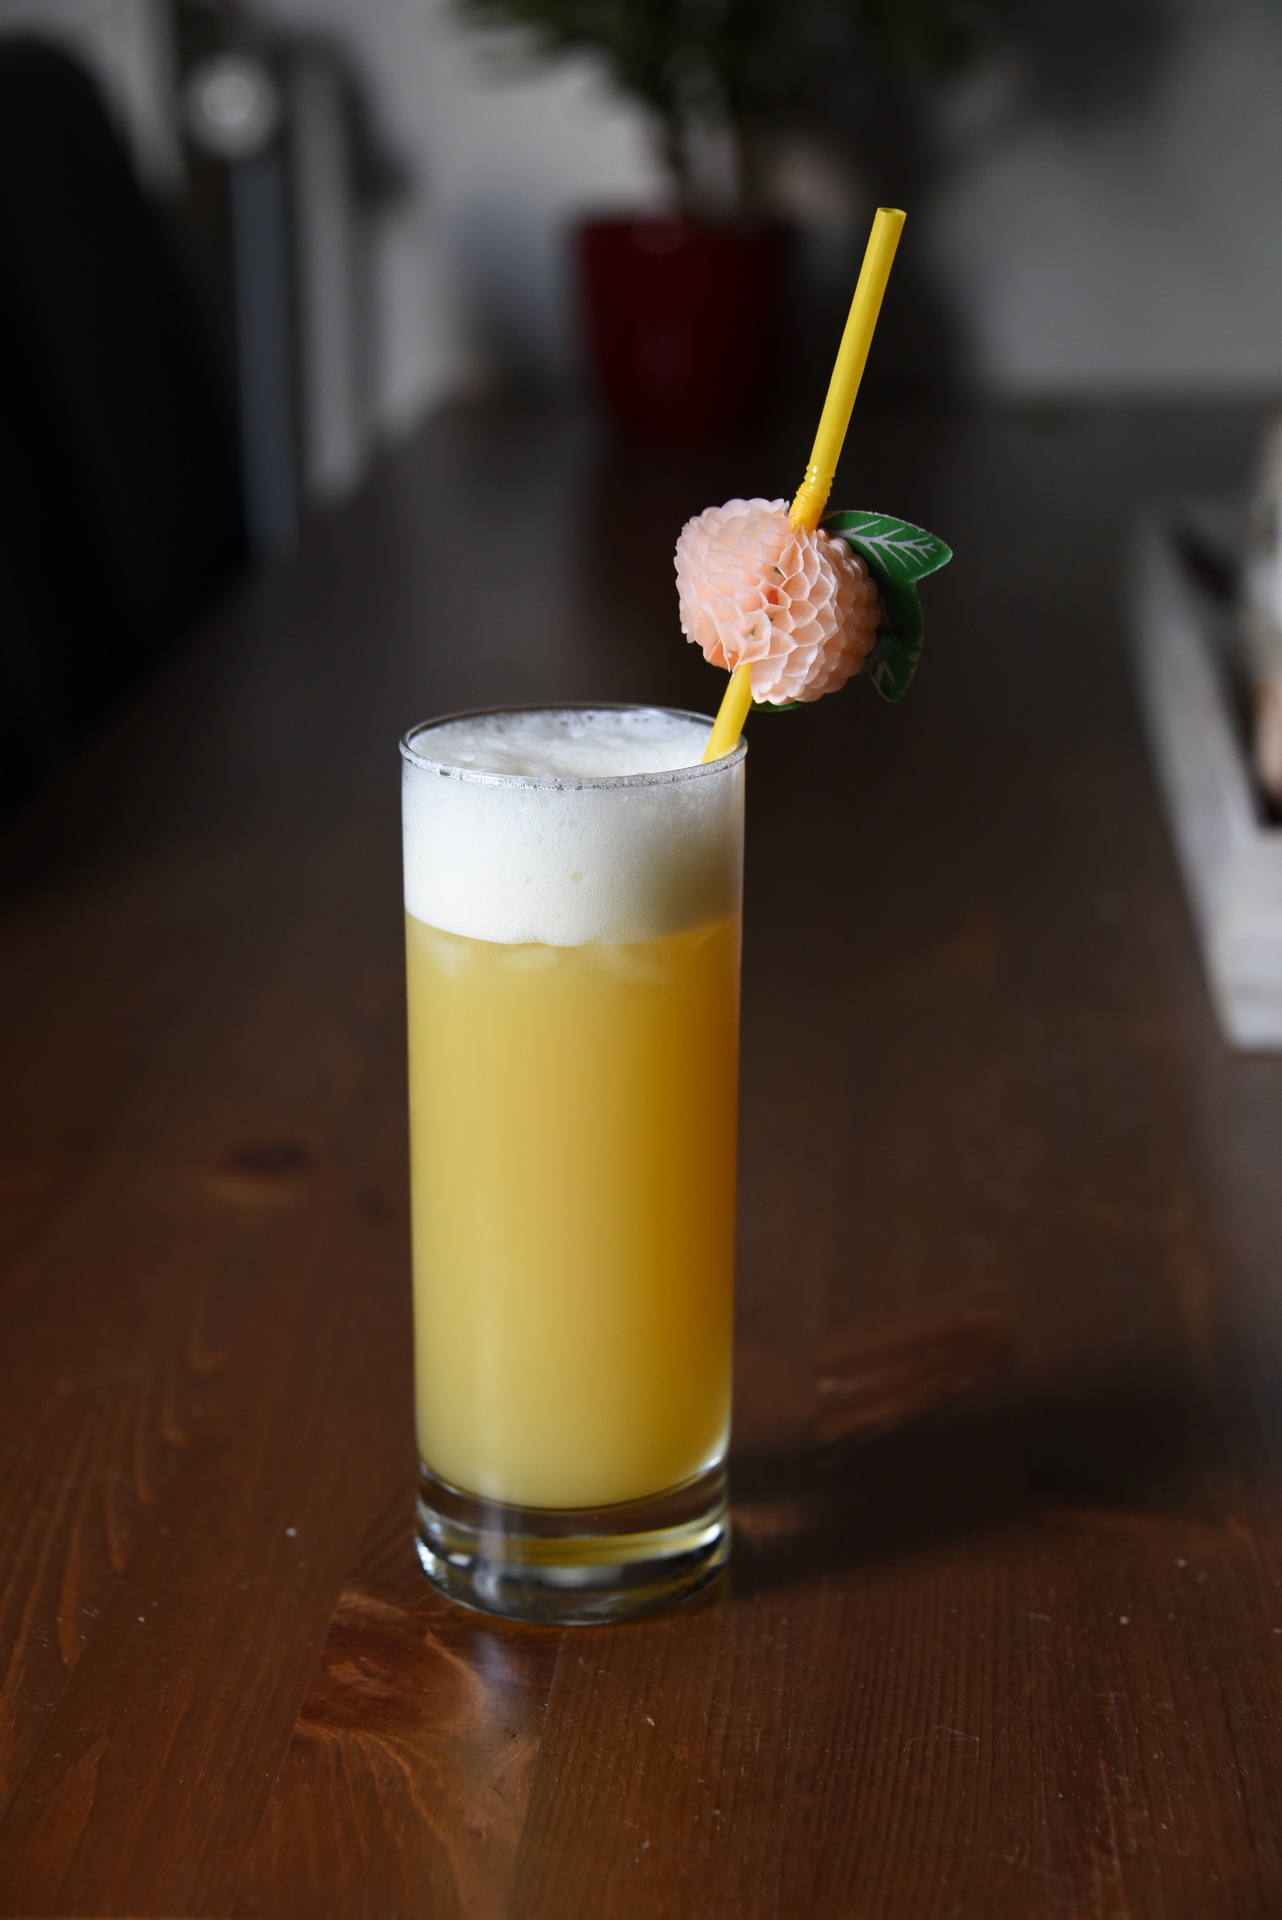
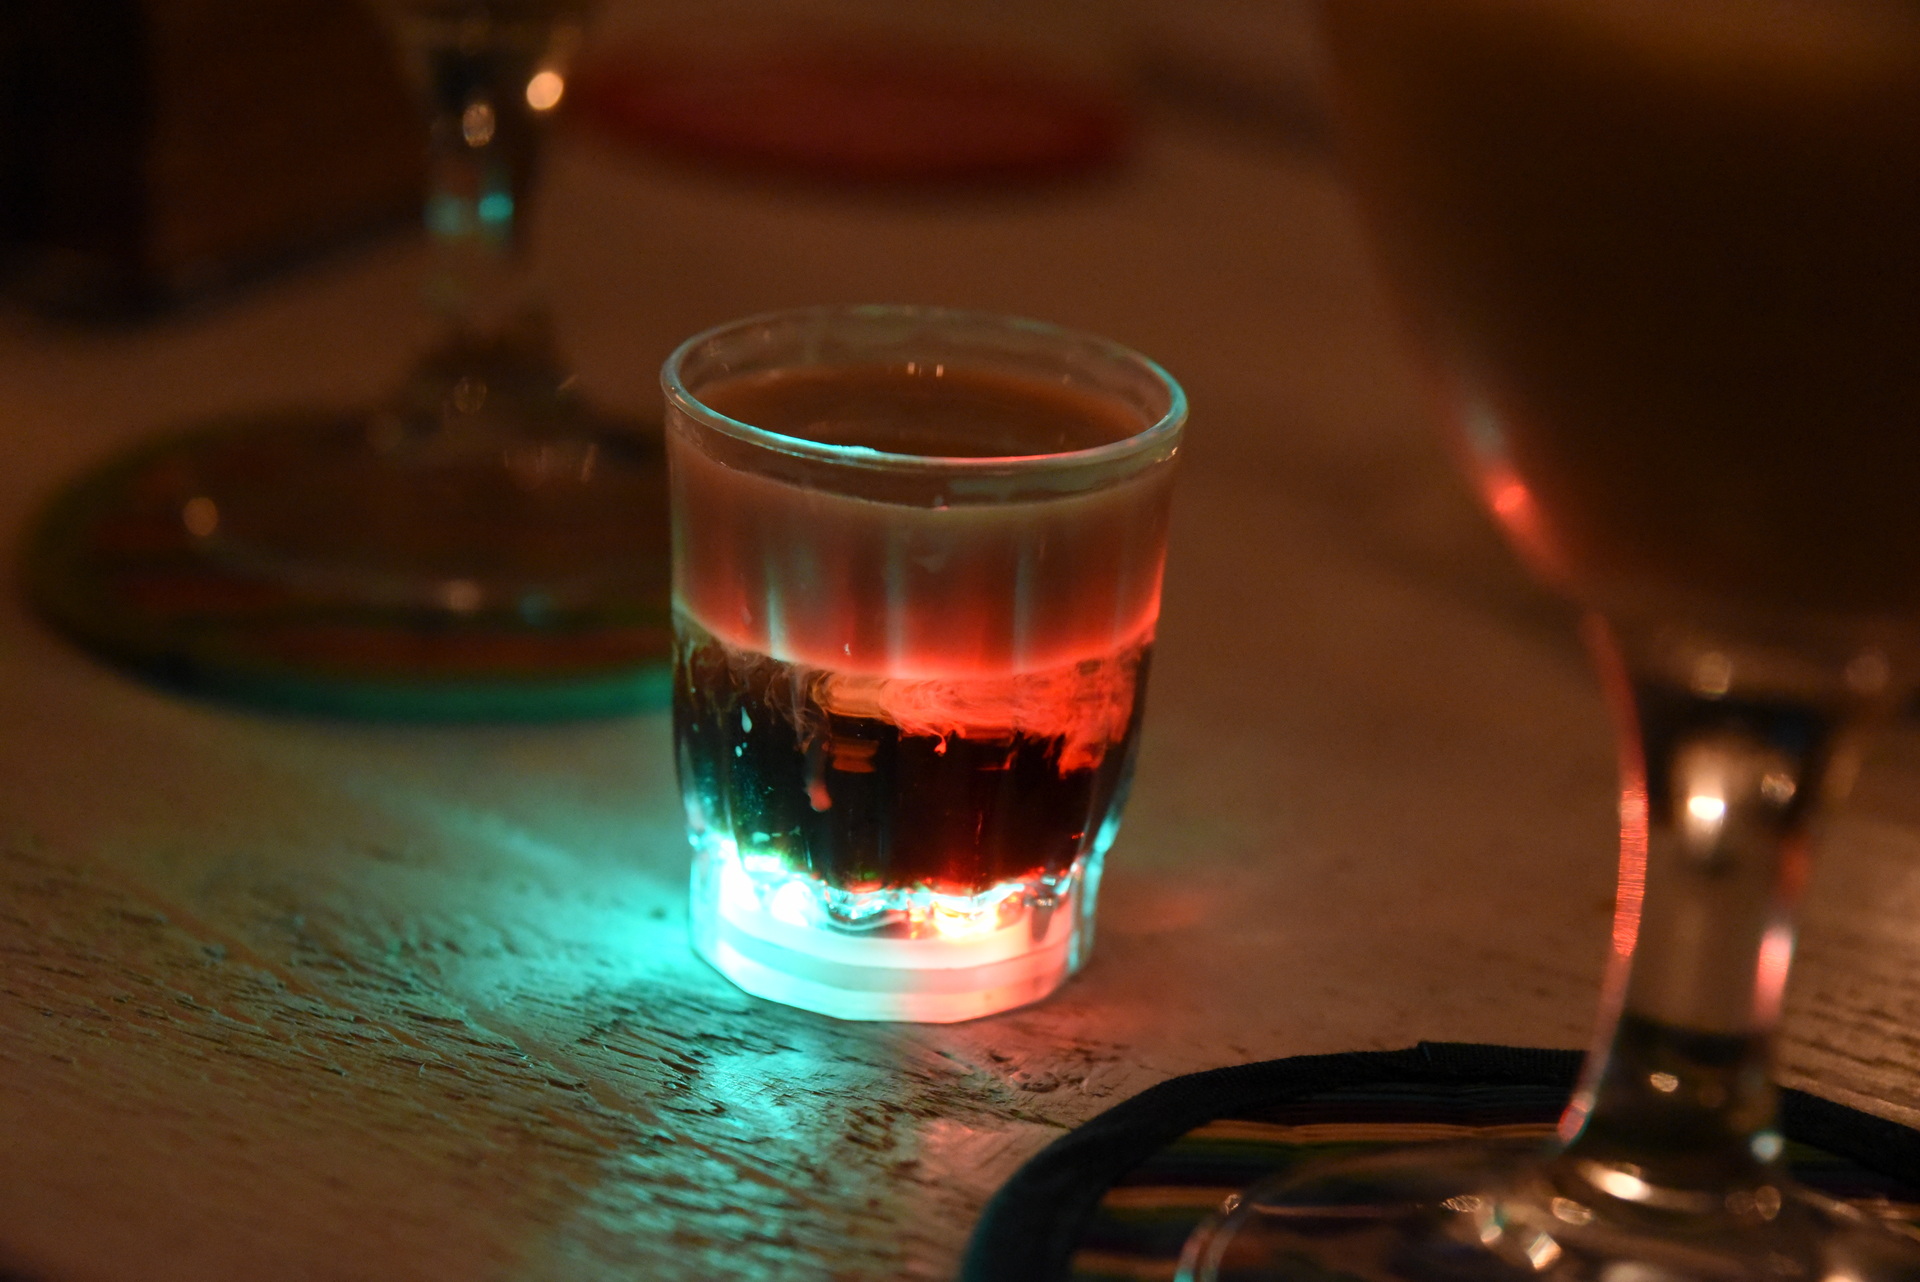
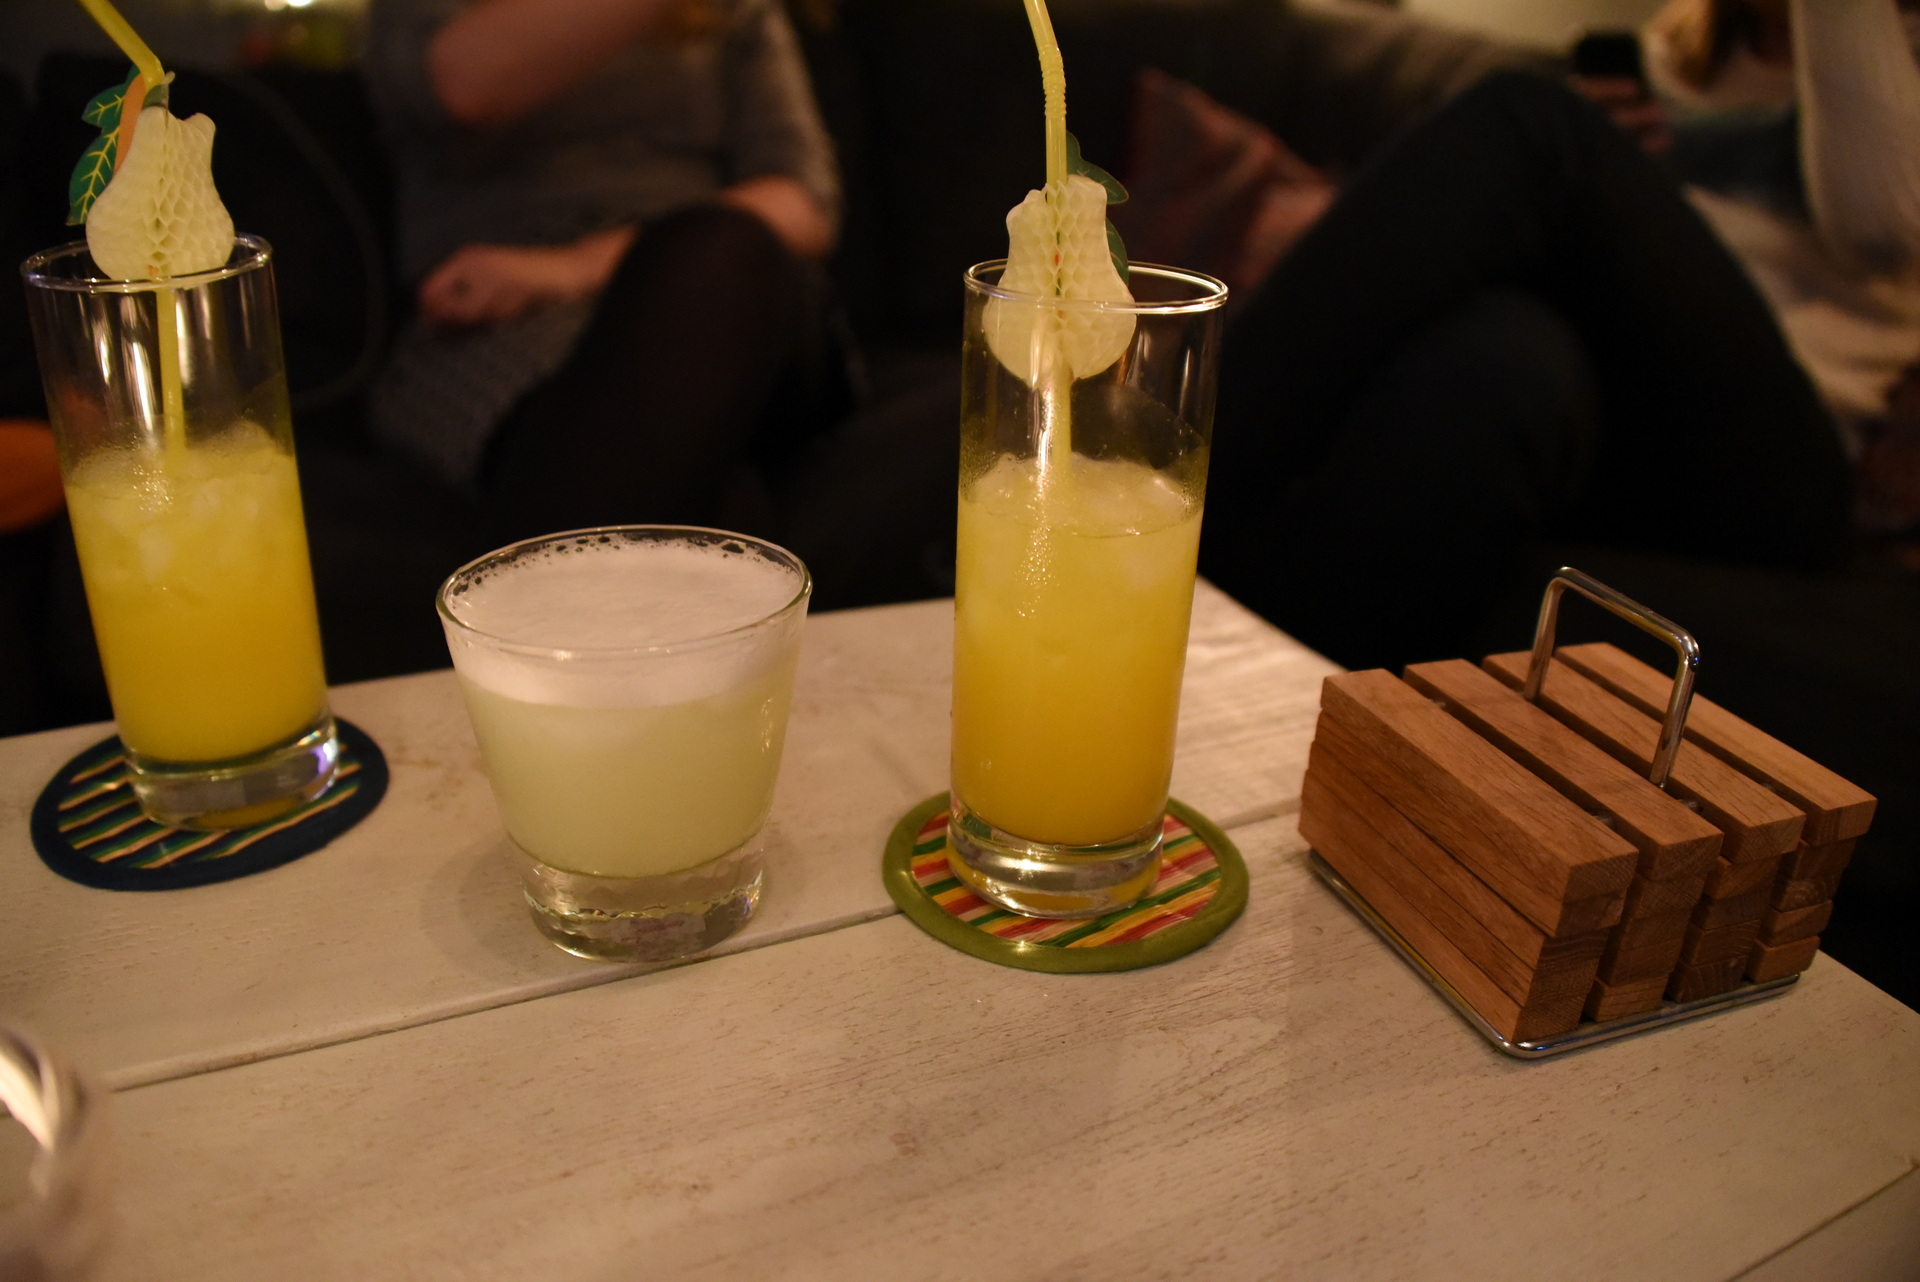
Some pictures of the drinks i’ve made, in the last years.
Most are in my notebook, i can perfect the drink now individually for a person.
I really have to put the names of the drinks on this page. (And the tasting notes!)
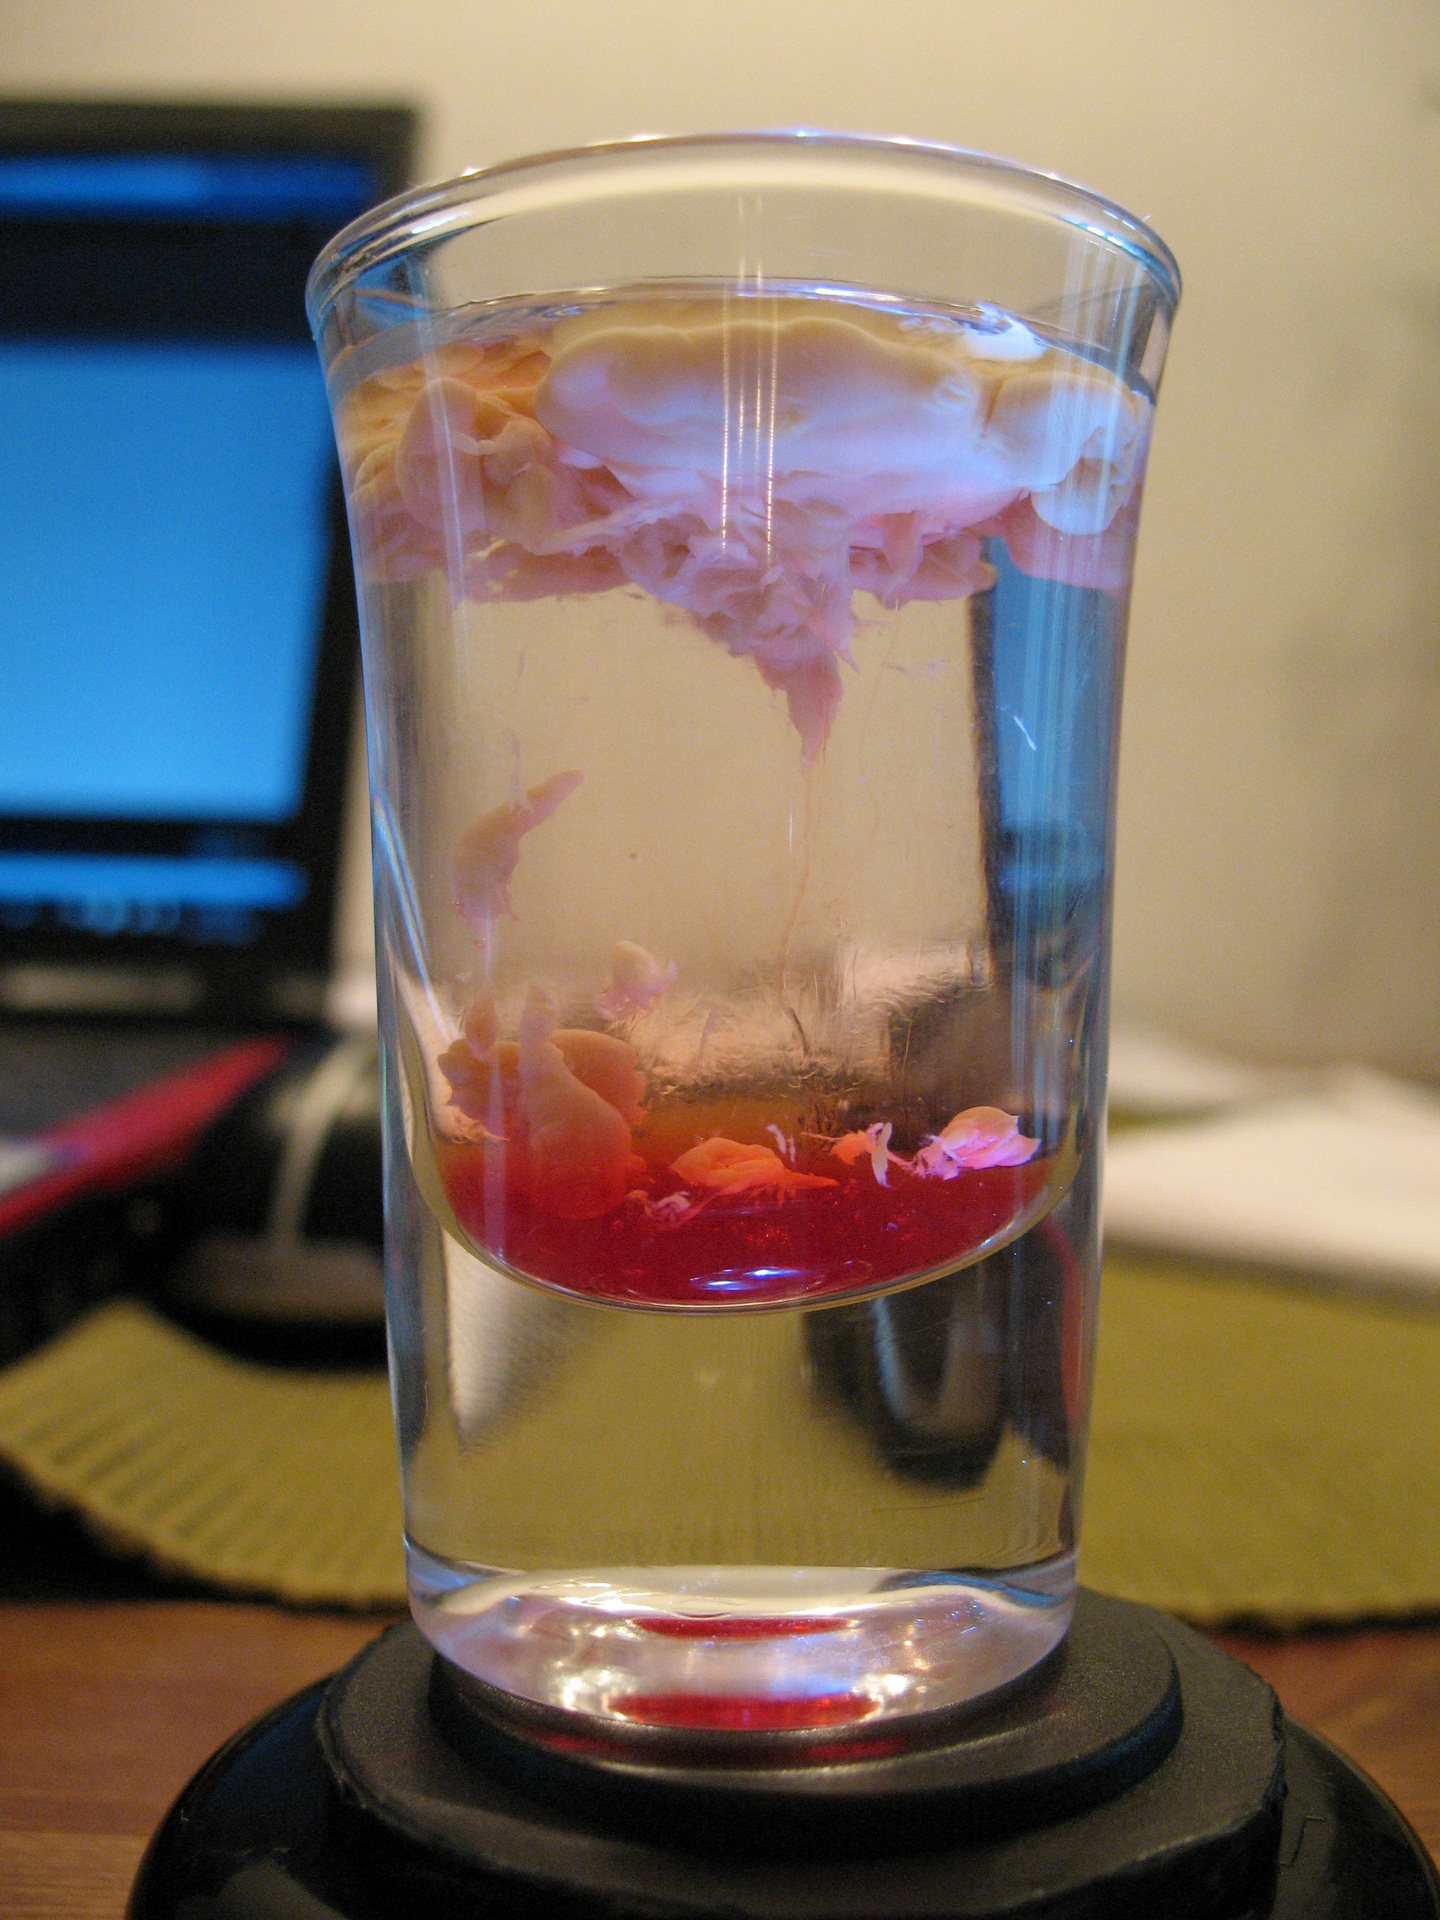
Nice effect with a lightUsing flower holders to present drinksMy little book of drinksOur favorite .. a Satan drink with doritosQueens day .. could not get the red on top due to the gravity of the drinksPart of my new barLights!
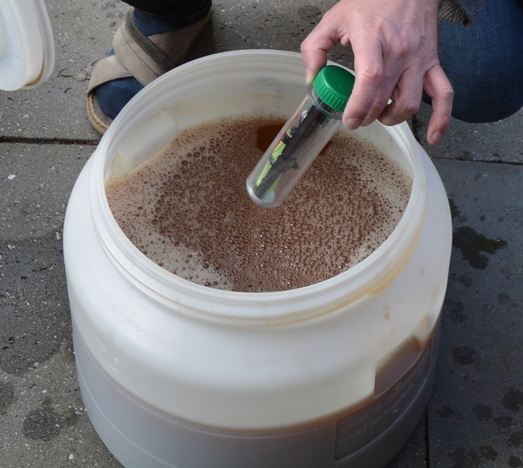
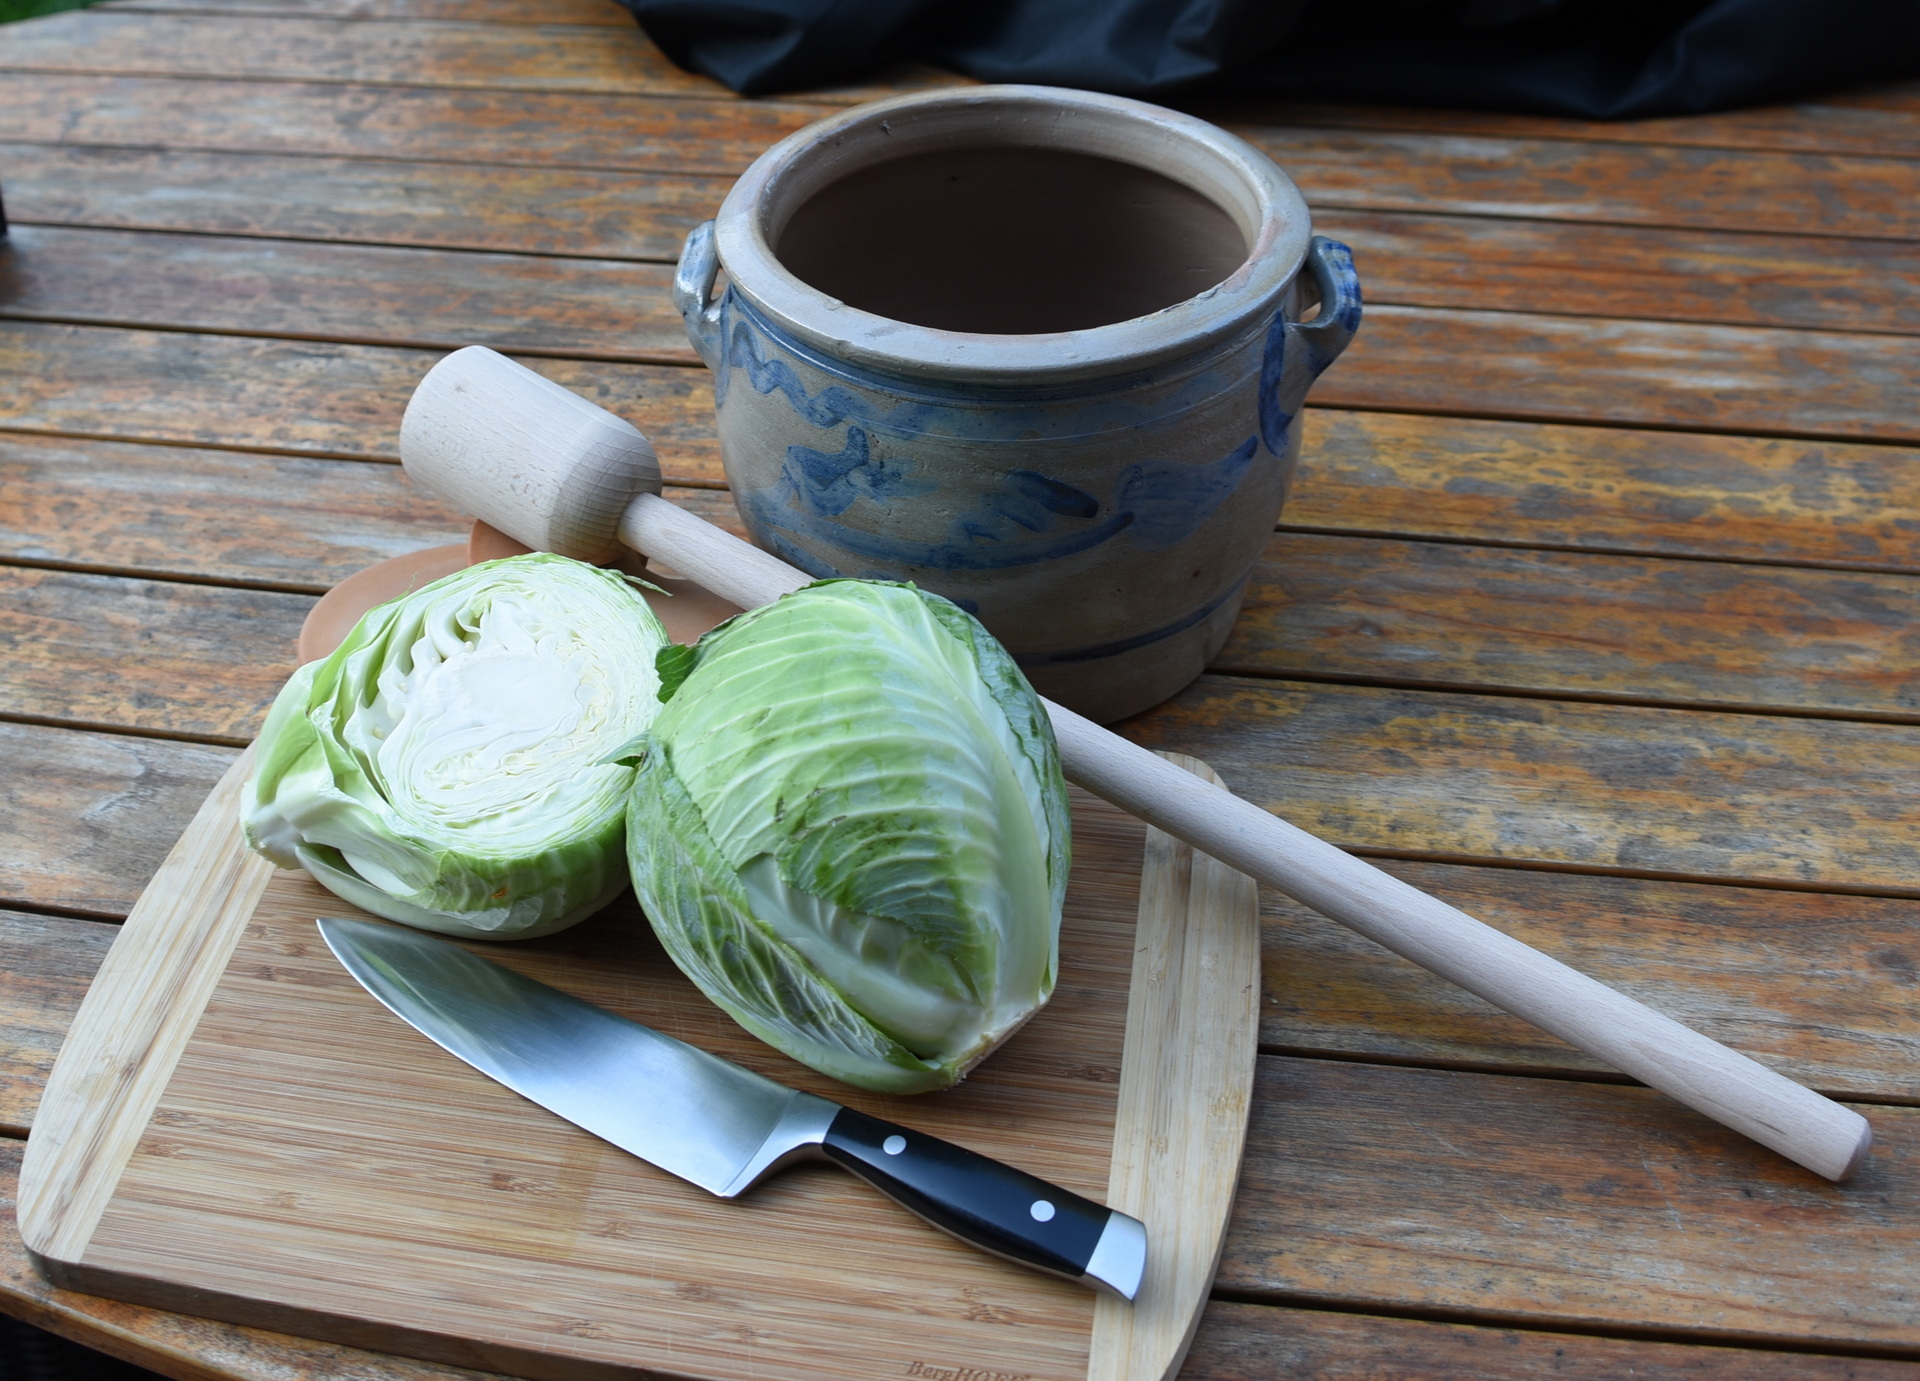
We love fermenting! Sometimes we ferment our own sauerkraut.
Depending on the volume it can take at least 2 weeks up to several months.
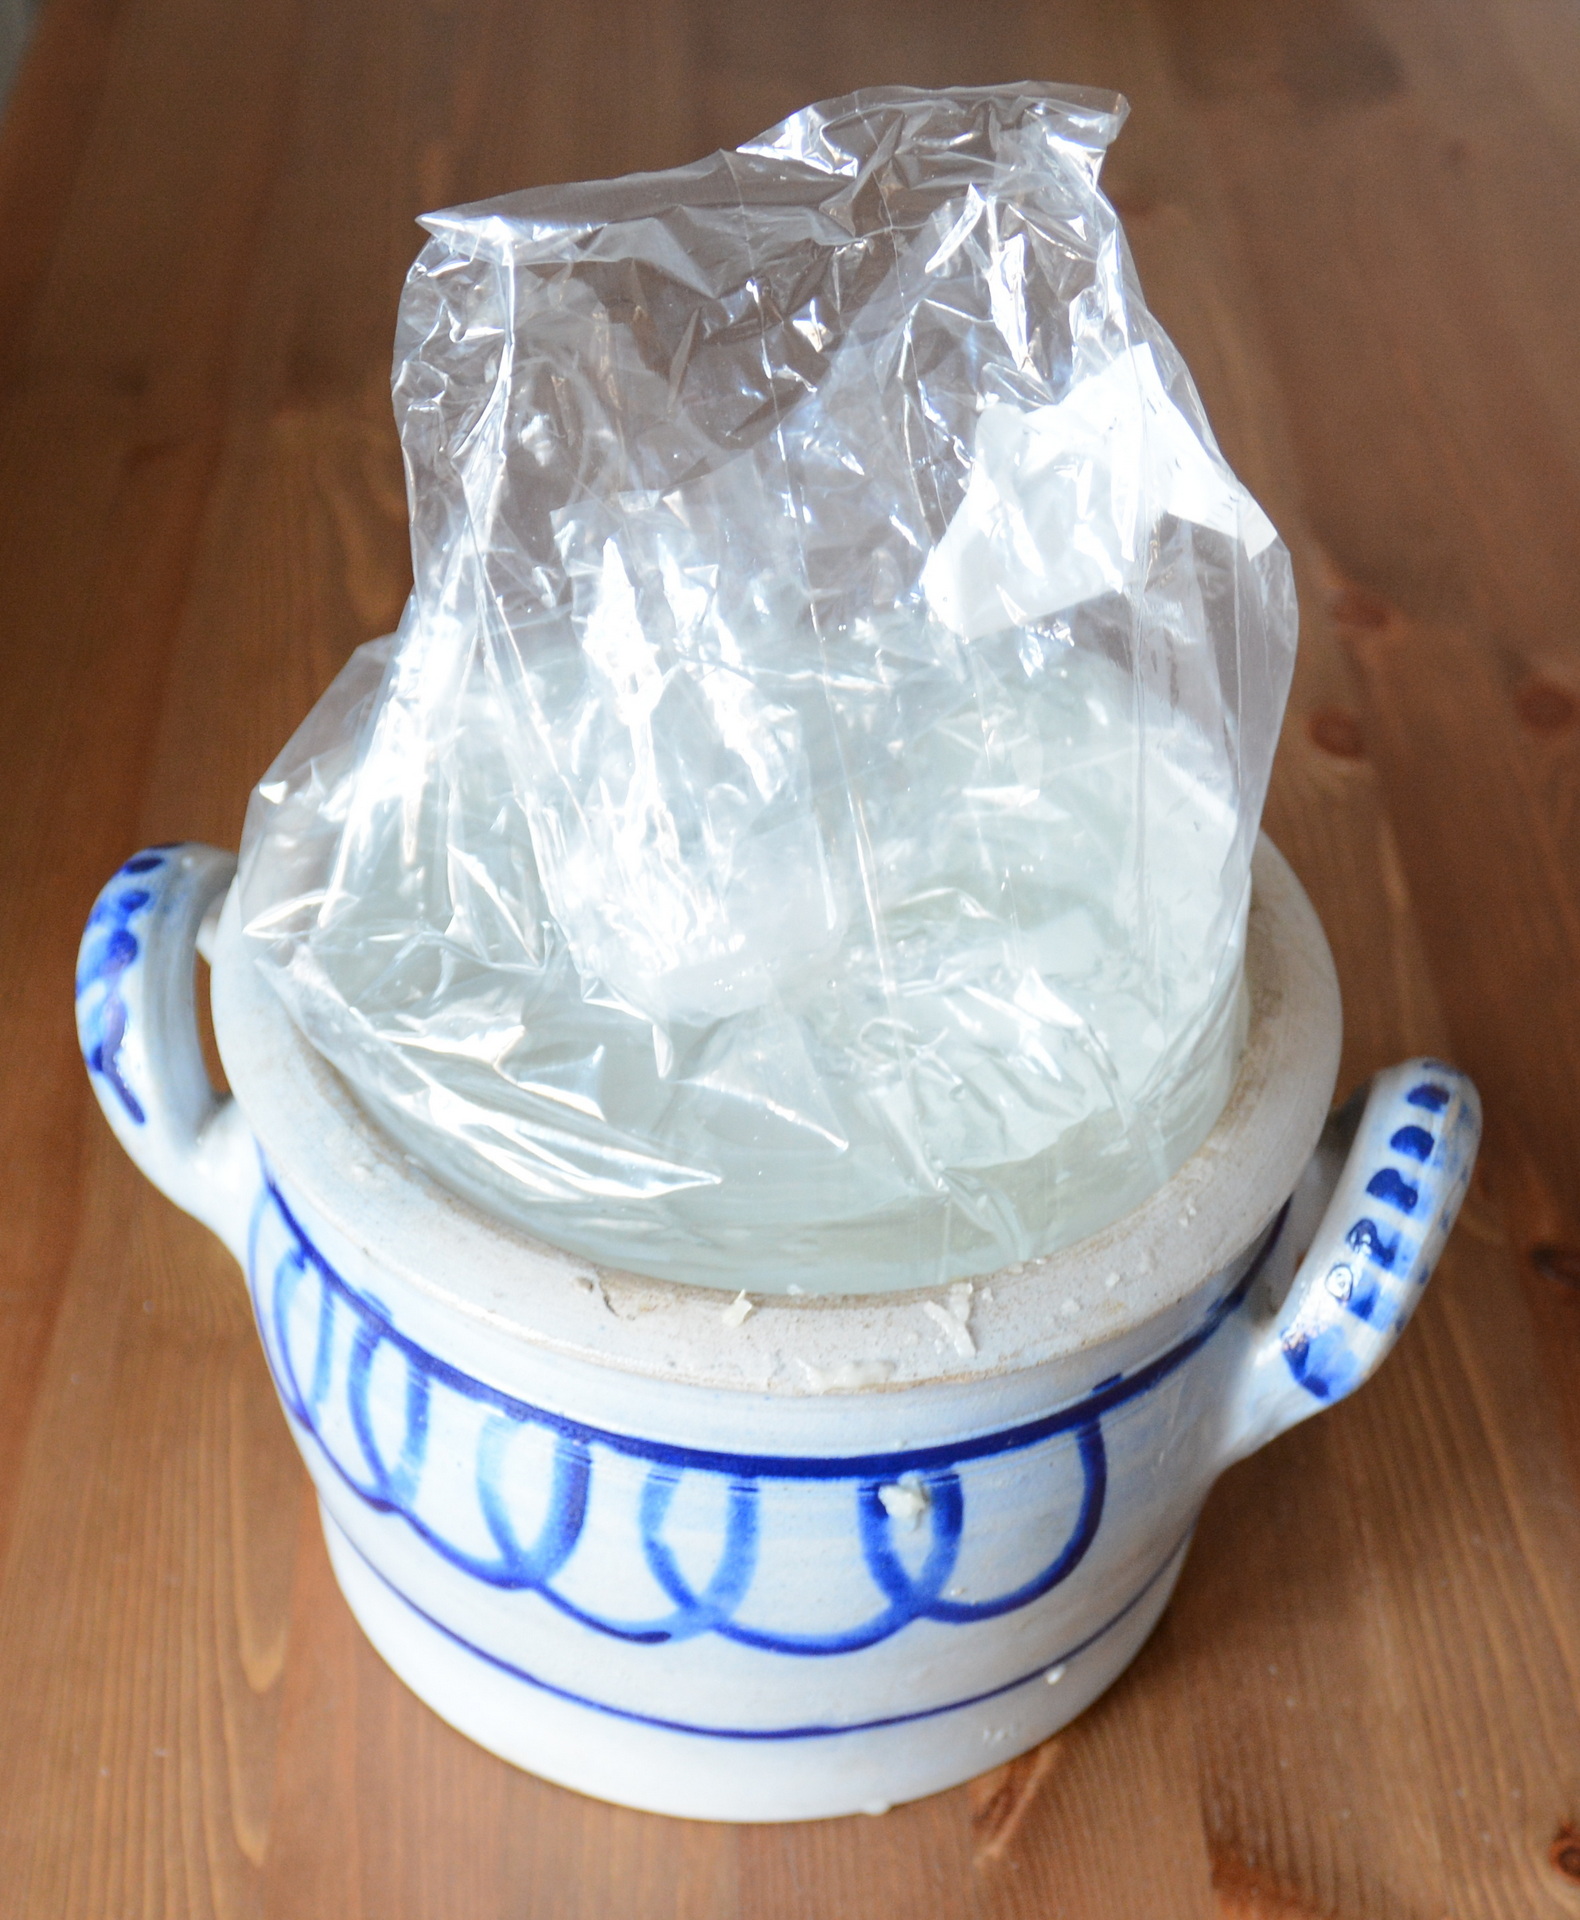
Bottom left – Stone Crock pot weights
If you don’t have crock pot weights, use a plastic bag filled with water. (See below)
Mixture: Salt, juniper berries, dill, celery seeds and caraway.
Rinse Cabbage and clean. Cut out and discard the hard white center.
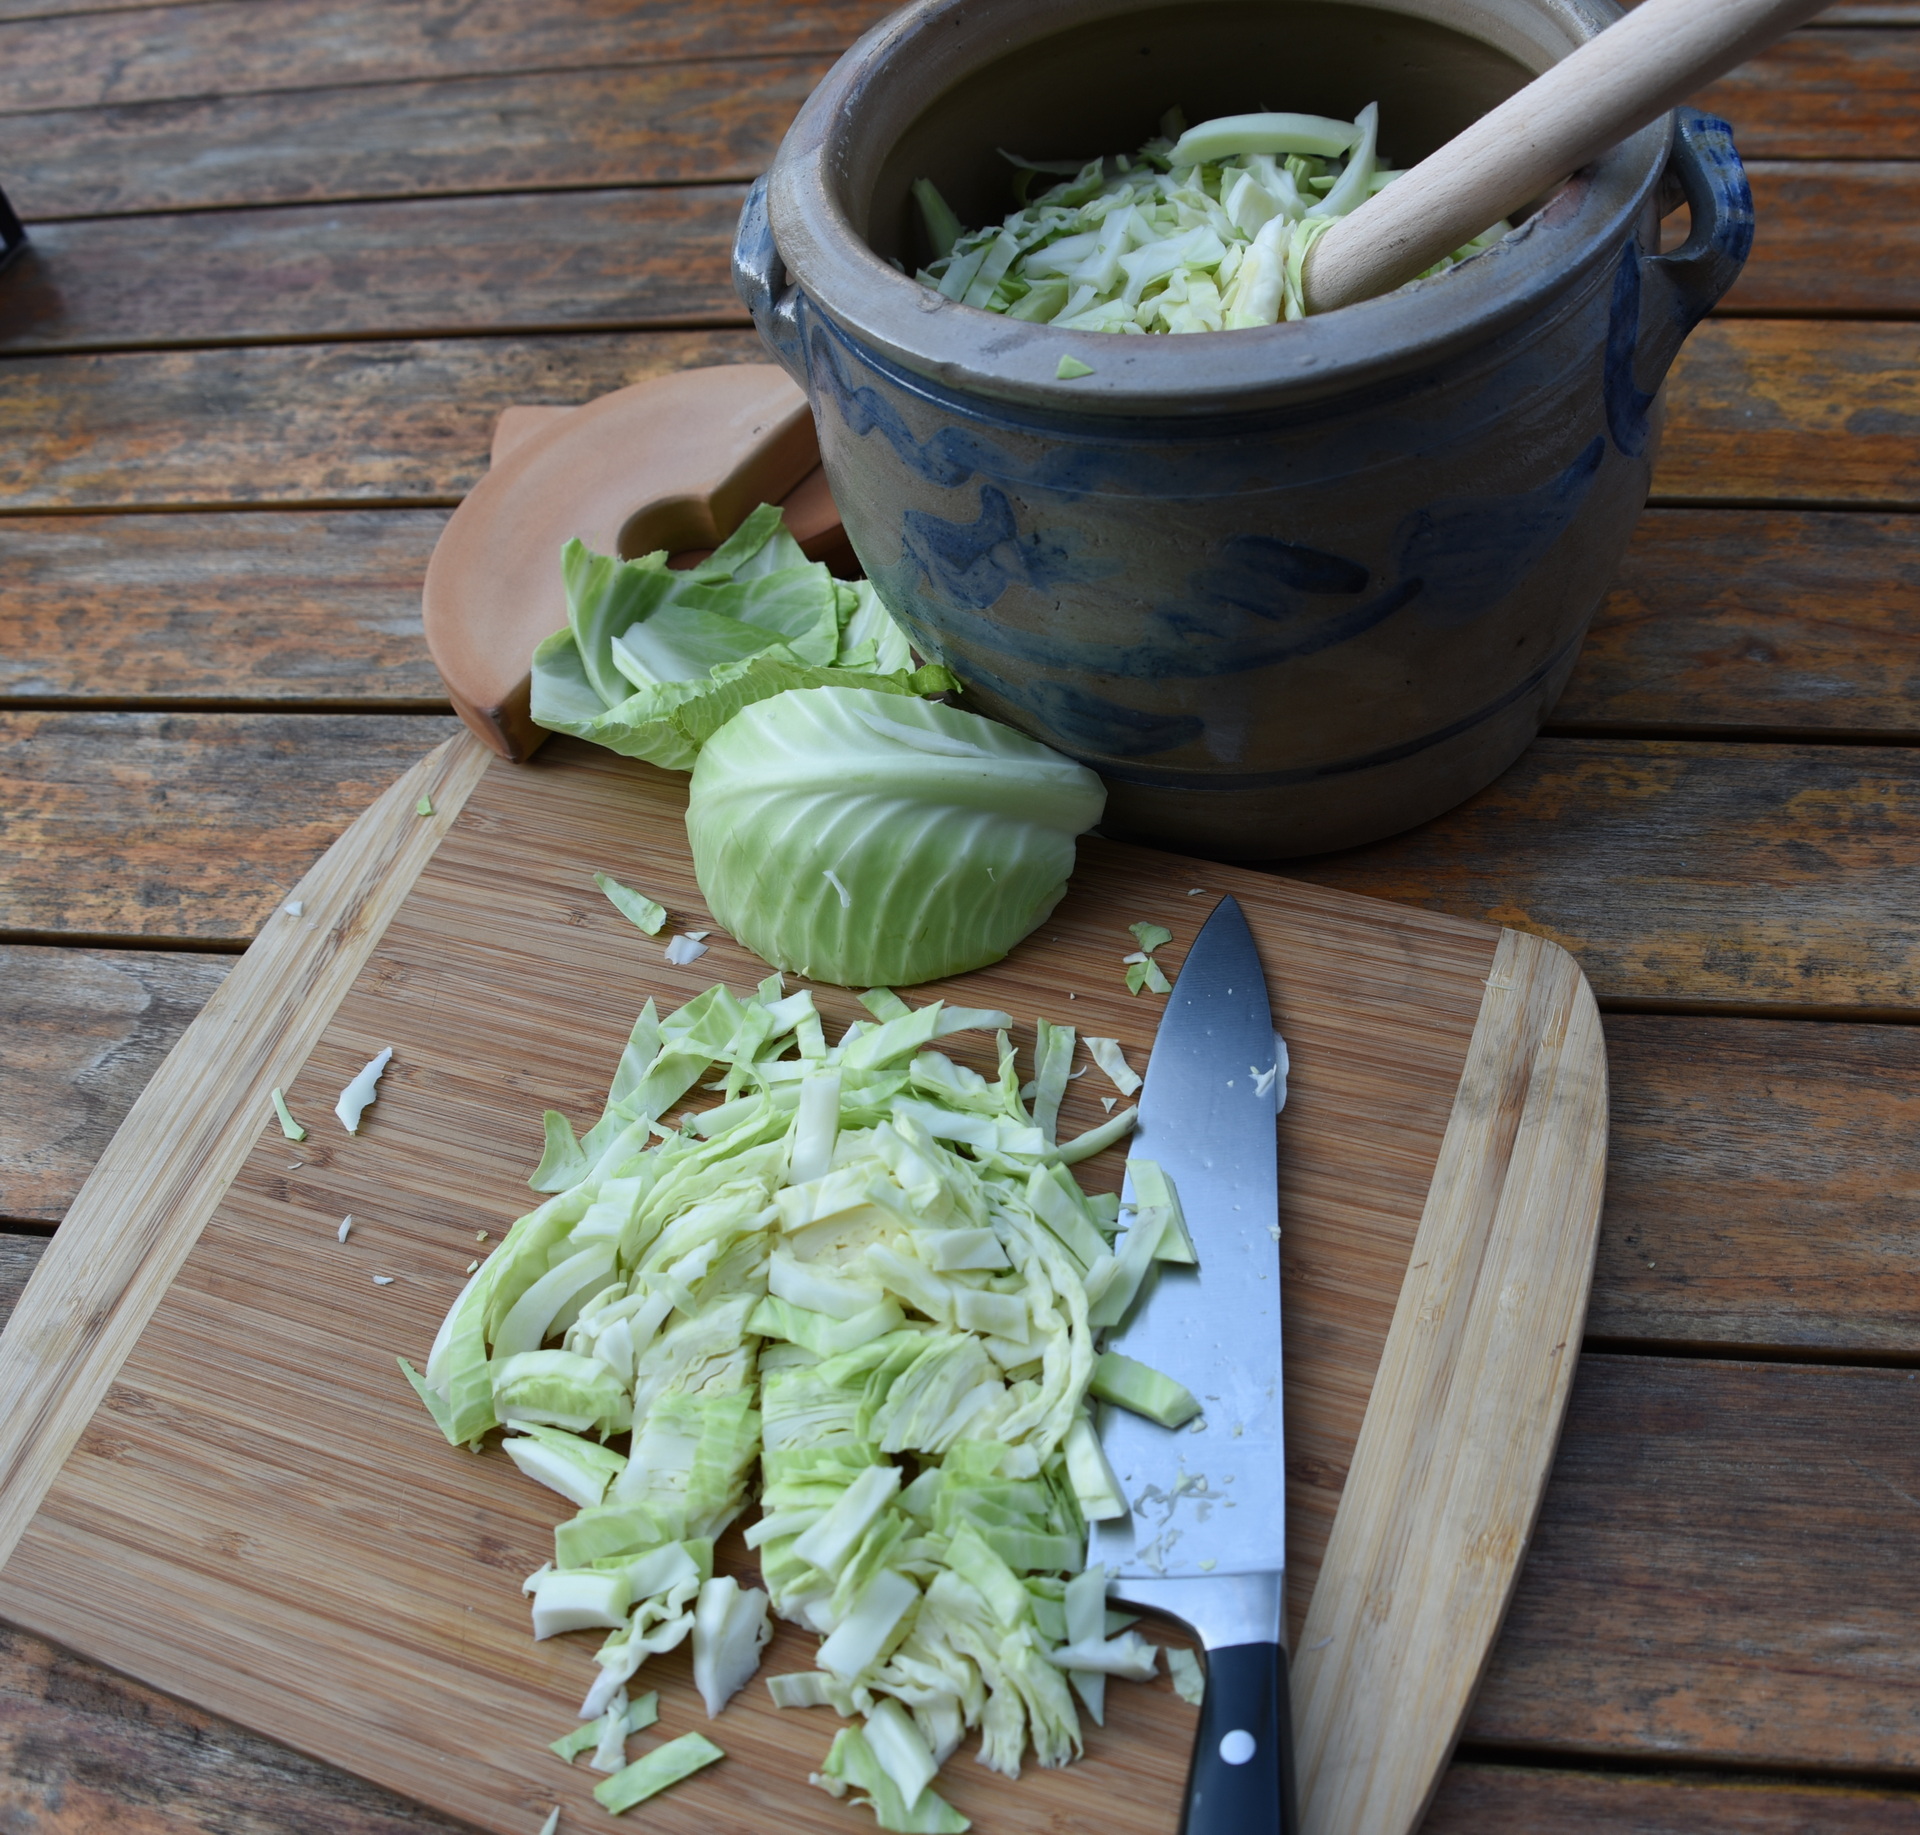
Take the largest leaves from one cabbage and lay them out at the bottom of your clean and rinsed out crock pot.
Shred the rest of the cabbage.
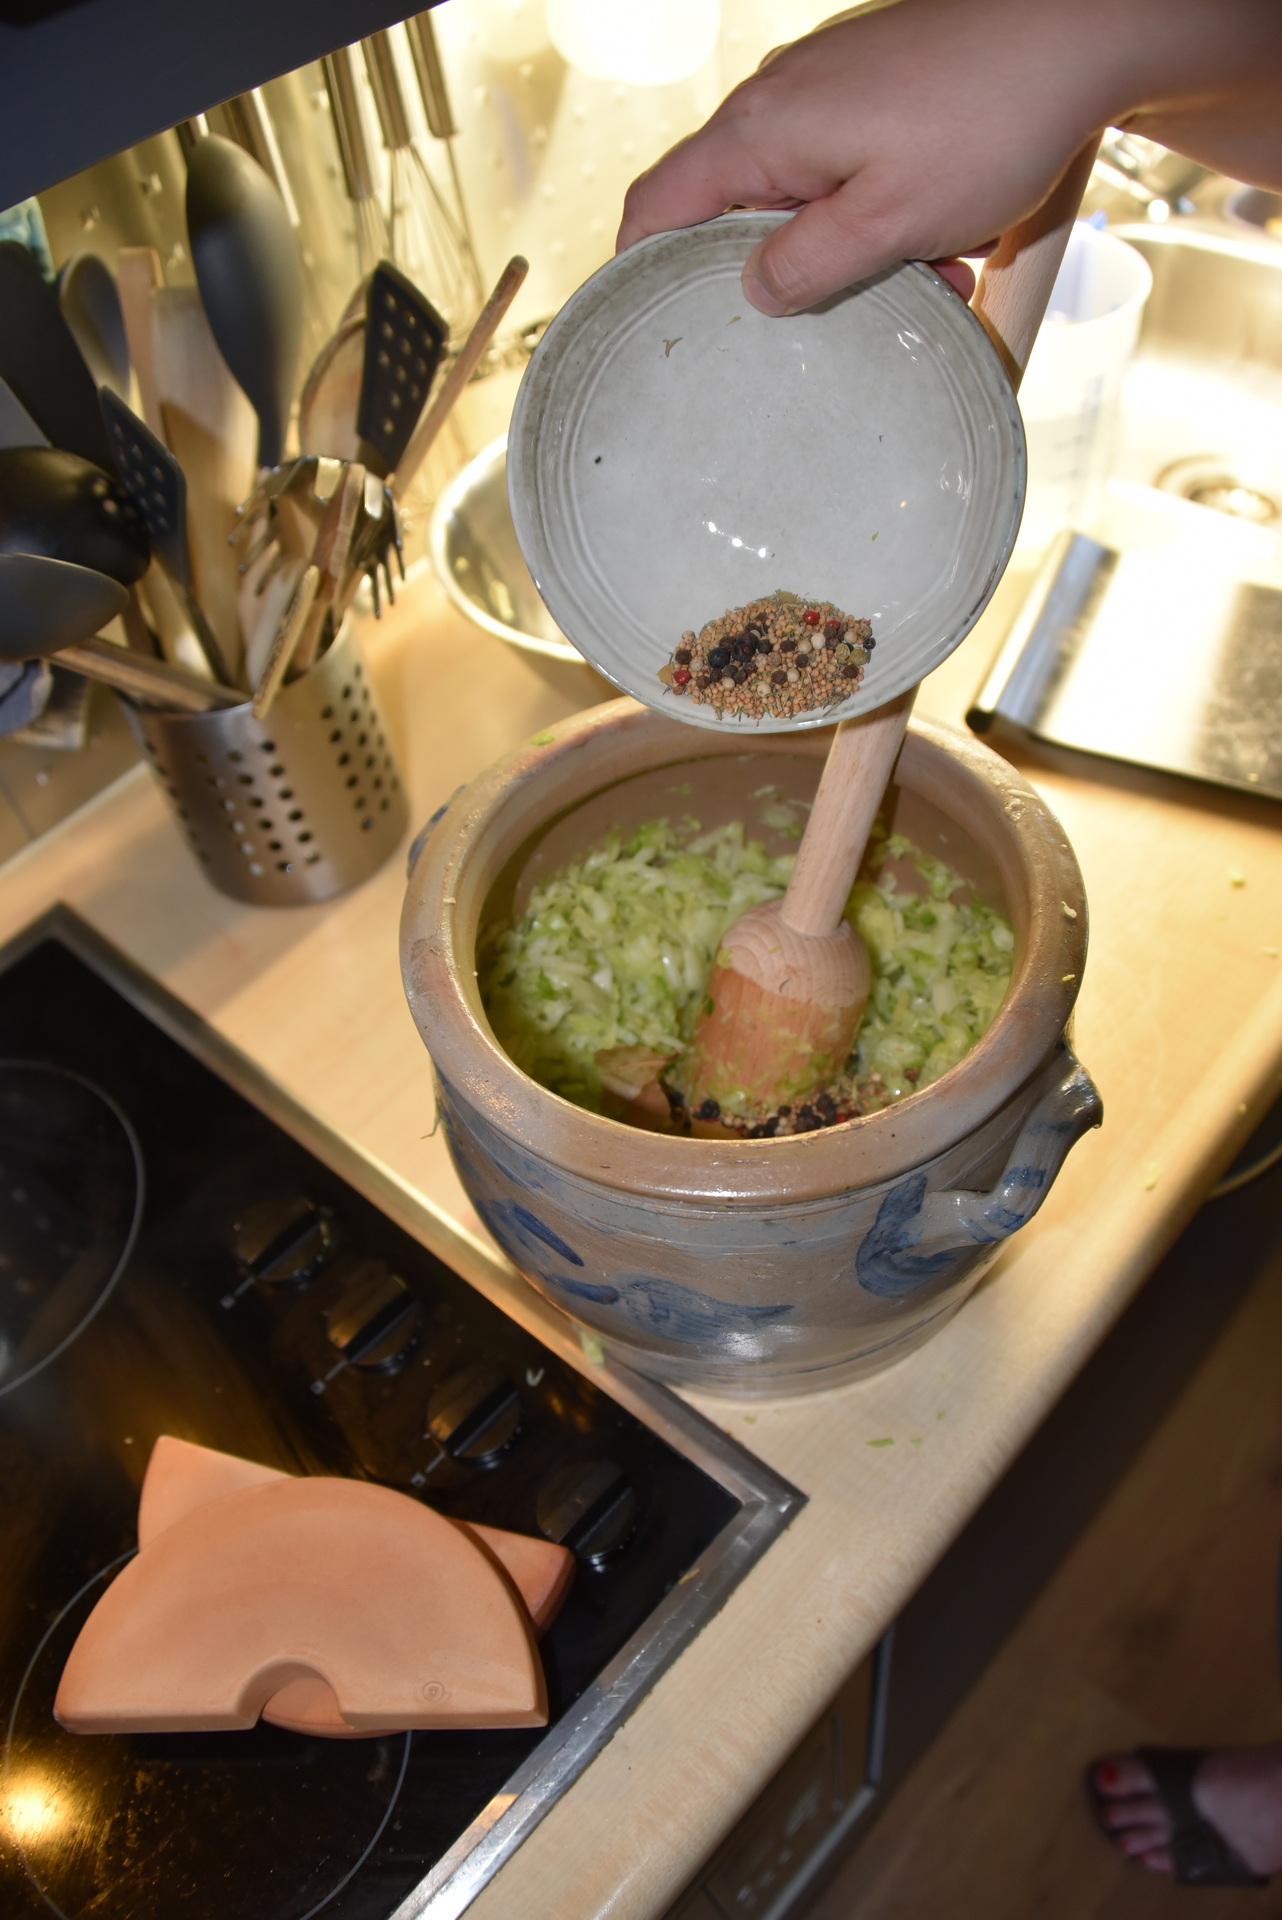
Add a layer of shredded cabbage over the laid out leaves in the crock pot. Sprinkle some of above mixture over this layer. Compress by stomping down with the stomper.
Repeat the layering process until you used up all the cabbage, salt, and juniper berries. After each layer stomp it down.
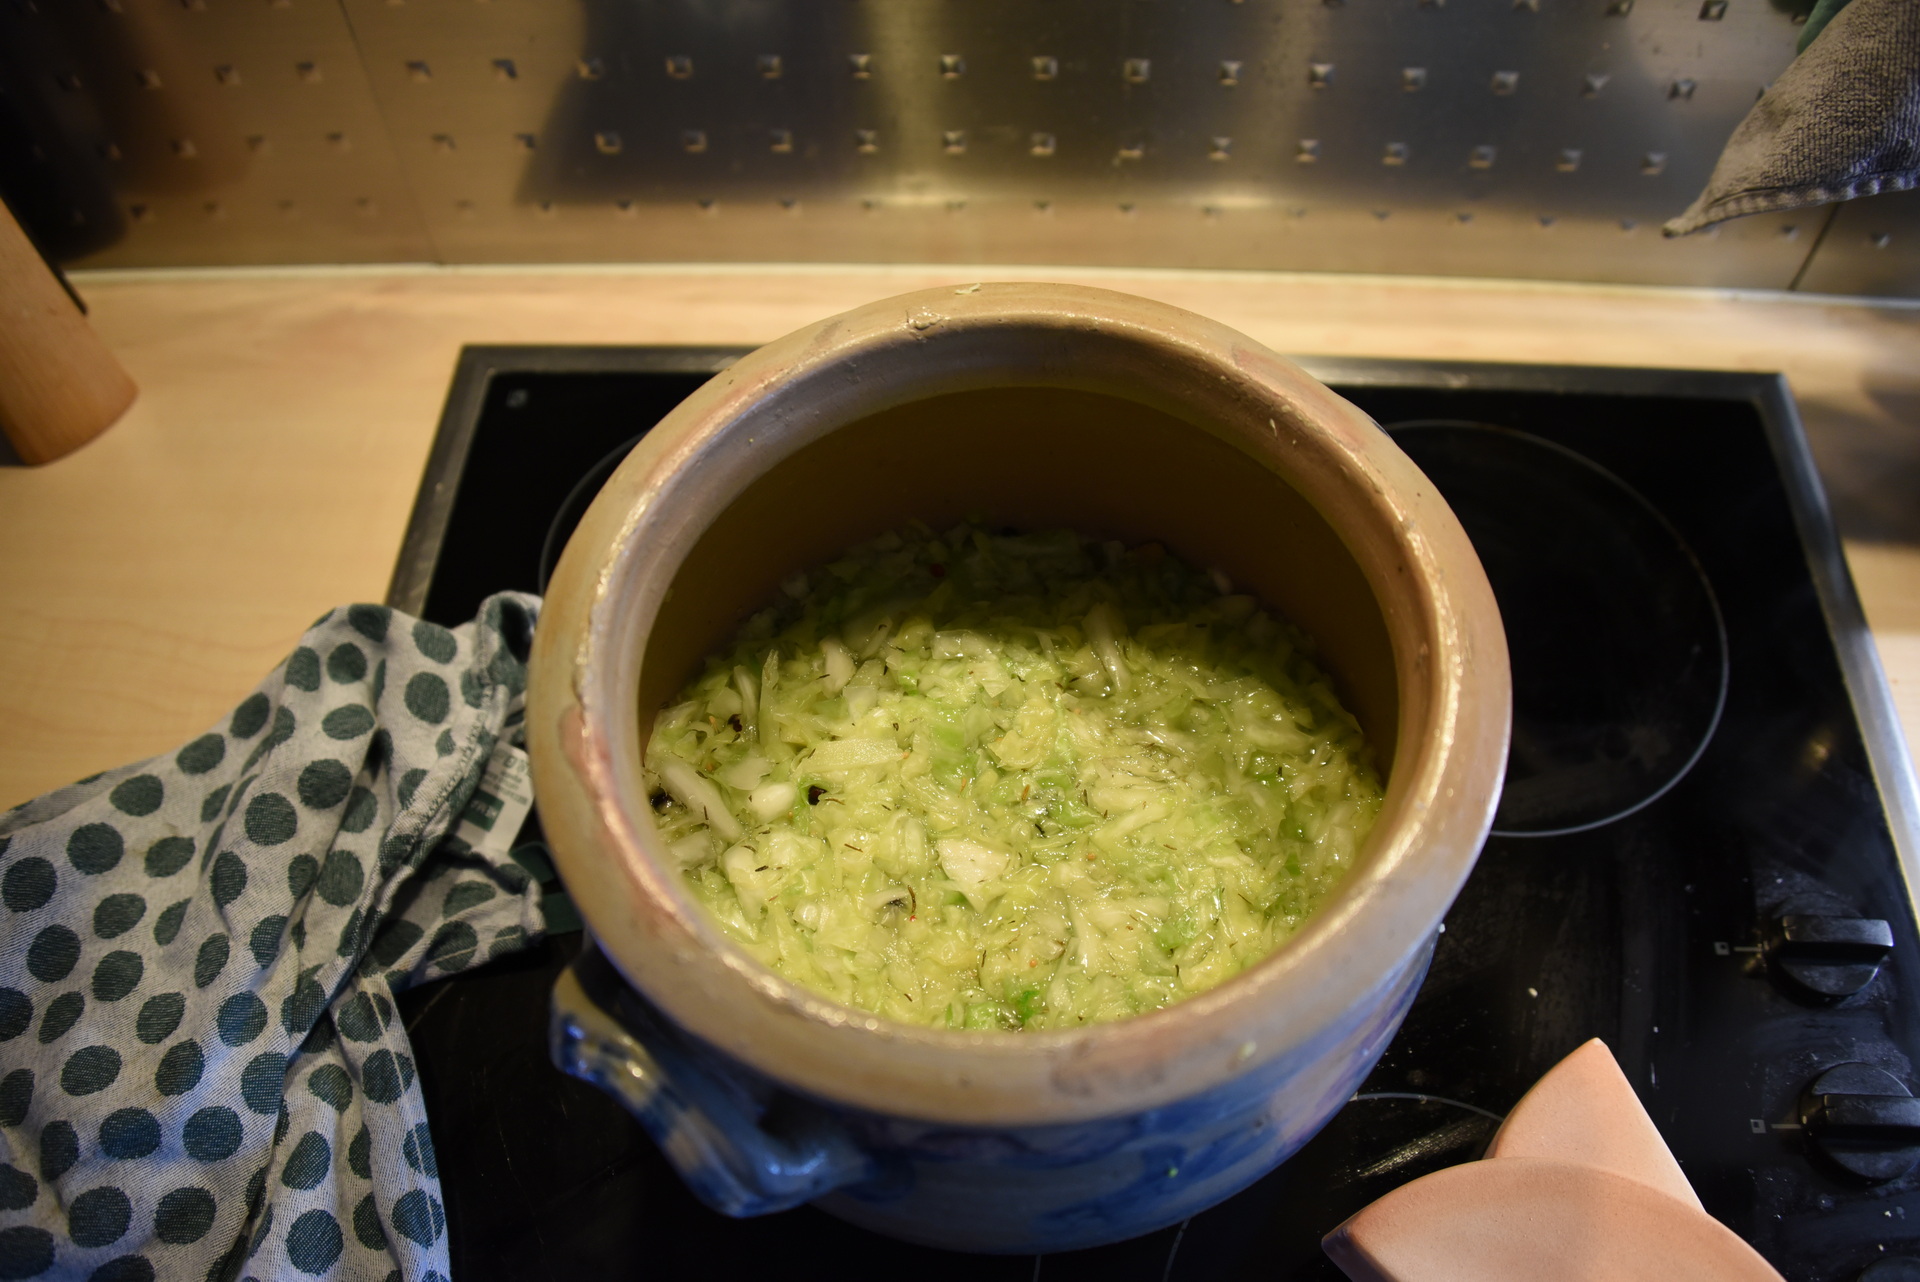
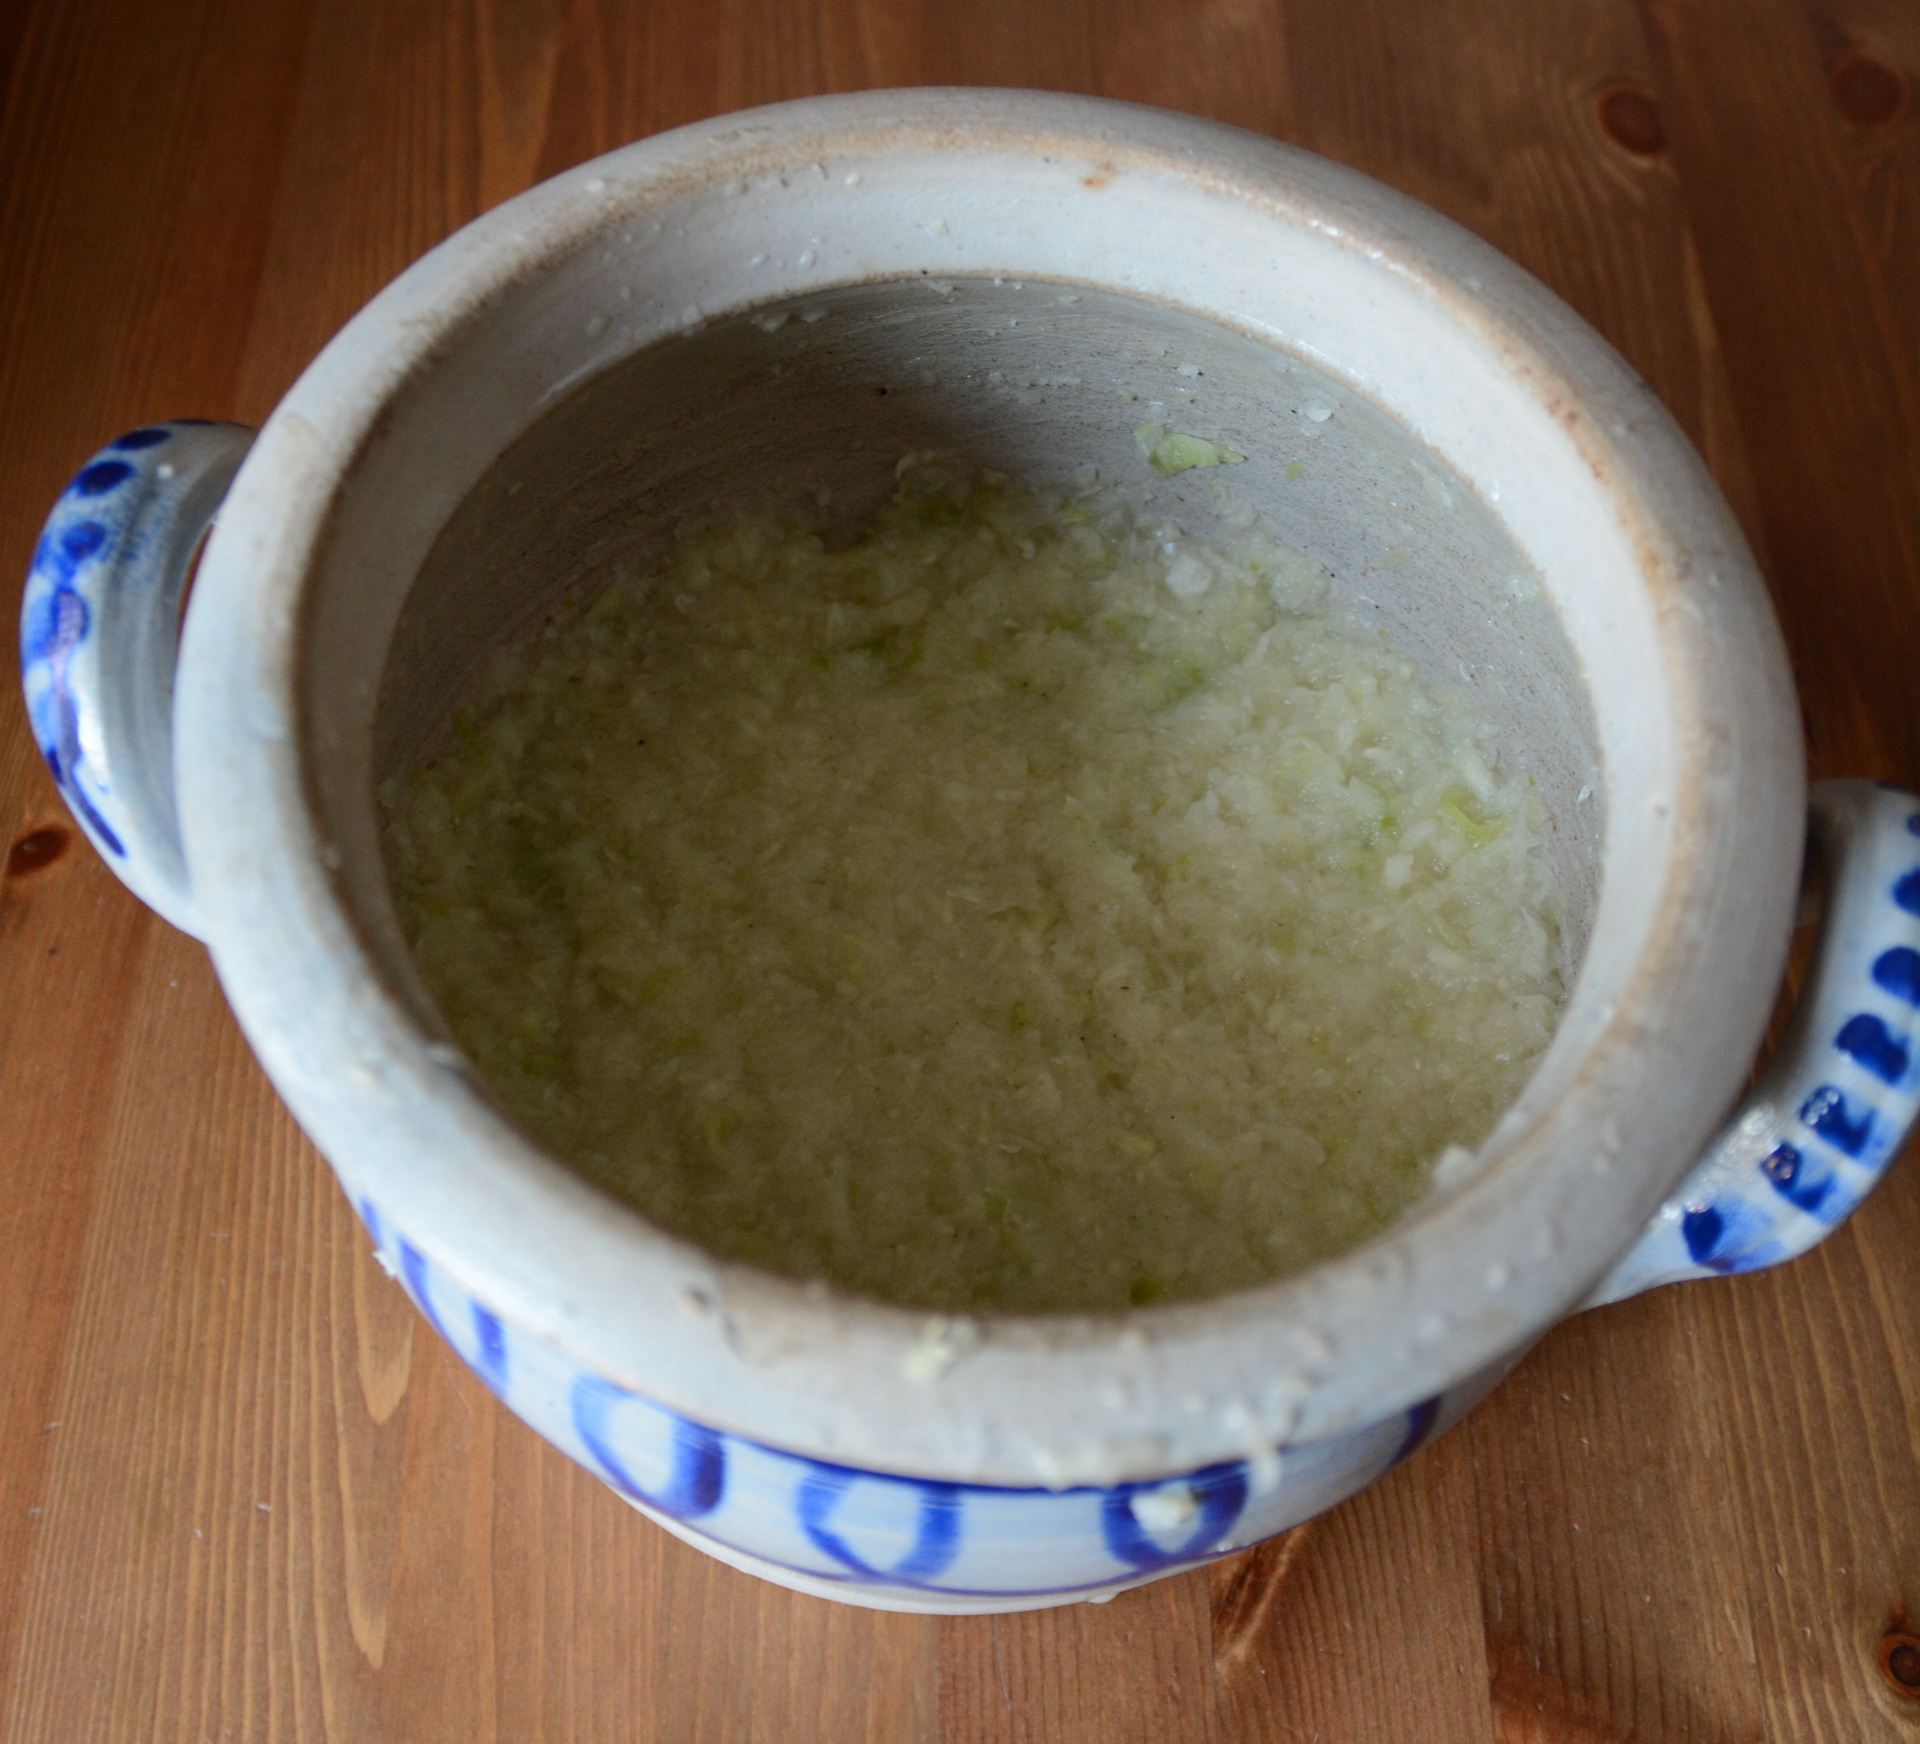
Pour all the luke warm water over the cabbage. That will activate the fermentation process.
Place clean crock pot weights over the cabbage and close the crock pot with the lid. Pour water into the ring of your crock pot and make sure there is always water in that.
Wait several weeks until cabbage is done fermenting into Sauerkraut.
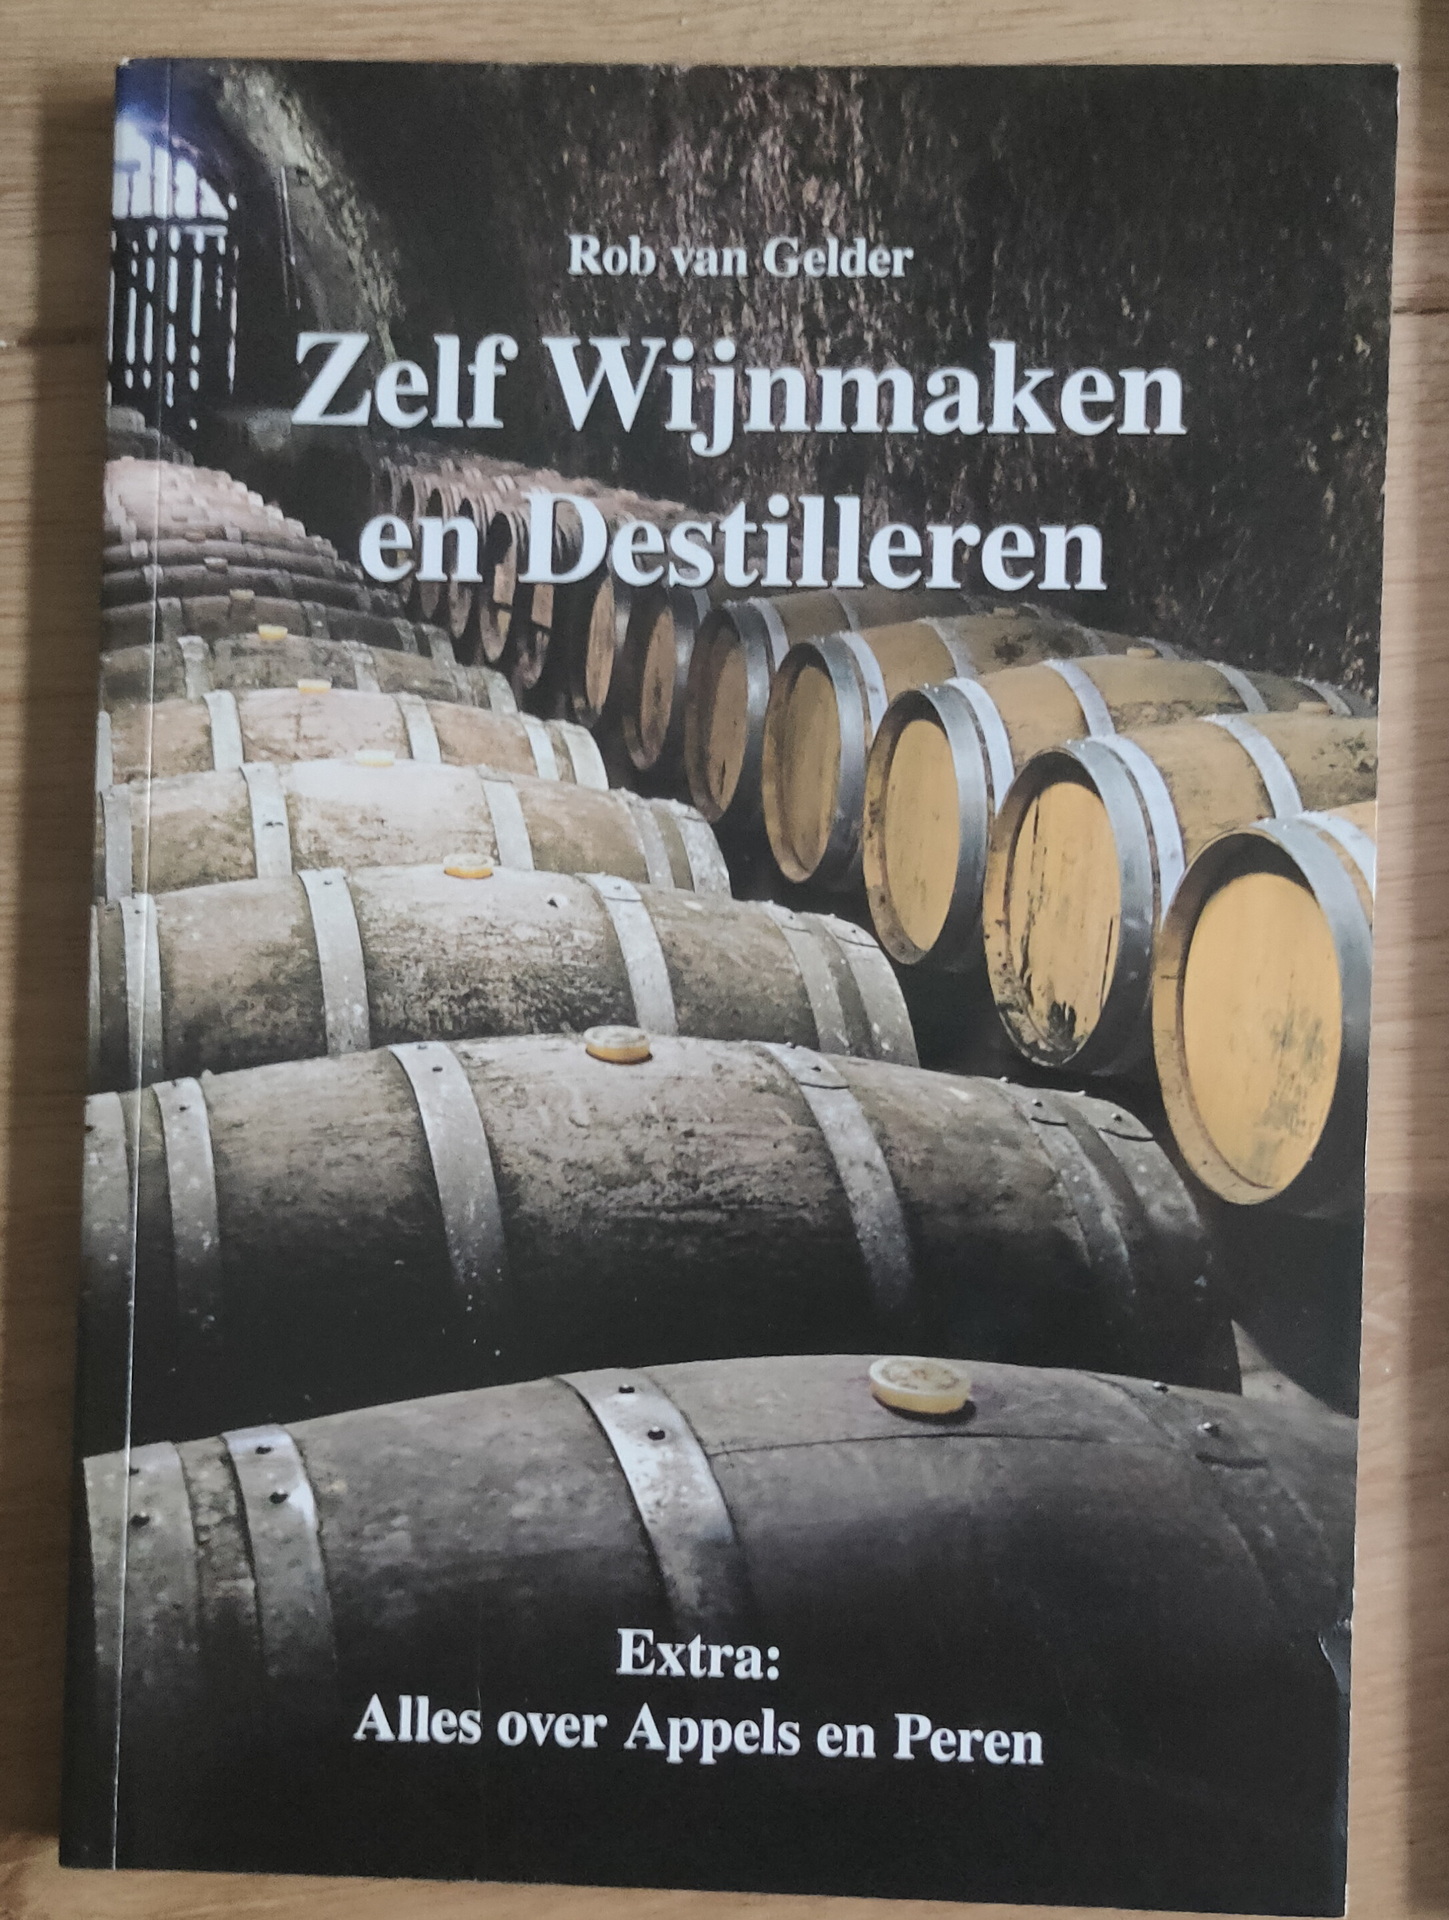
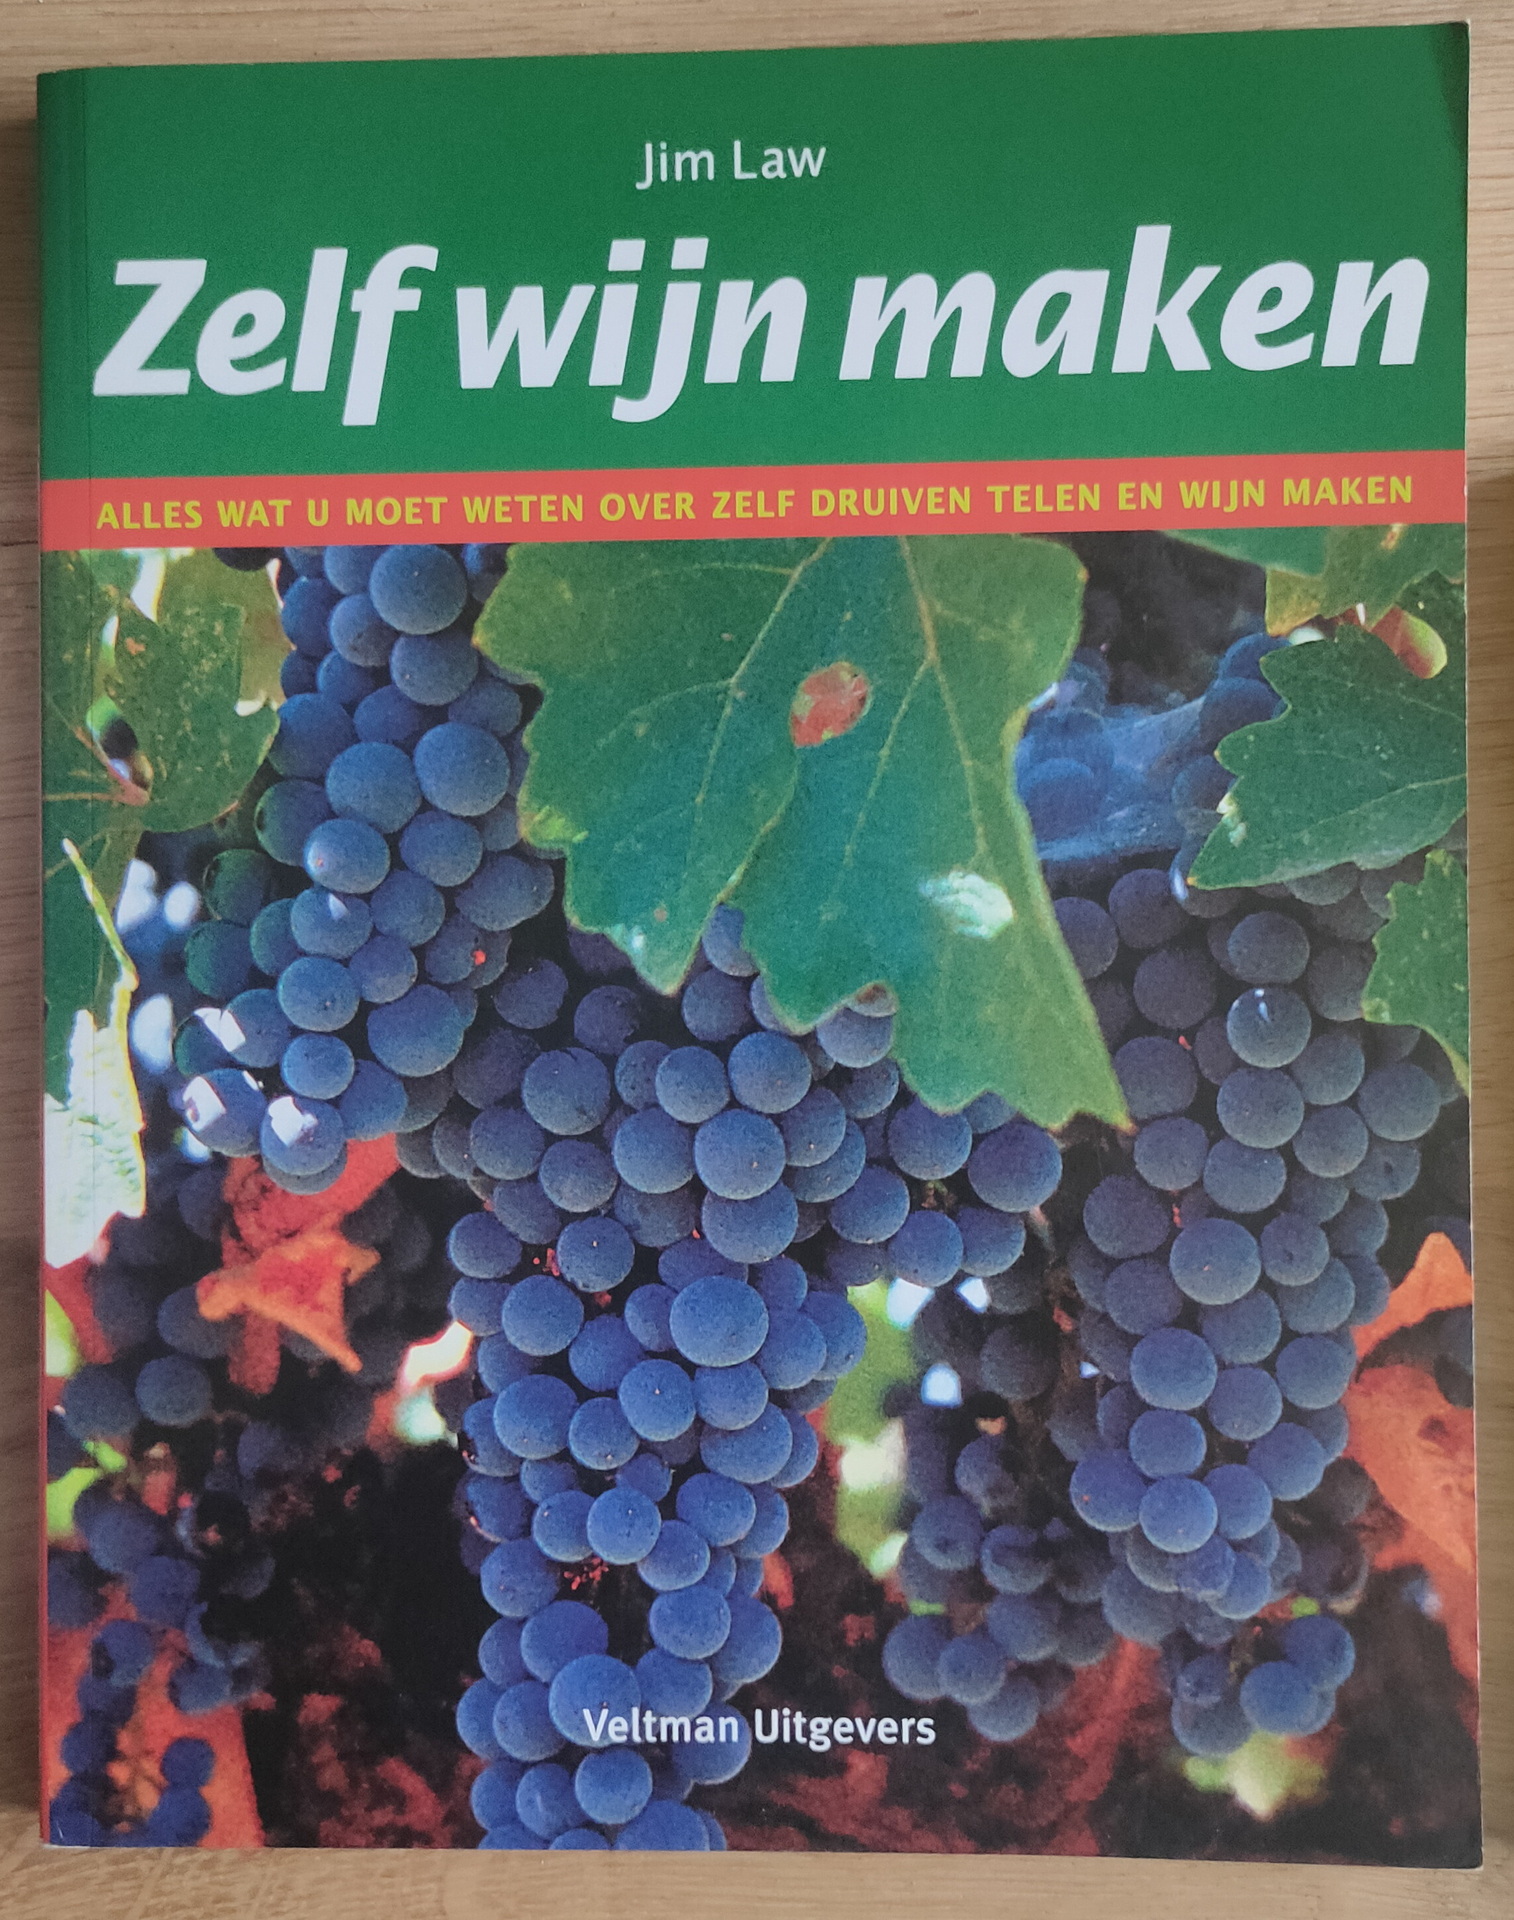
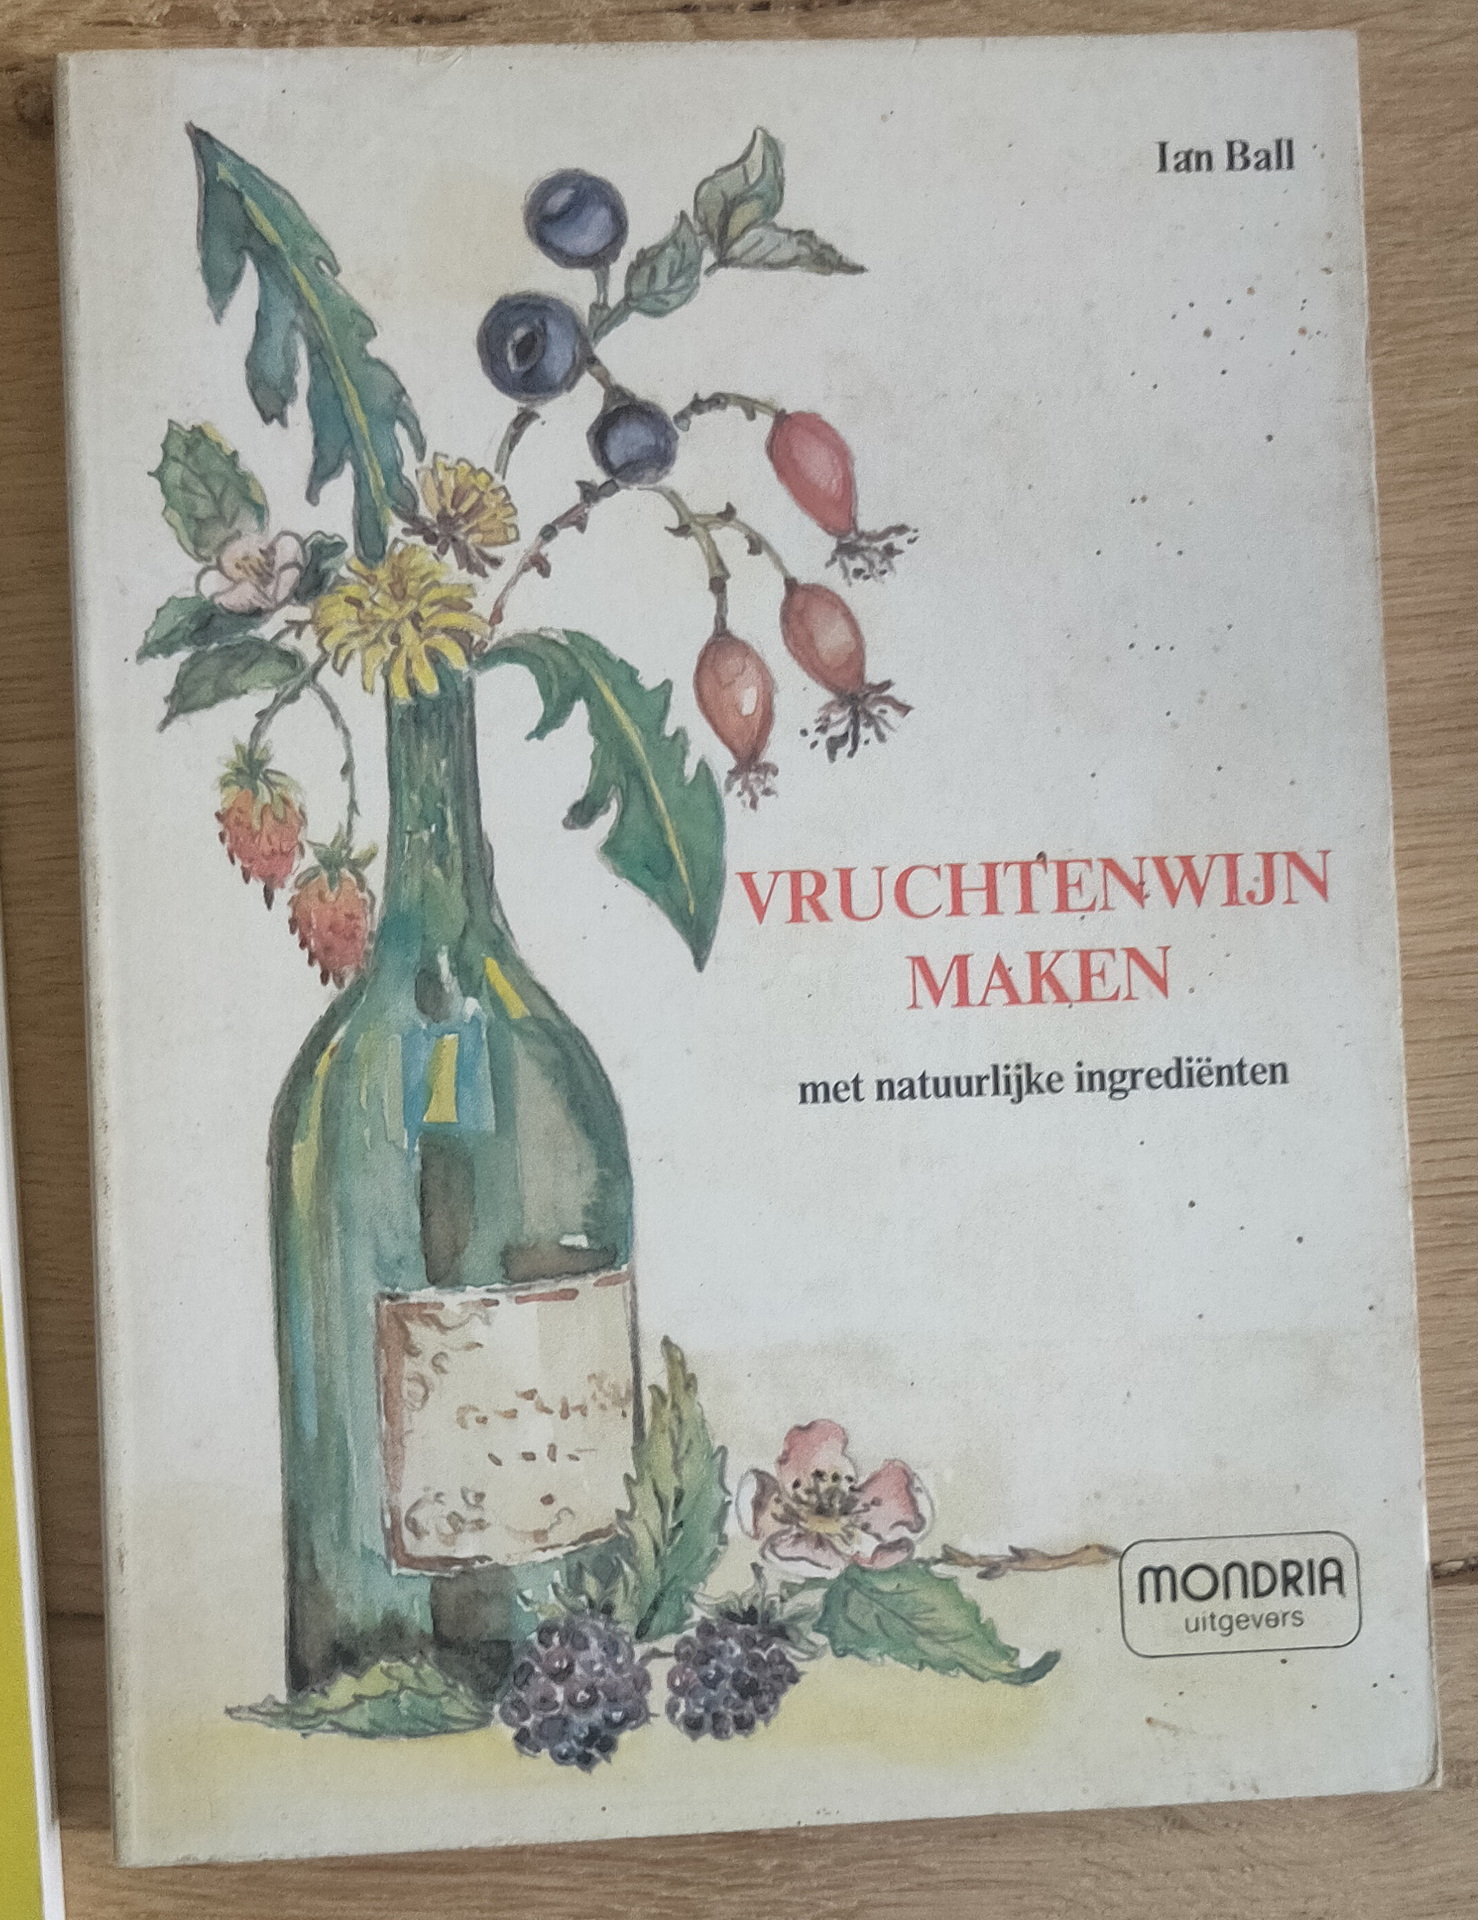
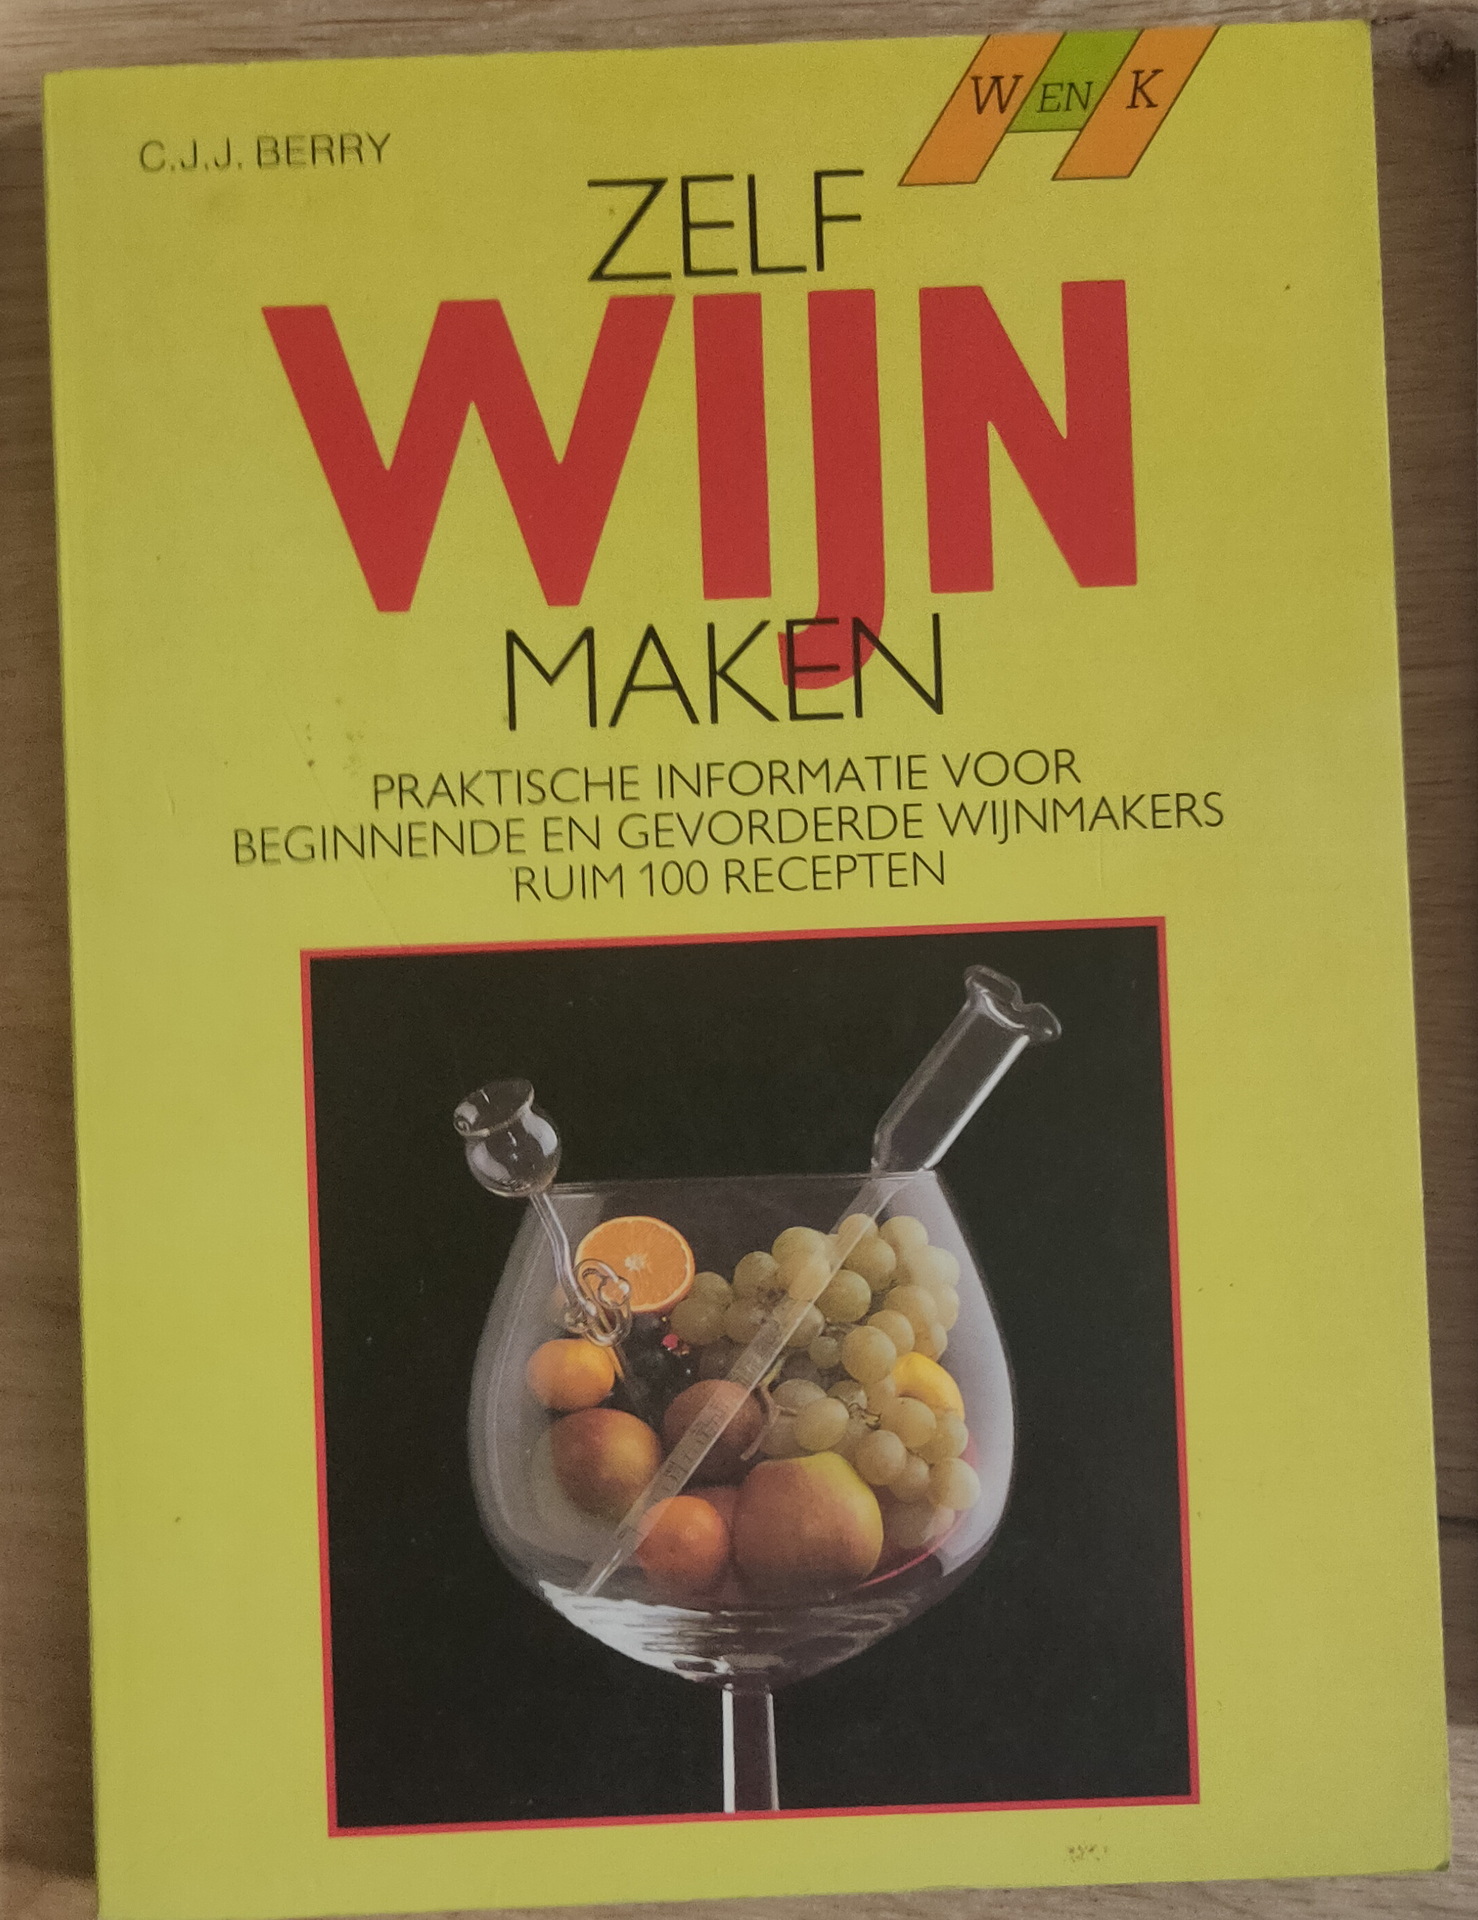
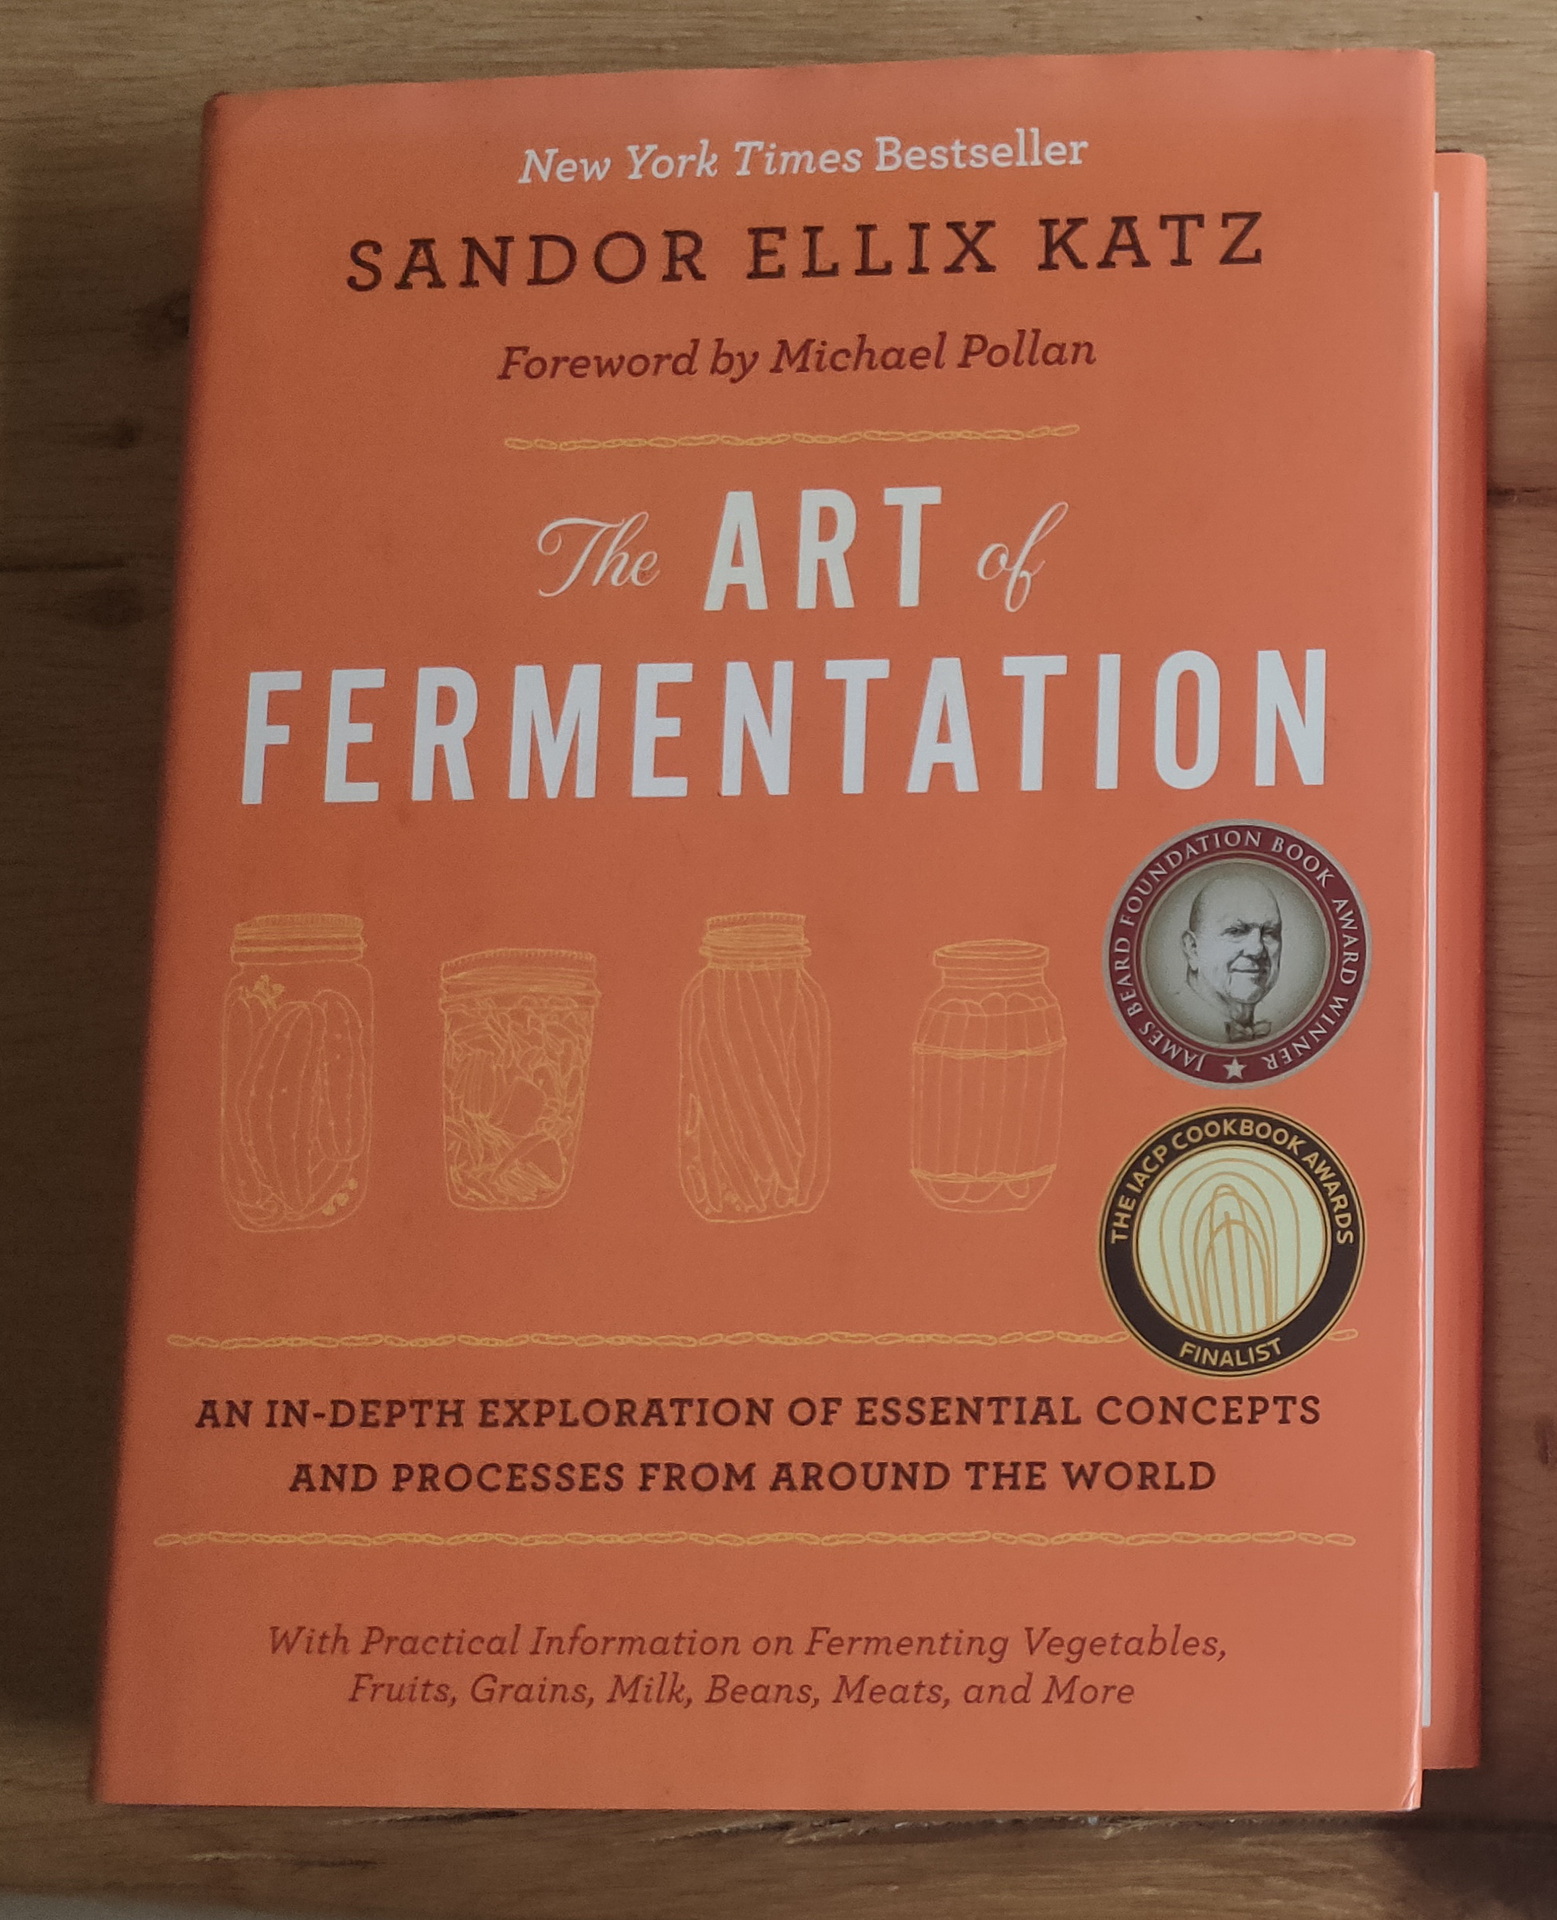
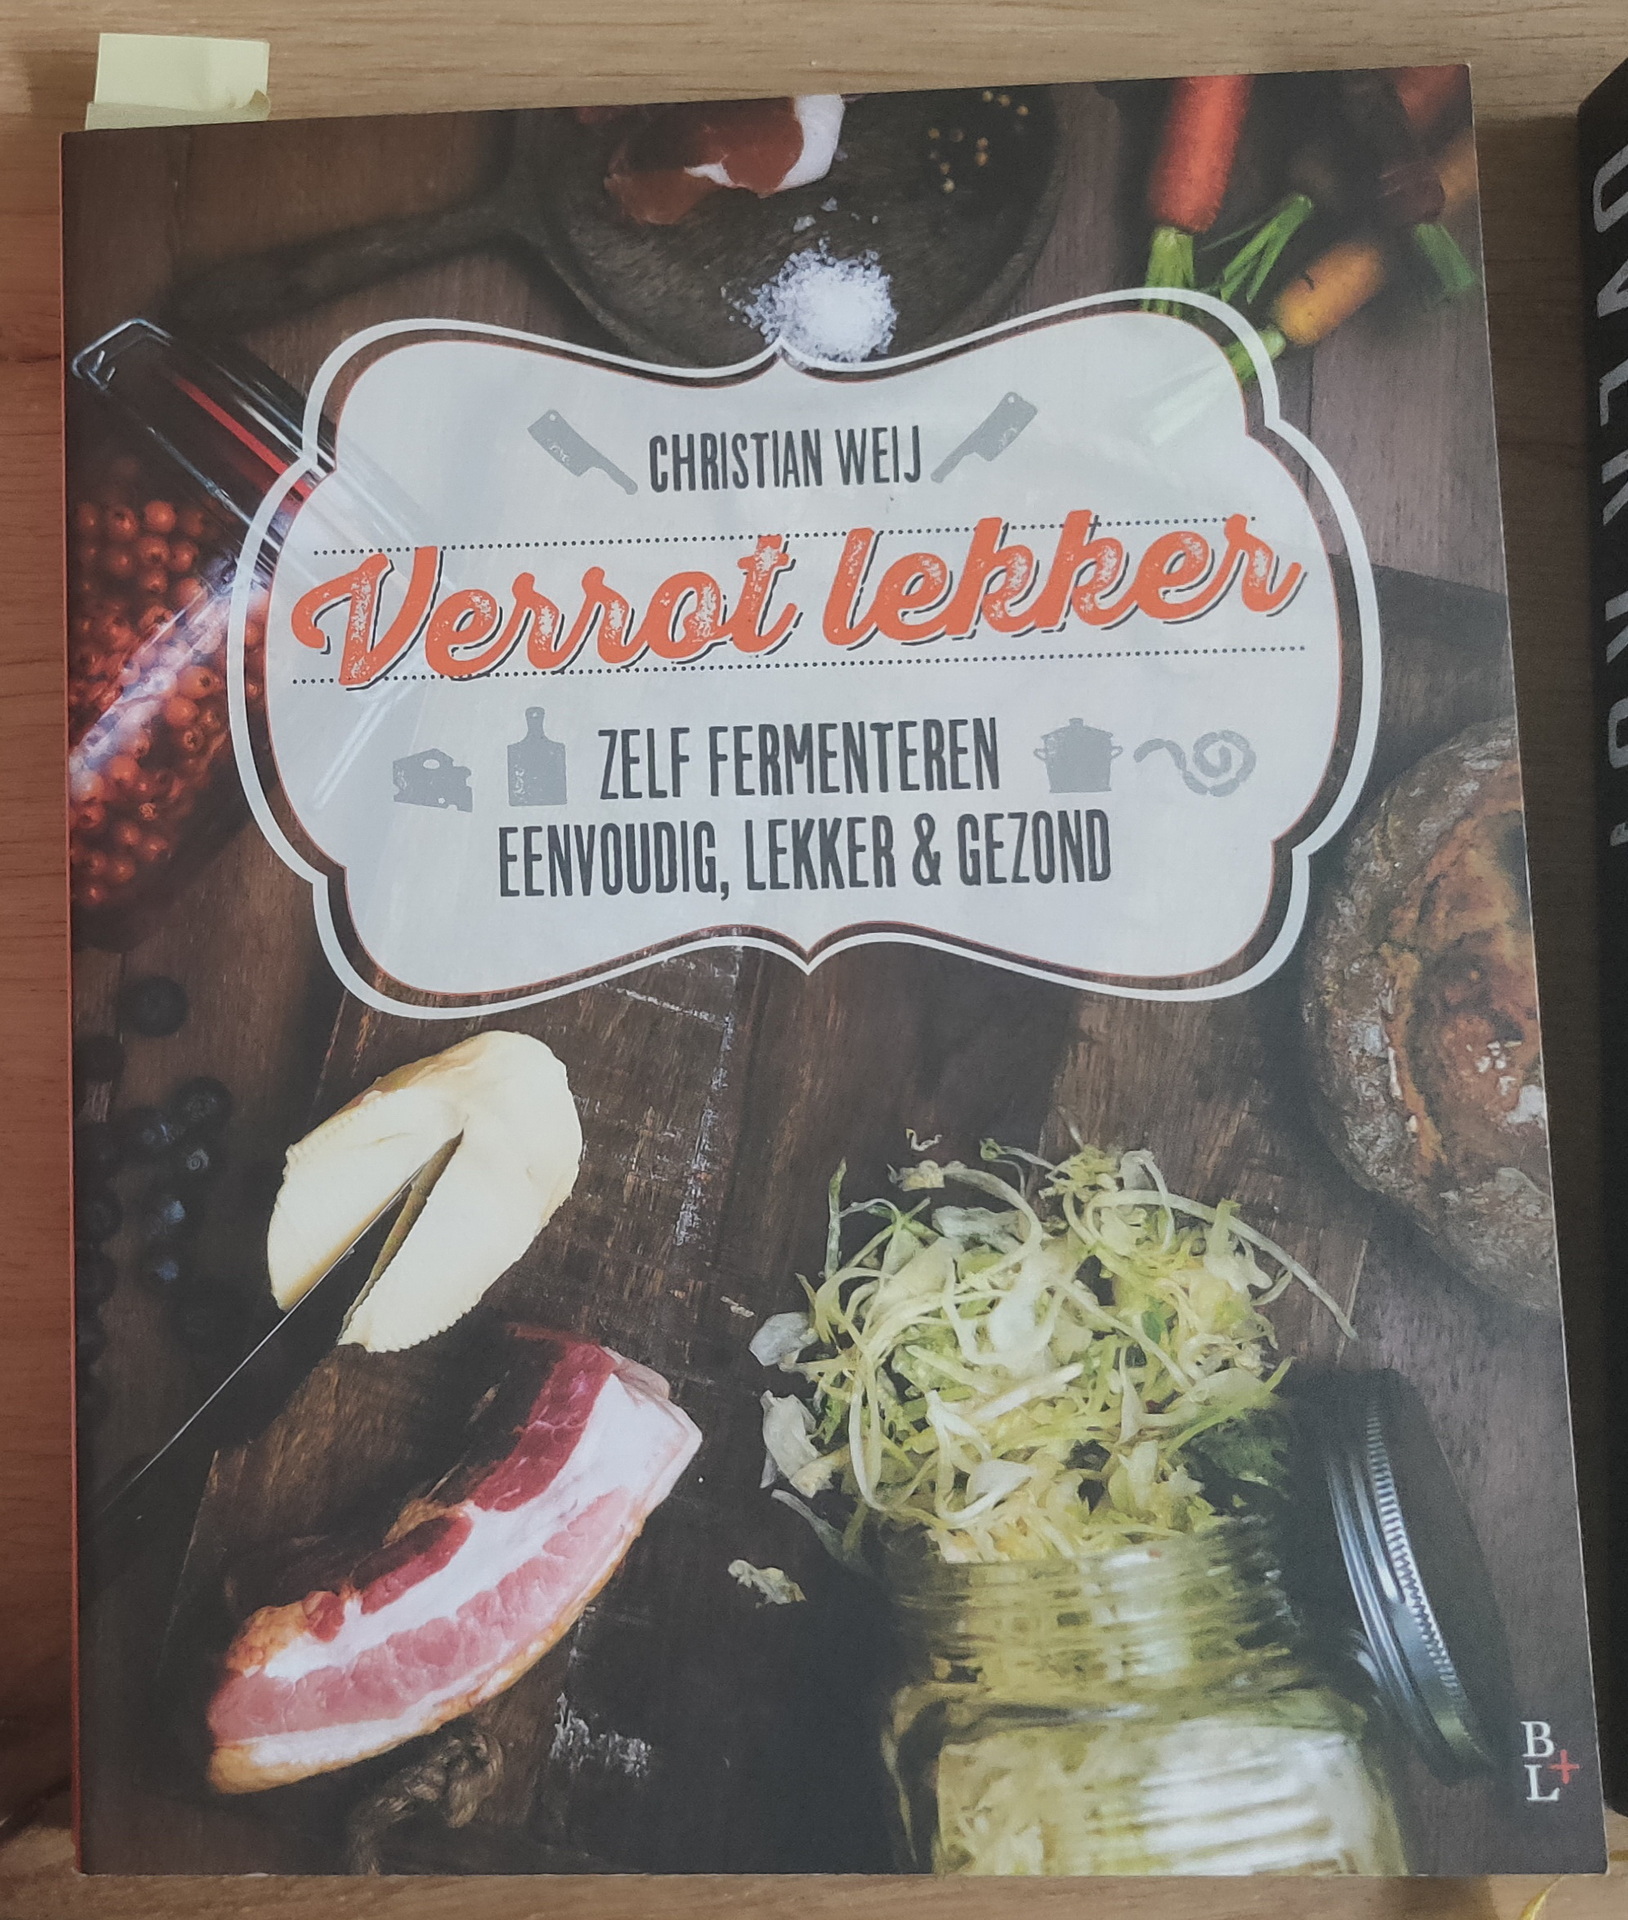
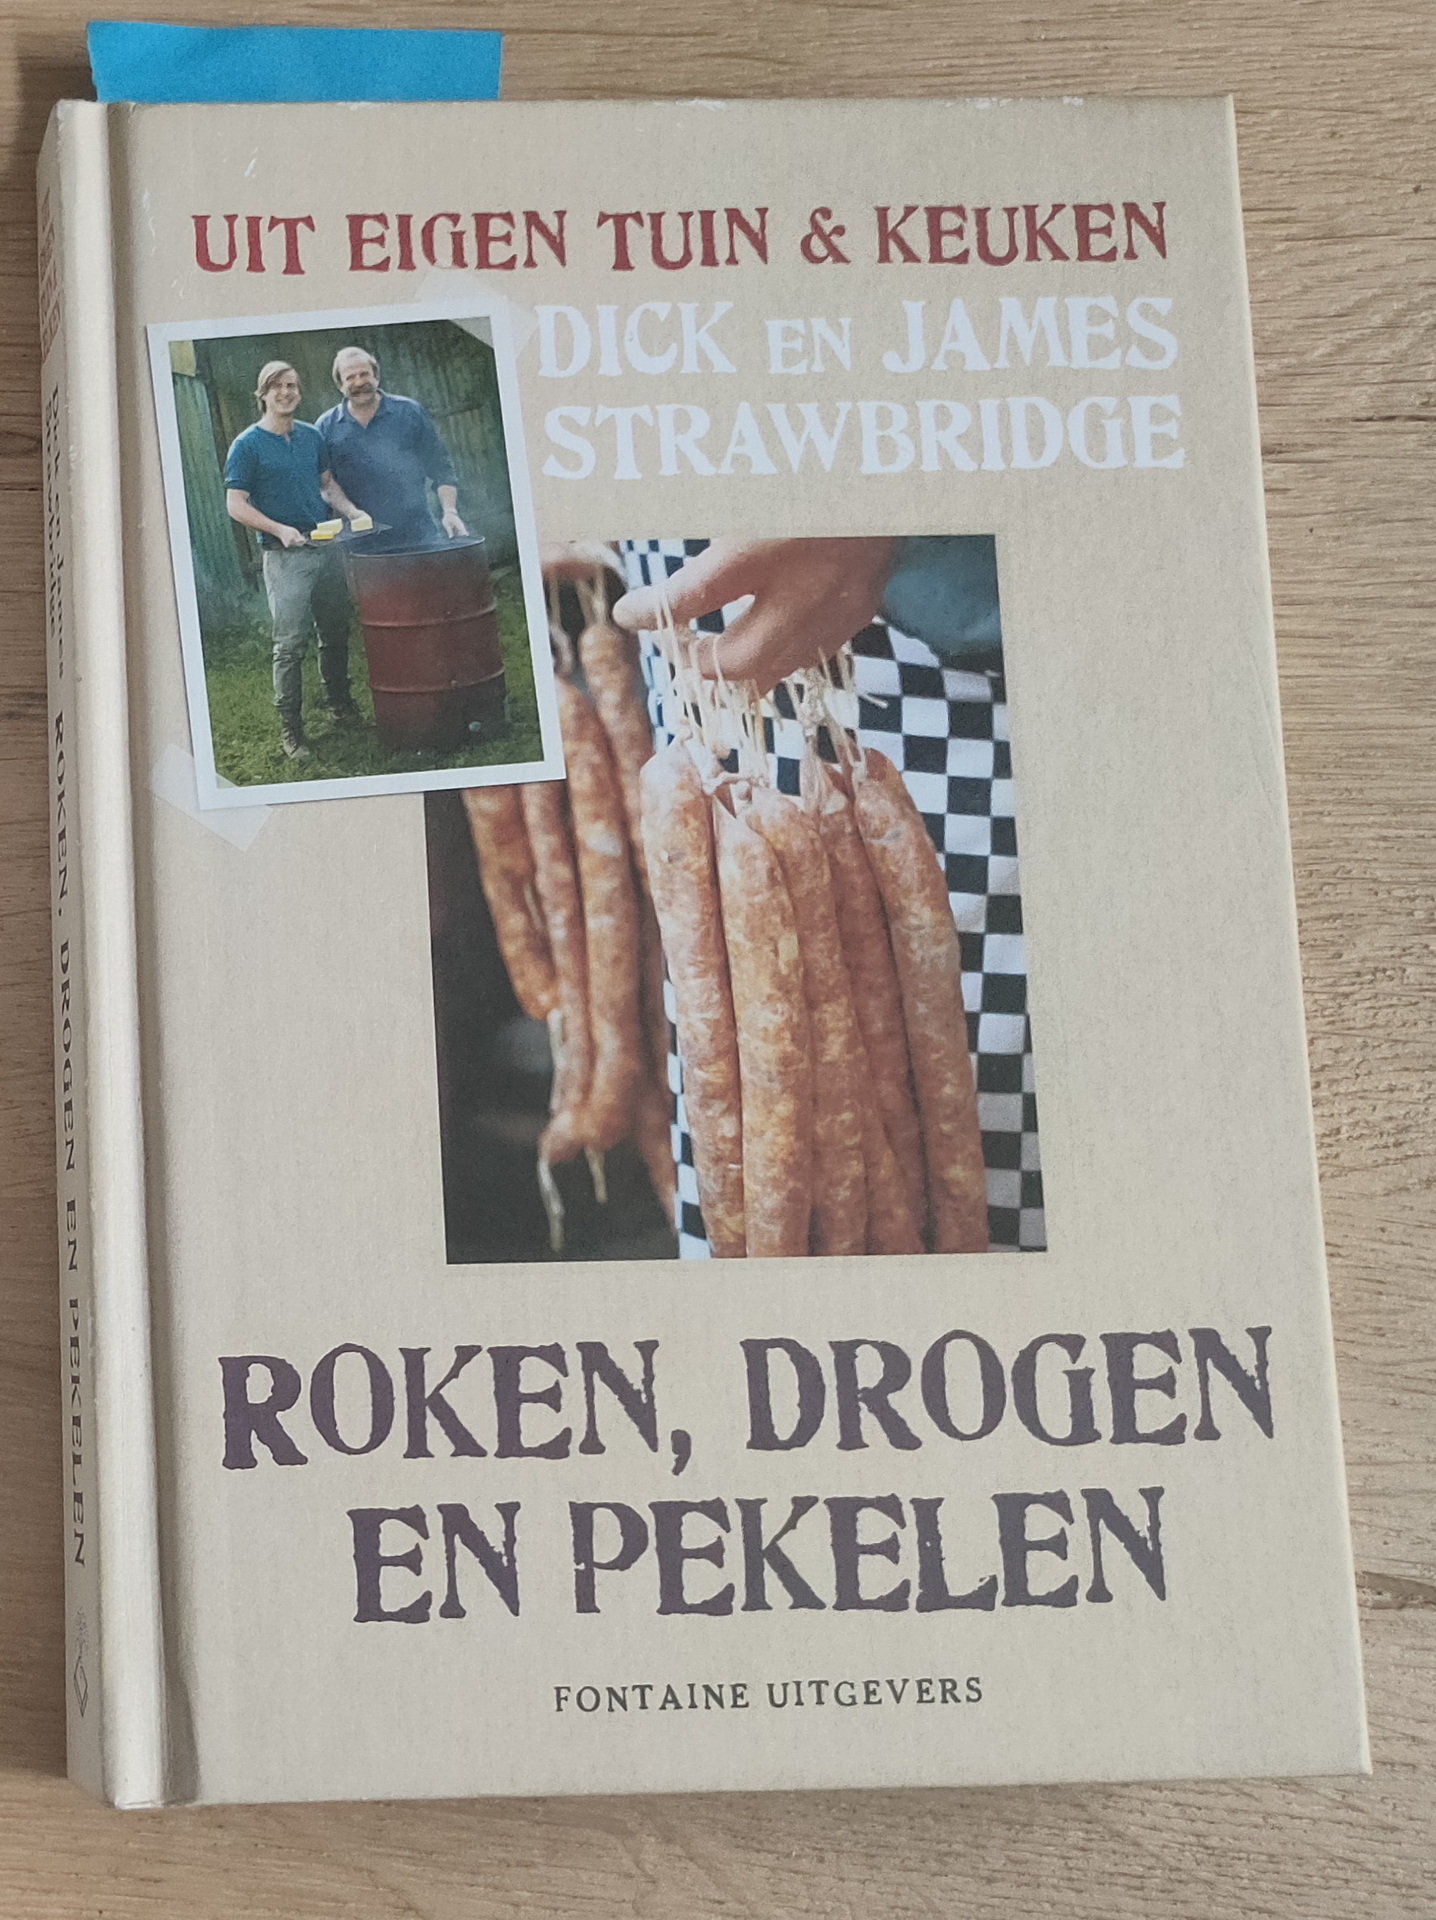
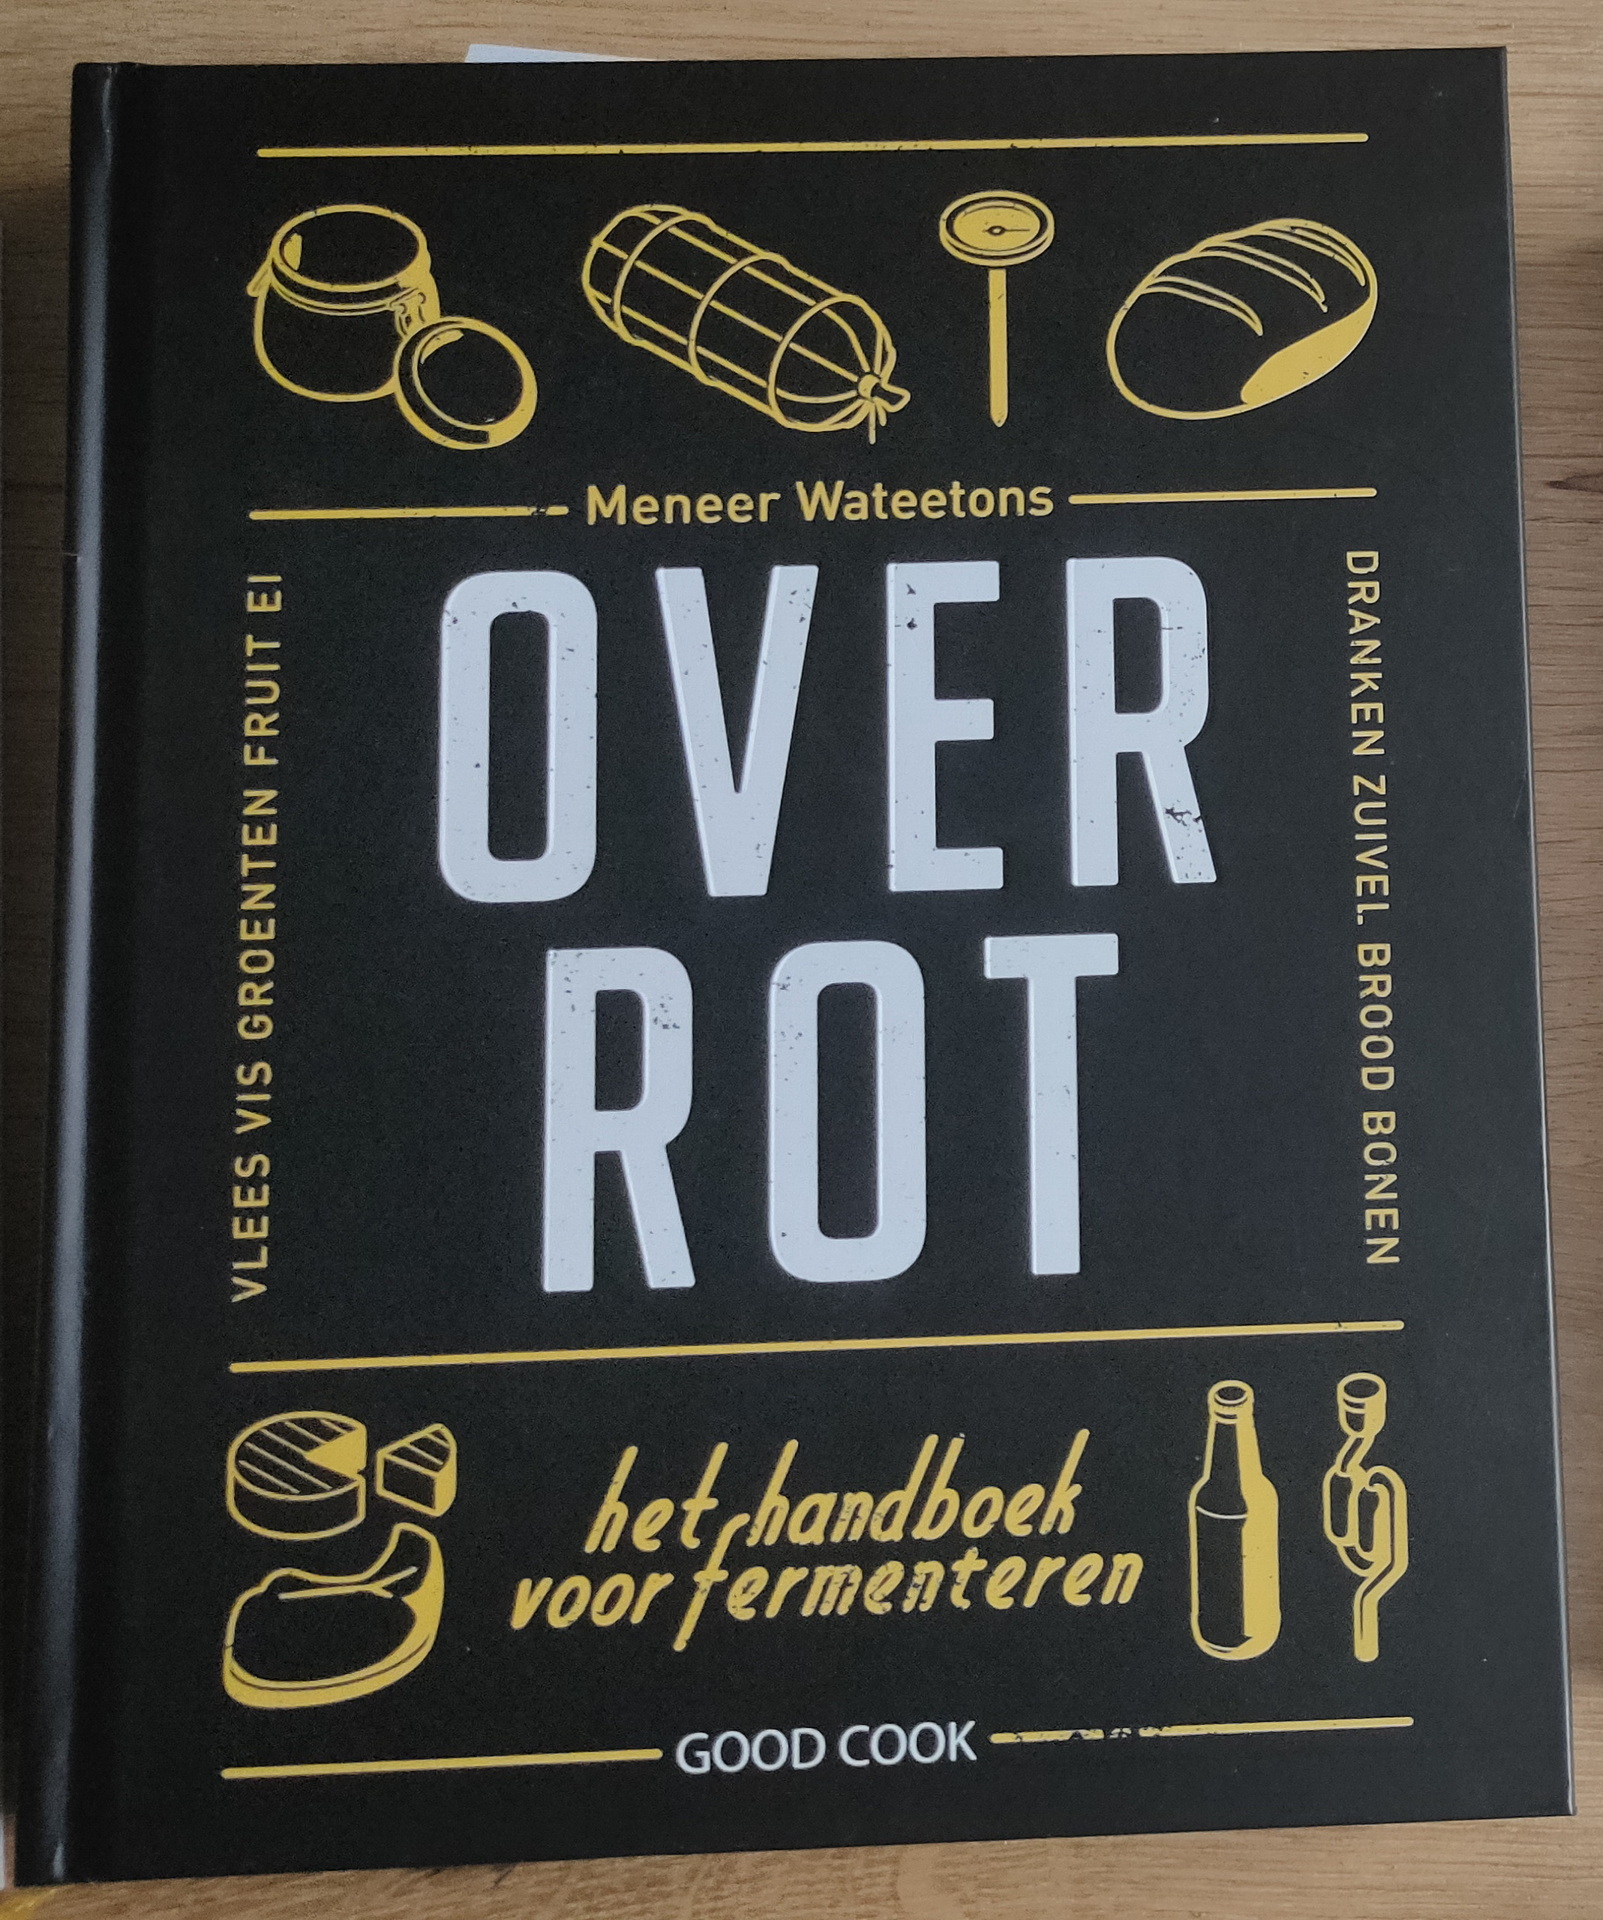
Some books about the subject we own
"If something is worth doing, it's worth overdoing."